INTRODUCTION
Barrier islands are elongated accumulations of unconsolidated sediments (mainly sand, but also gravel) constructed chiefly by waves (in areas where tidal amplitudes are usually <4 m) that are separated from the mainland by bays, lagoons, and/or marshes and tidal creek systems (e.g., Hayes and FitzGerald, Reference Hayes and FitzGerald2013; Otvos, Reference Otvos2020). The combination of geological environment, sediment availability, and hydrodynamic forcing controls their development and maintenance (e.g., Cooper and Pilkey, Reference Cooper and Pilkey2004; Stutz and Pilkey, Reference Stutz and Pilkey2011), including concurrent sedimentary environments such as beaches, foredunes, dune fields, barrier flats, wetland areas (marshland, mangroves), washover fans, spits, tidal flats, and back-barrier lagoon/bay (Oertel, Reference Oertel1985). These subenvironments interact and evolve in a complex way in response to the physical processes and environmental factors that influence their evolution (Duc and Tye, Reference Duc and Tye1987; Switzer et al., Reference Switzer, Bristow and Jones2006) such as: relative sea-level changes (e.g., Sloss et al., Reference Sloss, Jones, Murray-Wallace and MacLennen2005; Seminack and Buynevich, Reference Seminack and Buynevich2013); paleotopography (e.g., Borges, Reference Borges1998; Dillenburg et al., Reference Dillenburg, Roy, Cowell and Tomazelli2000; Guedes et al., Reference Guedes, Giannini, Sawakuchi, Dewitt, Nascimento, Aguiar and Rossi2011); sediment supply (e.g., Lessa et al., Reference Lessa, Angulo, Giannini and Araújo2000; Kinsela et al., Reference Kinsela, Daleya and Cowell2016); and inherited geologic framework (e.g., Riggs et al., Reference Riggs, Cleary and Snyder1995; Rodriguez et al., Reference Rodriguez, Anderson, Siringan and Taviani2004).
Although most evolutionary models of coastal barrier genesis emphasize transgressive processes (e.g., Leatherman, Reference Leatherman1985; Oertel, Reference Oertel1985; Dillenburg and Hesp, Reference Dillenburg and Hesp2009), several studies have shown that deposition under regressive conditions is important for the genesis and development of these systems (e.g., Duc and Tye, Reference Duc and Tye1987; Lessa et al., Reference Lessa, Angulo, Giannini and Araújo2000; Giannini et al., Reference Giannini, Guedes, Nascimento, Tanaka, Angulo, Assine, Souza, Dillenburg and Hesp2009). Among the sedimentary processes that increase stratigraphic complexity of coastal barriers are the migration of tidal channels and inlets, as a result of sediment transport through coastal drift (e.g., Switzer et al., Reference Switzer, Bristow and Jones2006; Seminack and Buynevich, Reference Seminack and Buynevich2013), as well as changes in the depositional and erosional processes due to climate variations (e.g., Sawakuchi et al., Reference Sawakuchi, Kalchgruber, Giannini, Nascimento, Guedes and Umisedo2008; Timmons et al., Reference Timmons, Rodriguez, Mattheus and Dewitt2010).
Previous studies discussed the sedimentology and main geomorphic features of Marambaia Barrier Island (Borges, Reference Borges1998; Borges and Nittrouer, Reference Borges and Nittrouer2016), but none investigated its stratigraphic architecture. Thus, the main objective of this work is to map and describe the depositional subenvironments of this barrier island system and contribute to the understanding of its age and geological evolution by integrating the combined analysis of seismic and GPR data sets, geochronology, and mapping of sedimentary environments based on satellite imagery and field work.
STUDY AREA
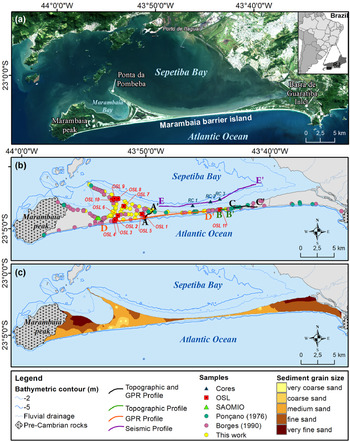
Marambaia Barrier Island stretches along the southern coastline of Rio de Janeiro State (SE Brazil; Fig. 1a), partially isolating Sepetiba Bay from the Atlantic Ocean. It lies between Marambaia Peak, a pre-Cambrian bedrock hill (Supplementary Figure 1), to the west and Barra de Guaratiba Inlet to the east (Fig. 1). Along its 40 km, the barrier island width varies between 5 km and ~130 m at its central sector, which appears to be at conditions of imminent rupture (Fig. 1)—an impression reinforced by occurrences of overwash and erosional processes observed on the back-barrier shoreline (Muehe et al., Reference Muehe, Lins-de-Barros, Bulhões, Klumb-Oliveira, Pinto, Sperle and Muehe2018).
(a) Study area; (b) location of sediment samples and topographic and geophysical profiles; (c) mean grain size distribution obtained from the integration of new data (this study) and a compilation from Ponçano (Reference Ponçano1976) and Borges (Reference Borges1990). Universal Transverse Mercator Projection (horizontal datum: WGS 84, reference zone: 23). Image Landsat 8 from 12/May/2018, composition 4R3G2B. OSL = sediment cores submitted for Optically Stimulated Luminescence; RJ = Rio de Janeiro state; SAOMIO = sand agglomerated by organic material and iron oxides.

Sepetiba Bay is a microtidal environment, with combined semidiurnal (2[M2+S2]) and diurnal (1.5[O1+K1]) mean spring tidal range exceeding 141 cm (Kjerfve et al., Reference Kjerfve, Dias, Filippo and Geraldes2021). In the western channel, which is the main navigational channel connecting Itaguaí Port to the open ocean, there is strong tidal asymmetry with flood tides being shorter than ebb tides, and spring tidal currents reaching speeds of up to 1.64 m/s at ~2 m above the bottom (Fonseca, Reference Fonseca2013).
The barrier island shoreline facing the Atlantic Ocean is a wave-dominated environment. Based on a time series extracted from the WaveWatch III (WW3) model spanning the 1986–2018 period, Carvalho et al. (Reference Carvalho, Dalbosco and Guerra2020) characterized the wave climate of the southern Rio de Janeiro continental shelf as being dominated by SE/E fair-weather waves (period <8 s, height <2 m) and mostly SSW storm waves (height >2 m and period >8 s).
According to the Köppen classification, there are two types of climate in Rio de Janeiro state (RJ in Fig 1A): tropical without a dry season (Af) and tropical monsoon (Am) (Alvares et al., Reference Alvares, Stape, Sentelhas, Gonçalves and Sparovek2013). Average annual rainfall lies between 1300–1600 mm, occasionally exceeding 2000 mm. In the study area, weak winds from the north are the most frequent, whereas those from the east and southwest are the most intense and are associated with, respectively, the austral summer and the austral winter (Carvalho et al., Reference Carvalho, Dalbosco and Guerra2020), when frontal systems cause increased cloudiness and strong winds (Dereczynski and Menezes, Reference Dereczynski, Menezes, Martins and Grossmann-Matheson2015).
Previous studies of surficial sediment distribution along Marambaia Barrier Island, presented by Ponçano (Reference Ponçano1976) and Borges (Reference Borges1990), and revisited by Carvalho and Guerra (Reference Carvalho and Guerra2020), show the predominance of moderately well-sorted medium sands (Fig. 1c).
Previous Marambaia Barrier Island evolutionary models
Conceptual models of Marambaia Barrier Island evolution were presented by Lamego (Reference Lamego1945) and Ponçano et al. (Reference Ponçano, Fulfaro and Gimenez1979). However, they were not well-grounded on datasets that explained either the origin of the sediment supply or the proposed growth direction of the barrier island and the temporal sequence of the geomorphic features. In the earliest model, Lamego (Reference Lamego1945) describes a sandy spit formed by fluvial sediments formed from west to east. After the bay closure, reworking of the back-barrier shoreline by the internal wind-driven circulation then built the Ponta da Pombeba spit.
Ponçano et al. (Reference Ponçano, Fulfaro and Gimenez1979) described the formation of two spits that migrated from the eastern and western extremities towards the central sector. During the ensuing sea level fall, aeolian processes allowed lateral and vertical growth of the barrier by dune development in the eastern sector and sand banks in the western sector, near Marambaia Peak, with the formation of elongated bars that enclosed small water bodies. During sea level rise, sediments were reworked and the central sector was opened. During a second interval of lower sea level (present time), the western and eastern spits were reunited, closing the lagoon. This event modified circulation inside the bay and provided the conditions for formation of the tidal inlet, named Barra de Guaratiba Inlet.
Regional Sequence Stratigraphy
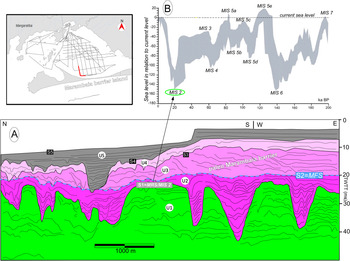
More recent work, based on seismic data analyses within Sepetiba Bay and nearby inner shelf (Friederichs et al., Reference Friederichs, Reis, Silva, Toulemonde, Maia and Guerra2013; Reis et al., Reference Reis, Amendola, Dadalto, Silva, Tardin, Guerra, Martins, Cardia, Gorini and Rabineau2020), led to the identification of five shallow-seismic sequences based on their bounding surfaces and on their respective internal architectural elements (units U1 to U5 and surfaces S1 to S5; Fig. 2). This seismic stratigraphic framework revealed two surfaces of stratigraphic significance: S1 and S2. S1 is an erosional surface correlated to a regional horizon dated at 19,880 cal yr BP in the Rio de Janeiro outer shelf region (Surface S5 of Tardin et al., Reference Tardin, Reis and Silva2016), which was identified as a maximum regression surface (MRS), representing the last subaerial exposure of the continental shelf in the Rio de Janeiro area, developed at marine isotope stage MIS2 (Reis et al., Reference Reis, Amendola, Dadalto, Silva, Tardin, Guerra, Martins, Cardia, Gorini and Rabineau2020). Sequences U2 to U5 were thus interpreted as a transgressive and highstand sedimentary succession (up to 30 m thick; Friederichs et al., Reference Friederichs, Reis, Silva, Toulemonde, Maia and Guerra2013) composed of units that testify to the onset and evolution of estuarine conditions in the Sepetiba Bay area (Reis et al., Reference Reis, Amendola, Dadalto, Silva, Tardin, Guerra, Martins, Cardia, Gorini and Rabineau2020): from an open-ocean estuarine system progressively evolving into more isolated estuarine conditions, Units U2 through U5, respectively, in Figure 2. S2 is a relatively flat surface regionally, which is interpreted as the maximum flooding surface (MFS, in the sense of Catuneanu, Reference Catuneanu2006) over which U3 developed as a prograding paleo barrier (Fig. 2), thus defining the upper limit of the transgressive system tract in the region.
(A) Seismic line in Sepetiba Bay illustrating the stratigraphic framework of seismic units U1–U5 and their bounding surfaces S1–S4 (modified from Reis el al., Reference Reis, Amendola, Dadalto, Silva, Tardin, Guerra, Martins, Cardia, Gorini and Rabineau2020). (B) Envelope of δ18O-derived global sea-level variations compiled by Rabineau et al. (Reference Rabineau, Berné, Aslanian, Olivet, Joseph, Guillocheau, Bourillet, Ledrezen and Granjeon2006). MIS = Marine Isotope Stage; MFS = maximum flooding surface; MRS = maximum regressive surface. The seismic line location is shown in the upper left corner (1:500000 approximated scale).

MATERIALS AND METHODS
The architectural and morpho-sedimentary analyses of Marambaia Barrier Island were carried out by integrating high-resolution satellite imagery (provided by Google Earth Pro© and ArcMapTM10.5), seismic records, and GPR radargrams, as well as topographic and sedimentological/geochronological data sets (Fig. 1b).
Satellite imagery analysis
The high-resolution Digital Globe images (in general with spatial resolution of 50 cm in the panchromatic band), available in Google Earth Pro© and ArcMapTM10.5, span several years, including different tidal and meteorological (dry and wet) conditions. Mosaic imageries from WorldView-2 of 02/Aug/2012 and WorldView-3 of 07/May/2016 were used to map the morpho-sedimentary domains of Marambaia Barrier Island, through their visual analysis and manual determination of the vectors corresponding to each domain. Vectors generated in the Google Earth Pro© program were recorded in .kml format (program default), imported to ArcGISTM 10.5, and then converted into shapefile format (.shp). Whenever it was possible, the morpho-sedimentary domains were visited during fieldwork campaigns, although access to some areas was not granted due to the presence of military facilities.
Seismic and GPR surveys and data processing
Seismic data were acquired using a single channel boomer seismic system model AA301, 50–100 joules, and 0.5–5 kHz (Applied Acoustics Engineering). Subsurface profiling with GPR along trails of Marambaia Barrier Island was performed using a Geophysical Survey Systems Incorporated (GSSI) SIR3000 model with a 200 MHz antenna in June 2015 and November 2016. Seismic and GPR data were processed, respectively, in a CODA 500 system and GSSI software Radar Data Analyzer (RADAN) version 7.4. The geophysical interpretation followed the basic principles of seismic stratigraphy and high-resolution sequence stratigraphy (synthesized in Catuneanu, Reference Catuneanu2002, Reference Catuneanu2006). For the radargrams, the descriptions and classifications proposed by van Heteren et al. (Reference van Heteren, Fitzgerald, McKinlay and Buynevich1998) and Neal (Reference Neal2004) were also used.
The central assumption of the sequence stratigraphic models is that the predictable stacking pattern of deposits and stratigraphic surfaces is controlled mainly by the interplay of sea level changes and sedimentation at the shoreline. This interplay controls the direction of shoreline shifts, as well as the timing of all systems tract and sequence boundaries (Catuneanu, Reference Catuneanu2002). Thus, the identification of geophysical facies and stratigraphic surfaces (seismic and radar) supports the interpretation of depositional environments, their relationship with sea-level curves, and, therefore, the environmental evolution model.
Transgressions and regressions are trends of shoreline shifts and may be defined as functions of the ratio between the rates of sea-level change and the rates of sedimentation at the shoreline (Catuneanu, Reference Catuneanu2002). Transgressions occur when creation of accommodation space (i.e., rates of sea-level rise) outpaces sedimentation rates. This results in a landward migration of the shoreline reflected through retrogradation of facies. The scour surface cut by waves during the transgression can either be onlapped by retrograding shoreface deposits when sea-level rise outpaces sedimentation rates, or it can be downlapped by normal progradation clinoforms (normal regression) when sedimentation rates outpace the rise of sea level at the shoreline (Catuneanu, Reference Catuneanu2002). Forced regressions occur during sea-level fall when the shoreline is forced to recede by the falling sea level, irrespective of sediment supply. As a result, the depositional environments will shift seaward and the deposits previously formed in nonmarine and shallow marine environments may be subjected to subaerial erosion (e.g., by fluvial incision, wind degradation) and wave scour as the shoreface also migrates seaward. Fluvial incision is accompanied by the progradation of offlapping shoreface deposits (Catuneanu, Reference Catuneanu2002). Finally, normal regressions can also occur in the late stages of sea-level rise when sedimentation rates outpace low rates of sea-level rise at the shoreline. In this case, the newly created accommodation space is entirely filled with sediment, aggradation is accompanied by sediment bypass, and progradation of facies occurs. Therefore, transgressions and normal regression may occur during sea-level rise depending how quickly accommodation space is created and filled (Catuneanu, Reference Catuneanu2002).
In the present work, the sea-level curves of Milne et al. (Reference Milne, Long and Bassett2005) and Angulo et al. (Reference Angulo, Lessa and Souza2006) were used to interpret the stratigraphic architecture of Marambaia Barrier Island. While the first represents sea-level elevation along the eastern sector of the Brazilian coast since ca. 8 ka, the latter depicts the sea-level variability along the same coastal stretch since ca. 6.5 ka. The curve of Milne et al. (Reference Milne, Long and Bassett2005) for the Rio de Janeiro coastline shows a rising sea level at approximately −2 m at ca. 8 ka, followed by a time gap of ca. 3500 yr and, from 4 ka on, a falling sea level from ~3 m to its present level. Milne et al. (Reference Milne, Long and Bassett2005) pointed out that sea level rose at a fast pace (~7–8 mm/yr) in the early Holocene, and then slowed down ca. 7 ka due to a decrease in the rate of ice melt. The sea-level curve proposed by Angulo et al. (Reference Angulo, Lessa and Souza2006) shows that sea level reached 3.0 ± 1.5 m ca. 5.8 ka, and then fell at a rate of ~0.7 m/ka towards its present level.
Because there are no measured or estimated sea-level curves available for the present study area covering the last transgression before ca. 7 ka, and considering that it lies in a far-field tropical region away from late Pleistocene ice masses and related zones of glacio-isostatic effects, a series of relatively precise global sea-level curves (compiled by Reis et al., Reference Reis, Maia, Silva, Rabineau, Guerra, Gorini and Ayres2013, after Rabineau et al., Reference Rabineau, Berné, Aslanian, Olivet, Joseph, Guillocheau, Bourillet, Ledrezen and Granjeon2006) encompassing the latest Pleistocene–Holocene transgression since ca. 20 ka was utilized. These compiled sea-level curves have been established (1) based on analyses of deep-sea foraminifera δ18O isotope records, calibrated by direct measurements of sea-level position extracted from geological evidence (shoreline position) or using corals (see references in Rabineau et al., Reference Rabineau, Berné, Aslanian, Olivet, Joseph, Guillocheau, Bourillet, Ledrezen and Granjeon2006); or (2) using stratigraphic models (e.g., Skene et al., Reference Skene, Piper, Aksu and Syvitski1998) and a hydraulic model of water exchange (Siddall et al., Reference Siddall, Rohling, Almogi-Labin, Hemleben, Meischner, Schmelzer and Smeed2003, as synthesized by Rabineau et al., Reference Rabineau, Berné, Aslanian, Olivet, Joseph, Guillocheau, Bourillet, Ledrezen and Granjeon2006). All these curves reveal a marked deceleration in sea-level rise from ca. 10–8 ka BP onwards (Reis et al., Reference Reis, Maia, Silva, Rabineau, Guerra, Gorini and Ayres2013, fig. 10).
Topographic survey
Topographic surveys were also carried out in June 2015 and November 2016 using Novatel's Differential Global Positioning System (DGPS), model NOV702GG, with a radius of 0.1 m. The DGPS was positioned at an antenna fixed to a car or attached to a quadricycle (when access to the trails was more restricted). The adopted configuration allowed acquisition of positioning and altitude every second. Topographic data processing consisted of 5 steps: (1) correction of antenna height; (2) correction of positioning from the database of the Rio de Janeiro station of the Brazilian Network of Continuous Monitoring of Systems GNSS of the Brazilian Institute of Geography and Statistics (IBGE); (3) geoid height acquisition; (4) conversion of ellipsoidal altitude into orthometric altitude; and (5) removal of spurious data. Additionally, topographic data of continuous vectoral cartographic base for Rio de Janeiro state on 1:25,000 scale, obtained in the web portal of IBGE (<ftp://geoftp.ibge.gov.br/cartas_e_mapas/bases_cartograficas_continuas/bc25/rj/>), were used to construct a Digital Elevation Model (DEM). The DEM was enhanced with the Spatial Analyst toolbar of ArcGISTM10.5, using a regular grid interpolation, Topo to Raster (Hutchinson and Gallant, Reference Hutchinson, Gallant, Wilson and Gallant2000), with spatial resolution of 25 m.
Sedimentological and geochronological analysis
The sedimentological study consisted of the analysis of 69 samples of surficial sediments obtained in April and September 2013 and March 2015, three short cores collected in Sepetiba Bay at water depths between 3.7–3.9 m (location in Fig. 1b), and 11 short percussion cores (~1 m long) collected in March 2015 in the barrier island.
A geophysical survey by Multi-Sensor Core Logger (Geotek) and digital X-ray radiography (Yxlon) were carried out on the three cores collected in Sepetiba Bay. Then, the cores were opened, photographed, visually described, and subsampled every 2 cm. Datable material was collected for radiocarbon dating, washed with distilled water, dried, photographed, and properly stored for dating procedures.
Shell fragments from cores collected in Sepetiba Bay (RC1 to RC3; Fig. 1b) were dated by radiocarbon methods. The analyses were performed by the National Ocean Sciences Accelerator Mass Spectrometry/Woods Hole Oceanographic Institution (NOSAMS/WHOI) through the Accelerator Mass Spectrometry (AMS) method associated with a gas ion source (ion gas). This method is relatively quick and inexpensive, with analytical precision better than 2% (Roberts et al., Reference Roberts, Steven, Beaupré and Burton2013). Radiocarbon age calibration was performed using the SHCal database (Hogg et al., Reference Hogg, Hua, Blackwell, Niu, Buck, Guilderson and Heaton2013), suitable for the Southern Hemisphere, through the freely available software CALIB (version 7.1; Stuiver and Reimer, Reference Stuiver and Reimer1993; Stuiver et al., Reference Stuiver, Reimer and Reimer2016).
Because shell fragments or other material suitable for radiocarbon dating are absent in the emerged barrier, the optically stimulated luminescence (OSL) dating method was applied to samples from the center of each short percussion core collected in the western and central sector of the barrier island (OSL 1 to OSL 11; Fig. 1). Sampling was performed without exposure to light, as indicated by Preusser et al. (Reference Preusser, Degering, Fuchs, Hilgers, Kadereit, Klasen, Krbetschek, Richter and Spencer2008), using vertically inserted aluminum tubes ~1 m long. Each tube was surrounded by a metal clamp that was forced by percussion into the sediment. A ratchet tripod was used to remove the tube. Local altitude ranged from −0.3 to 5.5 m. OSL dating was performed by the company Datação Ltda. using the single-aliquot regenerative-dose (SAR) protocol, which was proposed by Murray and Wintle (Reference Murray and Wintle2000) and revised by Wintle and Murray (Reference Wintle and Murray2006).
Subsamples from the cores collected in Sepetiba Bay, from the middle section of the short percussion cores as well as the 69 surficial sediment samples collected for this study, were submitted to particle size analysis according to Krumbein and Pettijohn (Reference Krumbein and Pettijohn1938). The coarse fractions (>0.062 mm) of the surficial and of the short percussion core samples were dried and then sieved at 0.5 Φ intervals, while the fine fractions (<0.062 mm) were wet sieved and had the silt and clay fractions determined by a laser diffraction particle analyzer (MalvernTM Mastersizer). The sandy samples from the underwater cores had their grain size distribution determined by a dynamic image analyzer (CamsizerTM), while the muddy samples were also analyzed by the laser diffraction particle analyzer. The statistical parameters of all sediment samples were obtained through GRADISTAT software (version 8.0) (Blott and Pye, Reference Blott and Pye2001), based on the Folk and Ward (Reference Folk and Ward1957) method.
Additionally, results from previous studies were used to improve the map of the sedimentary coverage of Marambaia Barrier Island, by using the Inverse Distance Weighted (IDW) method (Wei and McGuinness, Reference Wei and McGuinness1973): 21 samples from Ponçano (Reference Ponçano1976) and 74 from Borges (Reference Borges1990).
Bathymetric data
The bathymetric data were obtained from nautical chart number 1620, provided by the Hydrographic Center (CHM) of the Brazilian Navy and compiled by the GEOMARGEM research group.
RESULTS
Morpho-sedimentary domains based on satellite imagery and field observations
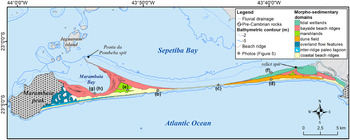
The integrated analysis of satellite images and field observations led to identification of seven main morpho-sedimentary domains: (1) coastal beach ridges, (2) inter-ridge paleo lagoon, (3) overland flow features, (4) dune field, (5) marshlands, (6) bayside beach ridges, and (7) tidal wetlands (Fig. 3). The classification of these morpho-sedimentary domains was established based on surface aspects of the depositional subenvironments, coupled with geophysical interpretation of stratigraphic architecture of subsurface deposits. This approach was decisive for the recognition and interpretation of how each subenvironment contributed to the evolution of Marambaia Barrier Island.
Morpho-sedimentary domains of Marambaia Barrier Island; (b)–(h) refer to photos in Figure 5.

Coastal beach ridges domain
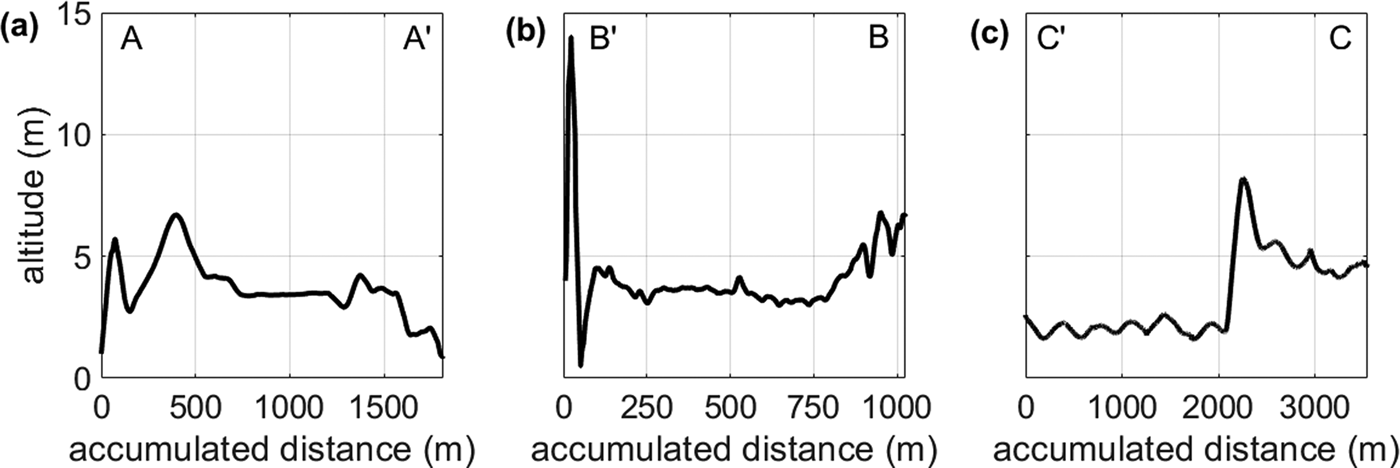
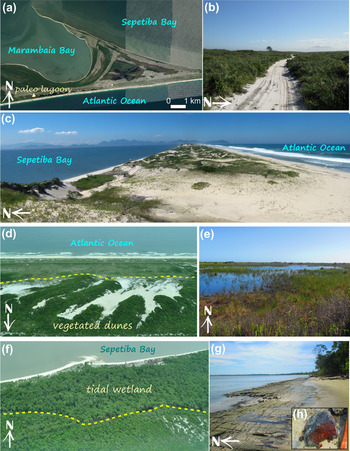
The coastal beach ridges domain represents 26% of the area of the barrier island, continuously extending from the Barra de Guaratiba Inlet to Marambaia Peak (Fig. 3). The topography exhibits distinct characteristics (Figs. 4, 5a). In the western sector, it is composed of two parallel sand ridges ~6 m high, separated by a segmented paleo lagoon (Fig. 4a) that narrows eastwards until disappearing (Fig. 4a). In the central sector, the sandy barrier is narrow (~100 m), ~4–5 m high (Fig. 4b), forming an erosional escarpment along the back-barrier shoreline. In this sector, there is an erosional feature that cuts through the barrier (Fig. 4b) where sporadic events of overwash occur (Fig. 5c). The formation of a small washover fan in the back-barrier area is visible in satellite images (e.g., in the DigitalGlobe image from July 14, 2006; Google Earth, 2020). In the eastern sector, this domain is formed by a single ridge and covered by a dune field along most of its extension (Fig. 5d).
Topographic profiles: (a) section A-A’; (b) section B-B’; (c) section C-C’. Locations of sections shown in Figure 1b.

Photos and satellite imagery of the mapped morpho-sedimentary domains: (a) satellite imagery of the western sector of the barrier island (WorldView 3 image from April 20, 2018); (b) trail used during the topographic survey in the western sector of the coastal beach ridges domain (18/Jun/2015); (c) view of an overwash channel from the top of an ~12 m high dune (taken April 16, 2013); (d) aerial photograph (12/Mar/2015) of vegetated dunes in the dune field domain (dashed line marks the boundary between dune field and coastal beach ridges domains); (e) view of the flooded area in the marshlands domain (03/Mar/2015); (f) aerial photograph (March 12, 2015) of the tidal wetlands domain, where the dashed line marks the boundary between the dune field and the tidal wetlands domains; (g, h) general view and detail of the sand agglomerated by organic material and iron oxides that is subaerially exposed along Marambaia Bay shoreline during springtide low water. Locations shown in Figure 3. In the eastern sector of the barrier island, there is a narrow beach ridge (~40 m wide) (Fig. 5f) that cannot be represented on the map scale (Fig. 3).

Inter-ridge paleo lagoon domain
Representing only 2% of the total barrier island area, a paleo lagoon with cuspate features occurs in the western sector between the double sand ridges (Figs. 3, 5a). It stretches ~17 km, extending from the region close to Marambaia Peak to the bayside beach ridges domain, where it becomes quite narrow and can no longer be seen in the images (Fig. 3). The elevation within the paleo lagoon is ~2 m and its maximum width is ~190 m. Rainfall controls the water-table level and the inter-ridge lagoon is filled after episodes of heavy rainfall (as shown in Fig. 5a).
Overland flow features domain
Representing ~9% of the total barrier area, this domain is restricted to the flat areas adjacent to the slopes of Marambaia Peak, where slopes reach values as high as 20° (Fig. 3; Supplementary Fig. 1). This domain exhibits features located in areas ~4–7 m high that are surrounded by unchanneled flow paths, possibly formed by runoff processes (Supplementary Fig. 1) that carry sediments from the Marambaia Peak area towards the ocean and/or Marambaia Bay during torrential rains that typically occur in this area, particularly during the summer (Fig. 3).
Dune field domain
The dune field domain corresponds to ~11% of the total barrier area and is restricted to the eastern sector of the barrier island (Fig.3) where it occurs overlying the coastal beach ridges domain (Fig. 5d). To the north, tidal wetlands and bayside beach ridges domain border the dune field, whereas to the west, it extends up to the beginning of the central sector, which is marked by the narrowing of the barrier island. In general, the dunes exhibit a SW-NE orientation, being largely well vegetated and ~24 m high.
Marshlands domain
This morpho-sedimentary domain comprises areas with elevations <4 m, adding up to 5% of the barrier island's area (Fig. 3). It is found in the central area of cuspate spits observed on the eastern (relict spit) and western (Ponta da Pombeba) sectors (Fig. 5e). The amount of water present in this domain is highly variable because of its dependence on the rainfall regime. As an illustration, the photographic record shown in Figure 4a and 4e was taken on April 20, 2018 after a rainfall event, when the central region of this domain and other low-altitude areas were flooded.
Bayside beach ridges domain
The bayside beach ridges domain exhibits deposits with successive ridge and swale topography coupled to the coastal beach ridges domain. It faces Sepetiba and Marambaia bays, where tides and winds exert a significant influence on the sedimentary processes (Figs. 3, 5b). It represents 35% of the total area of the barrier island, reaching a maximum elevation of ~4 m. The ridges occur in three different configurations: (1) part of a strandplain, close to Marambaia Peak; (2) forming two sets of beach ridges along the east and west borders of the cuspate spit where the Ponta da Pombeba flying spit arises; and (3) forming ridges that constitute an old cuspate spit on the eastern sector of the barrier (relict spit in Fig. 3), similar to the existing feature in the western sector. Beach ridges in the western sector are more numerous and well developed than those in the eastern sector; those forming the western cuspate spit were grouped into distinct sets of sandy deposits, delimited by alignments and truncations observed in the satellite images (see below).
Tidal wetlands domain
This domain is restricted to the eastern sector of the barrier island and represents ~14% of the total barrier's area. It is partially covered by mangroves that develop between the limits of the coastal beach ridges domain and Barra de Guaratiba Inlet (Fig. 3). It is an important sedimentary domain because it retains large amounts of sediment that reach the region through input from small fluvial creeks and tidal channels that transport sediments from neighboring watersheds as well as from Sepetiba Bay and the nearby coastal area (Fig. 5f). Its elevation is ~2 m.
Architectural elements based on GPR radargrams and seismic analyses
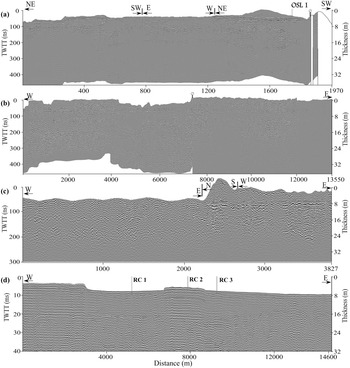
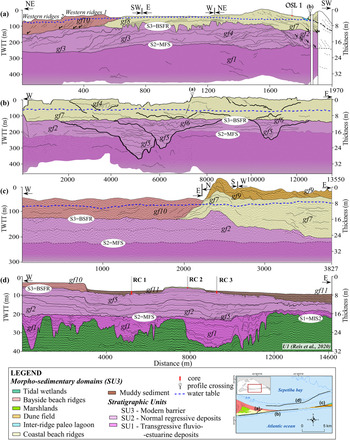
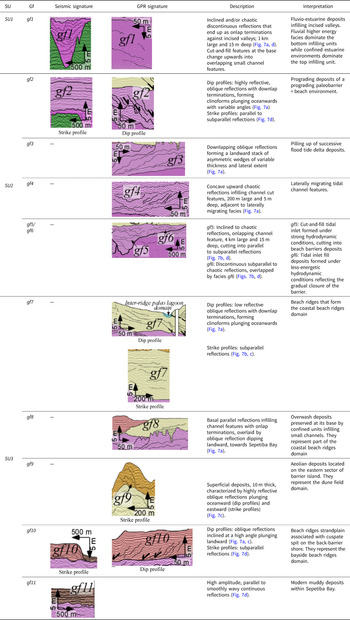
Geophysical data (seismic+GPR) allowed the visualization of 3 stratigraphic units (SU) and 11 geophysical facies (seismic and radar facies gf; Table 1) displayed in Figure 6 (profiles without interpretation) and Figure 7 (interpreted profiles). Due to access restrictions in several areas because of the presence of military facilities and training camps, only a few domains of Marambaia Barrier were visited during the GPR surveys, namely: the coastal beach ridges domain; the inter-ridge paleo lagoon domain; the dune field domain; and the bayside beach ridges domain (Figs. 1, 3).
Geophysical profiles without interpretation located in Marambaia Barrier (a–c) and Sepetiba Bay (d). RC1–RC3 indicate core locations.

Geophysical profiles located in Marambaia Barrier (a–c) and Sepetiba Bay (d); note change in vertical scale in (d) compared with (a–c). Note the spatial distribution of morpho-sedimentary domains, geophysical facies (gf1–gf11), and stratigraphic units (S1–S3). BSFR = basal surface of forced regression; MFS = maximum flooding surface; MIS = Marine Isotope Stage; RC1–RC3 indicate core locations; U1 = seismic unit of Reis et al. (Reference Reis, Amendola, Dadalto, Silva, Tardin, Guerra, Martins, Cardia, Gorini and Rabineau2020); TWTT = two-way travel time. Small half-arrows in Figure 7a enhance reflection termination in downlap.

Description and interpretation of the geophysical facies (gf) identified in Marambaia Barrier Island and Sepetiba Bay. SU = Stratigraphic unit.

Stratigraphic unit SU1 is the basal unit identified in the geophysical data (seismic+GPR), and corresponds to Unit U2 of Reis et al. (Reference Reis, Amendola, Dadalto, Silva, Tardin, Guerra, Martins, Cardia, Gorini and Rabineau2020; Fig. 2). Unit SU1 is better imaged in seismic profiles and consists mainly of confined fluvio-estuarine sedimentary facies (geophysical facies gf1; Fig. 7a/d; Table 1) infilling incised valleys sculpted into surface S1. This unit is limited at the top by a flat surface characterized by a continuous high-amplitude reflection (surface S2 in Fig. 7).
The subsequent stratigraphic unit SU2 is characterized by a variety of geophysical facies (gf2 to gf6; Table 1) that form a sedimentary package deposited over surface S2, and corresponds to Units U3 and U4 of Reis et al. (Reference Reis, Amendola, Dadalto, Silva, Tardin, Guerra, Martins, Cardia, Gorini and Rabineau2020; Fig. 2). Geophysical facies gf2 to gf6 illustrate the development of beach ridges (facies gf2; Fig. 7; Table 1), cut at places by tidal channels or tidal inlets (Fig. 7b/d). It is organized as a depositional unit with maximum thickness of ~14 m, indicating the construction of paleo barriers, now buried under the modern Marambaia Barrier Island. The upper limit of this unit is represented by surface S3, which is an unconformable surface with numerous erosional channels ~30 m wide and 4 m deep (Fig. 7a).
The top stratigraphic unit SU3 is a sedimentary package up to 10 m thick, composed predominantly of oblique reflections inclined at a high angle along dip profiles, conformable along strike profiles (geophysical facies gf7; Fig. 7a), and deposited over erosional surface S3. Geophysical facies gf7 to gf10 reveal the subsurface geophysical expression of some of the depositional subenvironments of Marambaia Barrier described above (Figs. 1, 3), such as (Fig. 7; Table 1): the coastal beach ridges domain (facies gf7), the dune field domain (facies gf9), and the bayside beach ridges domain (facies gf10). Geophysical facies gf11 in its turn reflects the top muddy layer that presently covers most of the bottom of Sepetiba Bay (Fig. 7d).
Sedimentology
Surface sediment samples
Sediment samples were collected along the barrier island in most of the morpho-sedimentary domains defined through satellite imagery analysis (section 4.1), as follows: coastal beach ridges, bayside beach ridges, marshlands, inter-ridge paleo lagoon, and dune field. Coarse to medium sands (0.60–2.81 Φ) are predominant, being mostly very well sorted (0.24–0.81 Φ) (Figs. 1, 8) with quasi-symmetrical distribution (skewness ranged between −0.30 and 0.48 Φ).
Plot of sorting and mean grain size (Φ units) of sediment samples grouped by morpho-sedimentary domains. Samples analyzed for this work and from Ponçano (Reference Ponçano1976) were used in this plot. SB = Sepetiba Bay; MB = Marambaia Bay.

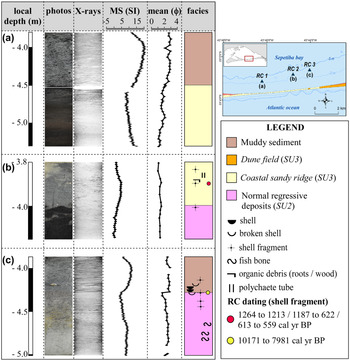
Sand agglomerated by organic material and iron oxides is exposed along the shore of Marambaia Bay (SAOMIO in Figs. 1b, 5g/h). This agglomerated sand is semi-consolidated and characterized by the presence of medium to coarse sand coated with humic acids that give the sample a reddish brown to light brown color, with 3% organic matter and 2% carbonates. Similar material was found in cores RC1 (below −4.6 m) and RC2 (below −4.0 m; Fig. 9).
Cores taken in Sepetiba Bay between ~2.5–4.5 m deep near the central sector of Marambaia Barrier Island. Core locations coincide with the seismic profile shown in Figure 7d. MS = magnetic susceptibility.

Sediment core samples
No shell fragments or other carbonate materials were found in core RC1, which is marked by the presence of two distinct sediment layers whose interface occurs around −4.5 m (RC1 in Fig. 9). Poorly sorted very fine sands with the presence of mud predominate in the upper −4.5 m where a few sedimentary structures are visible in the X-ray (in fact, these structures occur until −4.7 m; Fig. 9). The highest values of magnetic susceptibility (MS; 11–21 SI) were recorded in this upper layer. Below −4.5 m, poorly sorted medium sands are predominant, with no visible sedimentary structures in the X-ray. Below −4.5 m, sediments are coated by a greasy material with variable shades of brown to almost black (humic acids?). Magnetic susceptibility values start at 7 SI and increase downcore up to 16 SI (Fig. 9a).
Core RC2 is composed mainly of medium to coarse, well sorted to poorly sorted sands. Sorting varies from very well to poorly sorted up to −4.0 m, while MS values ranged between 0 and 2.4 SI. Below −4.0 m, moderately sorted medium sands are coated and hardened by a greasy brown material (humic acids?). The X-ray points to the absence of sedimentary structures throughout this core (Fig. 9b).
Core RC3 is characterized by the presence of two distinct layers. The upper layer, between the top (−3.9 m) and −4.3 m, is predominately poorly sorted very fine sands with the presence of mud. Sedimentary structures (parallel low-angle laminations) and shell fragments are visible in the X-ray images; magnetic susceptibility varied between 4–8.4 SI. The bottom layer, below −4.3 m, core RC3 is predominately a sandy mud mixture whose color varies from light to dark gray, with yellow/orange mottling between −4.4 and −4.7 m (Fig. 9c).
Radiocarbon and OSL dating
Radiocarbon dating indicated ages for two samples located in Sepetiba Bay. In RC2, dating of material from the submerged portion of the modern Marambaia Barrier Island (coastal beach ridges domain; stratigraphic unit SU3) resulted in the age of 1187–622 cal yr BP, with median value of 872 cal yr BP (shell fragment; Table 2; Fig. 9). This range is due to variations in the non-linear SHCal13 calibration curve where the intercept of radiocarbon age can lead to very different calibrated age ranges. In RC3, material associated to the geophysical facies gf3 (stratigraphic unit SU2) was dated at 10,171–7981 cal yr BP, with median value of 8984 cal yr BP (shell fragment; Table 2; Fig. 9).
Results of radiocarbon dating. BP = before present (= 1950); *2 sigma calibration (95% probability).

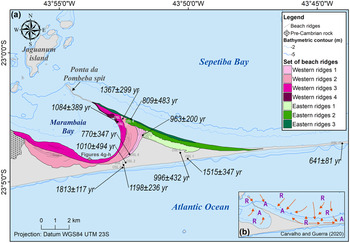
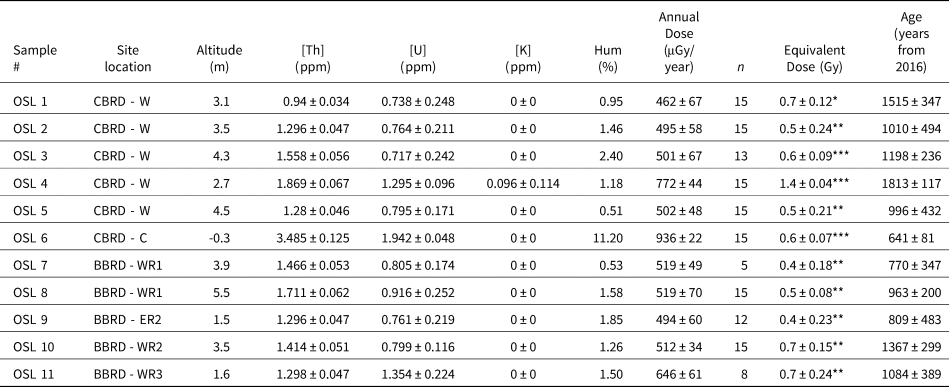
For emersed deposits from Marambaia Barrier Island, OSL dating indicated ages for the coastal beach ridges and the bayside beach ridges domains. The coastal beach ridge samples, OSL1 to OSL6, all located in the western sector of the study area, resulted in ages that varied between 641 ± 81 years at the central sector of the barrier island and 1813 ± 117 years at the western sector of the barrier island (Fig. 10; Table 3). For the bayside beach ridges domain (samples OSL7 to OSL11), ages ranged from 770 ± 347 to 1367 ± 299 years (Fig. 10; Table 3).
(a) Geochronology of beach ridge sets; (b) inset, showing modern sediment transport patterns near/at Marambaia Barrier Island inferred from grain-size trend analysis (Carvalho and Guerra, Reference Carvalho and Guerra2020). A = sediment accumulation area; R = sediment removal area.

Results of OSL dating: radioactive isotope concentrations (Th, U, K), humidity, annual dose, number of aliquots (n), equivalent dose, and final OSL ages. Statistical method for determination of equivalent dose: *modal value; **minimum value (indicates the minimum age of the dated sample); ***median value; # = sample number; Hum = humidity; CBRD = coastal beach ridges domain; BBRD = bayside beach ridges domain; WR = western ridges; ER = eastern ridges; C = central sector. Core locations shown in Figure 1.

DISCUSSION
Stratigraphic Meaning of Sequences SU1 to SU3
The geophysical record analyzed in the present work revealed that the current Marambaia Barrier Island was built on top of a previous barrier island formed in a complex geomorphological context that involves several sedimentological processes represented by units SU1 to SU3. As shown by Reis et al. (Reference Reis, Amendola, Dadalto, Silva, Tardin, Guerra, Martins, Cardia, Gorini and Rabineau2020), these units were developed over a continuous erosional surface (surface S1; Fig. 7) incised by a series of channels, which form a network of fluvial paleo-drainage buried under the sedimentary filling of Sepetiba Bay. Erosional surface S1 corresponds to a maximum regression surface (MRS), recognized at the scale of the Rio de Janeiro continental shelf (Reis et al., Reference Reis, Amendola, Dadalto, Silva, Tardin, Guerra, Martins, Cardia, Gorini and Rabineau2020), representing its last subaerial exposure, developed between marine isotope stages MIS5e–MIS2, and dated at 19,880 cal yr BP in the outer shelf region (Tardin et al., Reference Tardin, Reis and Silva2016).
Thus, stratigraphic unit SU1, placed above the MRS, can be interpreted as consistent with transgressive deposits composed of confined fluvio-estuarine deposits preserved as inner-valley transgressive units (i.e., an environment that changes from fluvial [continental] to estuarine at the top; Fig. 7). The flat surface capping SU1 corresponds to the maximum flooding surface (MFS) previously identified at the scale of Sepetiba Bay and the nearby continental shelf (Friederichs et al., Reference Friederichs, Reis, Silva, Toulemonde, Maia and Guerra2013; Reis et al., Reference Reis, Amendola, Dadalto, Silva, Tardin, Guerra, Martins, Cardia, Gorini and Rabineau2020; Fig. 2).
The following stratigraphic unit, SU2, was developed over the maximum flooding surface S2, beneath the present-day Marambaia Barrier Island. It consists of a deposit up to 14 m thick with the many subenvironments associated with a barrier depositional system, such as (Table 1): beach ridges (gf2), flood tidal deltas (gf3), tidal inlets (gf5, gf6), and tidal channels (gf4).
The diversity and great spatial variability of depositional environments of stratigraphic unit SU2 show that the Marambaia Barrier Island System is stratigraphically complex. In this context, the truncation surface at the base of gf2 (Fig. 7a) represents an erosional surface formed by beach and shoreface processes (similar to those described by Schwartz and Birkemeier, Reference Schwartz and Birkemeier2004) that separates open-ocean from restricted back-barrier environments that are dominated by estuarine processes. Regardless of this complexity, the geometry and internal architecture of stratigraphic unit SU2 (Fig 7) support its interpretation as being formed by normal regressive deposits that lie on top of the MFS—a prograding paleo-Marambaia Barrier (now buried) that was later eroded by processes that created surface S3 (Fig. 7). This interpretation was reinforced by 14C ages that place the development of stratigraphic unit SU2 ca. 10,171–7981 cal yr BP (Fig. 8c). Considering the sea-level curves used in this study, these ages allowed relation of SU2 deposition to a period of sea-level rise after the establishment of the MFS. This analysis suggests that normal regressive deposits (~8–10 m thick) formed a paleo barrier island, which limited the hydrodynamic circulation in the back-barrier area and, therefore, led to the configuration of a more isolated estuarine environment. The occurrence of normal regression is related chiefly to sediment input rates being higher than rates of creation of accommodation space (in this case, sea level rise; Catuneanu, Reference Catuneanu2002). The global sea-level curve proposed (e.g., Lambeck et al., Reference Lambeck, Rouby, Purcell, Sun and Sambridge2014), shows that sea level rose rapidly between ca. 11.4–8.2 ka and then decelerated between 8.2–6.7 ka, which is consistent with the final phase of North American deglaciation at ca. 7 ka. In addition, Milne et al. (Reference Milne, Long and Bassett2005) pointed out a relatively rapid and uniform sea-level rise of 7–8 mm/yr during the early Holocene, slowing down to ~0.5 mm/yr between 7–5 ka. Accordingly, it seems plausible to consider that, in the transition between the early to mid Holocene, decelerating rates of sea-level rise resulted in sedimentation rates relatively higher than those of sea-level rise.
Stratigraphic unit SU3 assembles the most recent deposits that comprise the present-day Marambaia Barrier Island (geophysical facies gf7 to gf11; Table 1). Although it was not possible to date every subenvironment, 14C ages place development of the coastal beach ridges domain between 1187–622 cal yr BP, thus after sea level reached its maximum of 3.0 ± 1.5 m along the Eastern Brazilian coast at ca. 5.8 ka (Angulo et al., Reference Angulo, Lessa and Souza2006). So, by integrating the mapped geophysical facies, the geophysical characteristic of basal surface S3, and 14C ages, stratigraphic unit SU3 was interpreted as forced regression prisms prograding over a basal surface of forced regression (S3/BSFR, in the sense of Catuneanu, Reference Catuneanu2006), which developed during the period of sea-level fall from 3.0 ± 1.5 m since ca. 5.8 ka. It is worth noting that in a setting where sea-level highstand possibly reached 3.0 ± 1.5 m above the current sea level, tidal range (mean spring tidal range of 1.41 m; Kjerfve et al., Reference Kjerfve, Dias, Filippo and Geraldes2021) matches the uncertainty of the proposed sea-level position (i.e., ±1.5 m). All the highstand elevations reported by Angulo et al. (Reference Angulo, Lessa and Souza2006, Reference Angulo, Giannini, Souza and Lessa2016) for the eastern Brazilian coast were obtained from vermetids, which are considered to be a reliable indicator of paleo-sea level positions. However, geological features related to beach environments at elevations above the current sea level are reported inland from Sepetiba Bay as, for instance, a set of beach ridges studied by Almeida et al. (Reference Almeida, da Rocha, Carelli and Plastino2010), located ~3–4 m higher than the present-day sea level. Such occurrences consistently attest to a falling sea level since ca. 5.8 ka, in line with the necessary conditions for developing forced regression deposits in a barrier island environment.
Considering the general stratigraphic framework discussed above, stratigraphic units SU1–SU3 can be regarded as sedimentary archives constructed under transgressive (unit SU1) and regressive (units SU2, SU3) conditions. In other words, both the paleo (SU2) and the modern (SU3) Marambaia barriers were built as regressive deposits. Similarly, in southern Brazil, Barboza et al. (Reference Barboza, Dillenburg, Rosa, Tomazelli and Hesp2009) reported the occurrence of a normal regressive configuration during the earlier stages of deposition of the Curumim and Pinheira barriers, that was followed by a forced regression stage (Dillenburg et al., Reference Dillenburg, Barboza, Hesp, Rosa, Angulo, Souza, Giannini and Sawakuchi2014). Lima and Parise (Reference Lima and Parise2020) also discussed the evolution of a Holocene coastal barrier in Itapeva Beach (southern Brazilian coast) where the development of a basal transgressive unit was followed by a normal regressive unit (beginning at 7205 ± 55 cal yr BP) and then by a forced regressive unit. Other studies on the evolution of coastal barriers along the Brazilian coast and elsewhere have demonstrated a regressive Holocene genesis (e.g., Lessa et al., Reference Lessa, Angulo, Giannini and Araújo2000; Dougherty et al., Reference Dougherty, FitzGerald and Buynevich2004; Caldas et al., Reference Caldas, Oliveira, Medeiros, Stattegger and Vital2006; Giannini et al., Reference Giannini, Guedes, Nascimento, Tanaka, Angulo, Assine, Souza, Dillenburg and Hesp2009; Timmons et al., Reference Timmons, Rodriguez, Mattheus and Dewitt2010; Guedes et al., Reference Guedes, Giannini, Sawakuchi, Dewitt, Nascimento, Aguiar and Rossi2011; Fornari et al., Reference Fornari, Giannini and Nascimento2012) and specifically with the occurrence of a normal regressive phase (Roy et al., Reference Roy, Zhuang, Birch, Cowell and Congxiang1997; Rodriguez et al., Reference Rodriguez, Anderson, Siringan and Taviani2004; Kinsela et al., Reference Kinsela, Daleya and Cowell2016).
Age model and sedimentary sources of the morpho-sedimentary domains of the modern Marambaia Barrier Island
The analysis of barrier morphology by integrating observations from field surveys, 14C/OSL ages, and satellite imagery, point out the following sequence over time for the identified morpho-sedimentary domains: coastal beach ridges, inter-ridge paleo lagoons, overland flow features, dune field, bayside beach ridges, marshlands, and tidal wetlands. Temporal overlap likely occurred (and it still occurs) associated with these domains. For instance, the two primary domains (coastal beach ridges, inter-ridge paleo lagoon) may have occurred at the same time, as well as the tidal wetlands and the western sector of the bayside beach ridges domain that represent the modern bay shore.
The coastal beach ridges domain was dated between 1813 ± 117 and 996 ± 432 years for samples from the western sector, while the bayside beach ridges domain was dated between 1367 ± 299 and 770 ± 347 years. Despite the large age errors, it is possible to confirm that the bayside beach ridges domain was formed after the establishment of the coastal beach ridges domain. The equivalent dose distribution is significantly over-dispersed with values <1 Gy (except sample OSL4), which suggests that counting statistics due to poor signal to noise ratio is the major reason for the large errors (Table 3).
Formation of the cuspate spits observed on the bayside beach ridges domain (Ponta da Pombeba and the relict spit; Fig. 3) seems to concur in accordance with the model presented by Zenkovitch (Reference Zenkovitch1959), which considers the influence of different incident wave directions on both sides of the spit. In addition, this model considers the formation of a half-moon shaped bay (presently Marambaia Bay), with erosion of the Marambaia Bay shore (exposing sand agglomerated by organic material and iron oxides; Fig. 5g/h) and transport and accumulation of the removed sand in the Ponta da Pombeba flying spit.
The spatial arrangement of the beach ridge sets suggests the occurrence of hydrodynamic and sedimentary processes that transported sediments along the back-barrier shoreline from the central sector towards its western and easternmost extremities forming, respectively, the Ponta da Pombeba and the relict spit (Fig. 3). Furthermore, the presence of several truncations observed in the western sector of the bayside beach ridge domain can explain some of the processes involved in the barrier evolution. These stratigraphic features represent substantial breaks in the geological record, interrupting three different sets of beach ridges, and are, therefore, morphological evidence of hydrodynamic events that resulted in erosion (truncations) and subsequent deposition (new sets of beach ridges). Some of these events typically take place in coastal depositional environments in response to storms that can cause barrier disruption and formation of new tidal inlets, or reactivation of a main circulation inlet between the coastal bay and the open ocean (Seminack and Buynevich, Reference Seminack and Buynevich2013). In such coastal settings, washover fans and flood tidal deltas might represent a significant source of sediment for barrier growth, as observed, for instance, by Buynevich et al. (Reference Buynevich, FitzGerald and van Heteren2004) and Fornari et al. (Reference Fornari, Giannini and Nascimento2012). Castelo et al. (Reference Castelo, Martins, Martínez-Colón, Guerra, Dadalto, Terroso and Soares2021) identified a sharp decrease in the feldspar/quartz ratio in sediments dated at ca. 6.5–6.3 ka, which was attributed to major changes in the configuration of Marambaia Barrier Island, leading to a less-confined bay, probably related to channels observed in stratigraphic unit SU2 (Fig. 7). Later on, as those channels were filled, the barrier was gradually closed; a process that was completed at its central sector ca. 641 ± 81 years ago (Table 3; Fig. 10).
Despite the large errors in OSL dating, the determined ages attested to recent formation of the coastal beach ridges domains and bayside beach ridges in the last 1813 ± 117 years. Associated with these ages, the morphological evidence, especially the spatial arrangement of beach ridge sets, substantiated the proposition of a conceptual model of their temporal development: (1) Eastern Ridges 1, the first to be formed, was subsequently truncated, giving way to the deposition of Western Ridges 1 (Fig. 10); maximum OSL ages are 1117 and 1163 years for, respectively, the western and eastern faces of the beach ridges (samples OSL7 and OSL8 dated, respectively, 770 ± 347 and 963 ± 200 years; Table 3; Fig. 10). (2) A second truncation marks the boundary between Western Ridges 1 and Eastern Ridges 2, dated at 809 ± 483 years (sample OSL 9 in Table 3; Fig. 10) and a third truncation is observed where Western Ridges 2, dated at 1367 ± 299 years (sample OSL 10 in Table 3; Fig. 10), is partially interrupted by Eastern Ridges 2. The spatial distribution of Western Ridges 2 suggests that it was formed when inlets that cut through Marambaia Barrier Island had been filled, establishing the necessary conditions for a vigorous transport of sediment along its shore, with the formation of a proto-Pombeba spit. Although no samples were dated around the relict spit observed in the eastern sector of the barrier (Fig. 3), its shape and location suggest that it was also formed around the time Western Ridges 2 was developed. This period seems to represent the transition from a partially open environment to a semi-closed bay where circulation and sediment transport are controlled by winds and tidal currents (see discussion below). (3) The last beach ridges (Eastern Ridge 3, Western Ridges 3, and Western Ridges 4) represent the most recent deposits, making up the current shoreline of Marambaia and Sepetiba Bays (Fig. 10). The distal areas of Eastern Ridge 3 and Western Ridges 4 fed longitudinal growth of the flying spit known as Ponta da Pombeba. Western Ridges 3, dated at 1084 ± 389 years (Table 3; Fig. 10), is currently being eroded, as documented by beach scarps and outcropping agglomerated sand (Fig. 5g).
Hydrodynamics seems to have played an important role on the barrier and back-barrier morphology. The influence of tidal inlets on the evolution of Marambaia Barrier Island is attested by the presence of large paleo inlets whose infilling pattern (geophysical facies gf5 and gf6; Fig. 7b) denote that they were progressively inactivated under relatively calm conditions, but subsequently vigorously re-excavated, forming new and active channels, always exhibiting lateral migration to the east (Fig. 7b). The filling pattern of the latter inlets indicates a change in the hydrodynamics of the environment. With a weakened cross-shore hydrodynamic regime sustained by the final closure of the barrier, Sepetiba Bay evolved from an open bay (before a fully developed barrier) to a semi-isolated estuary, creating the conditions for the formation of the tidal wetlands domain as part of back-barrier deposits observed in the eastern sector, a process of barrier evolution similar to that described by Duc and Tye (Reference Duc and Tye1987) in Kiawah Island, USA. During events of torrential rains, this area receives freshwater and sediments that are either carried to the nearby ocean through the Barra de Guaratiba Inlet or trapped in the back-barrier, where a series of vegetated (by mangrove forests) and unvegetated banks are formed and later welded to main barrier.
After final closure of the barrier, its morphology was sculpted by the bay internal hydrodynamics. This process is evinced by the morphology of the bayside beach ridges domain and by the presence of sand agglomerated by organic material and iron oxides (SAOMIO in Figs. 1b, 5g/h) and of humic compounds in SAOMIO and in RC1 and RC2 (Fig. 9). The SAOMIO is a hardened horizon (orstein) formed by pedogenetic process typical of podzol formation that can occur in barrier island environments (Embrapa, Reference Santos, Jacomine, Anjos, Oliveira, Oliveira, Coelho, Lumbreras and Cunha2006; Sauer et al., Reference Sauer, Sponagel, Sommer, Giani, Jahn and Stahr2007; Carvalho, Reference Carvalho2011; Martinez et al., Reference Martinez, Buurman, Lopes-Mazzetto, Giannini, Schellekens and Vidal-Torrado2018), the formation of which requires a subaerial exposure of the deposits (Embrapa, Reference Santos, Jacomine, Anjos, Oliveira, Oliveira, Coelho, Lumbreras and Cunha2006). The presence of humic compounds points to sedimentary development associated with a partial cover of vegetation (Neal and Roberts, Reference Neal and Roberts2001). Therefore, these sedimentary features (SAOMIO + humic compounds) strongly suggest that Marambaia Barrier Island was wider than at present and was subsequently eroded. Tidal currents and secondary wind-generated currents were possibly responsible for sand transport along the bayshore by reworking and redistributing older deposits of the barrier itself. Carvalho and Guerra (Reference Carvalho and Guerra2020) applied a grain-size trend model to surface sediments collected along the barrier's shoreline and nearby submersed area (<2 m depth) and identified an area of divergence of sediment transport that occurs both towards Ponta da Pombeba and eastwards (Fig. 9b). Thus, in the back-barrier environment, the barrier itself was the main source of sediment for new coastal features, similar to, for instance, observations by Rampino and Sanders (Reference Rampino and Sanders1980) and Switzer et al. (Reference Switzer, Bristow and Jones2006).
Castelo et al. (Reference Castelo, Martins, Martínez-Colón, Guerra, Dadalto, Terroso and Soares2021) considered that the main sediment sources for Marambaia Bay consisted of: (1) reworked mature lithics from nearby drainage basins and from nearby rock outcrops, probably from Marambaia Peak, between ca. 9.5–7.8 ka, still under subaerial conditions; (2) materials of coastal and fluvial origin, as the transgression slowed down towards its maximum elevation ca. 5.8 ka, leading to increasing concentrations of poorly sorted fine sands (distal sources represented by river-sediment plumes) and lower Sr/Ca ratios, coupled with increased values of carbonates and biogenic calcite from proximal sources (i.e. the shoreface); these conditions prevailed between ca. 7.8–1.2 ka, when Sepetiba Bay became progressively confined, favoring the retention of sediments.
The presence of inlets and washover deposits also had a significant role in Sepetiba Bay as: (1) sediment sources, because they allow/represent the entrance of marine sediments into the bay system, either through flood tidal delta deposits, similar to what was observed by Vila-Concejo et al. (Reference Vila-Concejo, Short, Hughes and Ranasinghe2007) in Port Stephens, Australia, and Fornari et al. (Reference Fornari, Giannini and Nascimento2012) on the southern coast of Brazil; or through washover deposits, as noted by Hennessy and Zarillo (Reference Hennessy and Zarillo1987) in Long Island, USA, Switzer et al. (Reference Switzer, Bristow and Jones2006) on the southeastern coast of Australia, and Hudock et al. (Reference Hudock, Flaig and Wood2014) at many study areas worldwide; (2) regulating agents of the bay hydrodynamics and, consequently, of the sedimentary processes occurring in the back-barrier area, as demonstrated, for instance, by Duc and Tye (Reference Duc and Tye1987) in Kiawah Island, USA, and Pinto et al. (Reference Pinto, Martins, Rodrigues, Nogueira, Laut and Pereira2016), in Sepetiba Bay, Brazil.
Holocene Evolution of Marambaia Barrier Island
Based on the discussion above, a four-fold Holocene evolution model of Marambaia Barrier Island can be proposed.
Phase 1
Phase 1 was established during the early stages of the Holocene transgression (before the peak of relative sea level at ca. 5.8 ka) and represents initial sediment deposition of the barrier island, first as early Holocene normal regressive deposits (deposited between 10171–7981 cal yr BP) developed over the maximum flooding surface (stratigraphic unit SU2; Fig. 7). These deposits led to development of a partially isolated estuarine environment where episodic events caused barrier ruptures and subsequent closures (Fig. 7b). The presence of both agglomerated sand cemented by organic material and iron oxides (Fig. 5g/h) and of sediments coated by a greasy material with variable shades of brown to almost black (humic acids?) (RC1 and RC2; Fig. 9) suggests that the barrier was wider than today and that all sectors were subjected to the same sedimentary processes.
Phase 2
Phase 2 occurred between the peak of relative sea level (ca. 5.8 ka) and ca. 1.2 ka when the coastal beach ridges domain was formed by coastal processes in which deposition and sediment supply were controlled by wave-driven flows. It was followed by development of the dune field domain, which was interrupted before onset of the bayside beach ridges domain; therefore, the dune field domain has ages between ca. 2–1.2 ka. Phase 2 represents a regressive period of the barrier development, when deposits of forced regression started being formed (stratigraphic unit SU3; Fig. 7).
Phase 3
Phase 3 occurred from 1.2–1 ka and marks the first stage of formation of the bayside beach ridges domain, during which cycles of deposition and episodic erosional events controlled the development of these geomorphological features. The main sedimentary processes seem to be controlled by bay circulation, which reworks and redistributes sands from the barrier and possibly from former tidal flood deltas. Truncations between sets of beach ridges mark this initial stage. The formation of the overland flow features domain also can be related to this period when overland flow processes provided sediments for the Marambaia Bay coastline, which were later reworked by the local dynamics. The paleogeographic setting of the barrier system is characterized by a semi-enclosed barrier influenced by storms and a lowering sea level.
Phase 4
Finally, Phase 4 was established since ca. 1 ka and is related to the latest stage of formation of the bayside beach ridges domain and development of the tidal wetland domain. Phase 4 is characterized by hydrodynamic conditions typical of a coastal bay whose communication with the open ocean is substantially restricted. Simultaneously, the internal tide- and wind-driven circulation was strengthened, reworking the coastal beach ridges domain to form the younger set of bayside beach ridges and the tidal wetlands domain, restricted to the eastern sector of the barrier island.
CONCLUSIONS
The present study, which integrates geophysical data (seismic lines + radargrams), 14C/OSL ages, observations from field surveys, and satellite imagery, revealed for the first time that Marambaia Barrier Island is a depositional system ~20 m thick, composed of a buried paleo barrier island developed in the early Holocene, on top of which sits the modern Marambaia Barrier Island.
Although developed during the Holocene transgression, the Marambaia Barrier Island depositional complex is formed basically by regressive deposits, initially formed under normal regression conditions (SU2 paleo barrier aged between 10171–7981 cal yr BP and 5.8 ka), and subsequently under forced regression conditions (younger SU3 barrier developed since ca. 5.8 ka). Barrier deposits are cut or intermingled with a variety of subenvironments or features, such as inactivated tidal channels and inlets and flood tidal delta and overwash deposits.
Sedimentary processes associated to evolution of Marambaia Barrier Island depositional complex also include reworking of former barrier deposits, aeolian transport, tidal currents, barrier rupture and tide- and wind-driven bay circulation, and wave-driven flows, in addition to pedogenetic processes. Truncated beach ridges observed on the western sector of Marambaia Barrier Island evince that its recent evolution is characterized by alternating cycles of erosion and deposition associated, respectively, with rupture events and closure of tidal channels.
Finally, the main findings of this work, concerning specially its stratigraphic architecture and records of paleo subenvironments, may contribute to the interpretation of similar coastal environments along the Brazilian coast and in comparable environments elsewhere, particularly in the Southern Hemisphere.
Supplementary Material
The supplementary material for this article can be found at https://doi.org/10.1017/qua.2021.43
Acknowledgments
Our thanks to the Centro de Avaliações do Exército (CAEx) and the Santa Cruz Air Base (BASC) of the Brazilian Air Force (FAB) for granting access to Marambaia Barrier Island. The authors are deeply indebted to Gustavo Vaz de Melo, Ricardo Tadeu Lopes (Nuclear Instrumentation Laboratory/UFRJ), Rodrigo Coutinho Abuchacra (FFP/UERJ), Guilherme Borges Fernandez (Department of Geography/UFF), Amilson Rodrigues, and the undergraduate and graduate students who assisted in fieldwork and data processing in the laboratory. We are grateful to the reviewers and QR editor for their suggestions and comments that contributed to improve this manuscript.
Financial Support
This study was funded by the Coordenação de Aperfeiçoamento de Pessoal de Nível Superior – Brasil (CAPES) – Finance Code 001, with doctoral scholarships to TPD and BCC and master's degree grant for BCC. Our thanks to the funding agencies CNPq (Grant 474359/2013-5 and Grant 311996/2015-9), and FAPERJ (Grant E-26/103.248/2011 and FAPERJ PENSA RIO Grant E-26/010.003024/2014).