


1. Introduction
Vatnajökull is a medium-sized ice cap (8100 km2) located near the North Atlantic Ocean close to the maritime southeastern coast of Iceland (Fig. 1). The ice cap extends 150 km from west to east and 100km from south to north (63˚55’–64˚50’ N, 15˚15’–18˚10’ W) with an elevation ranging from sea level up to 2000 m. For zero net balance the ablation zone is about 40% of the total glacier area, and the equilibrium-line altitude is 1100 m at the southern outlets and 1300 m in the northern part (Reference Björnsson, Pálsson, Guðmundsson and HaraldssonBjörnsson and others, 1998). The surroundings of the ice cap are comprised mainly of lava and outwash plains.
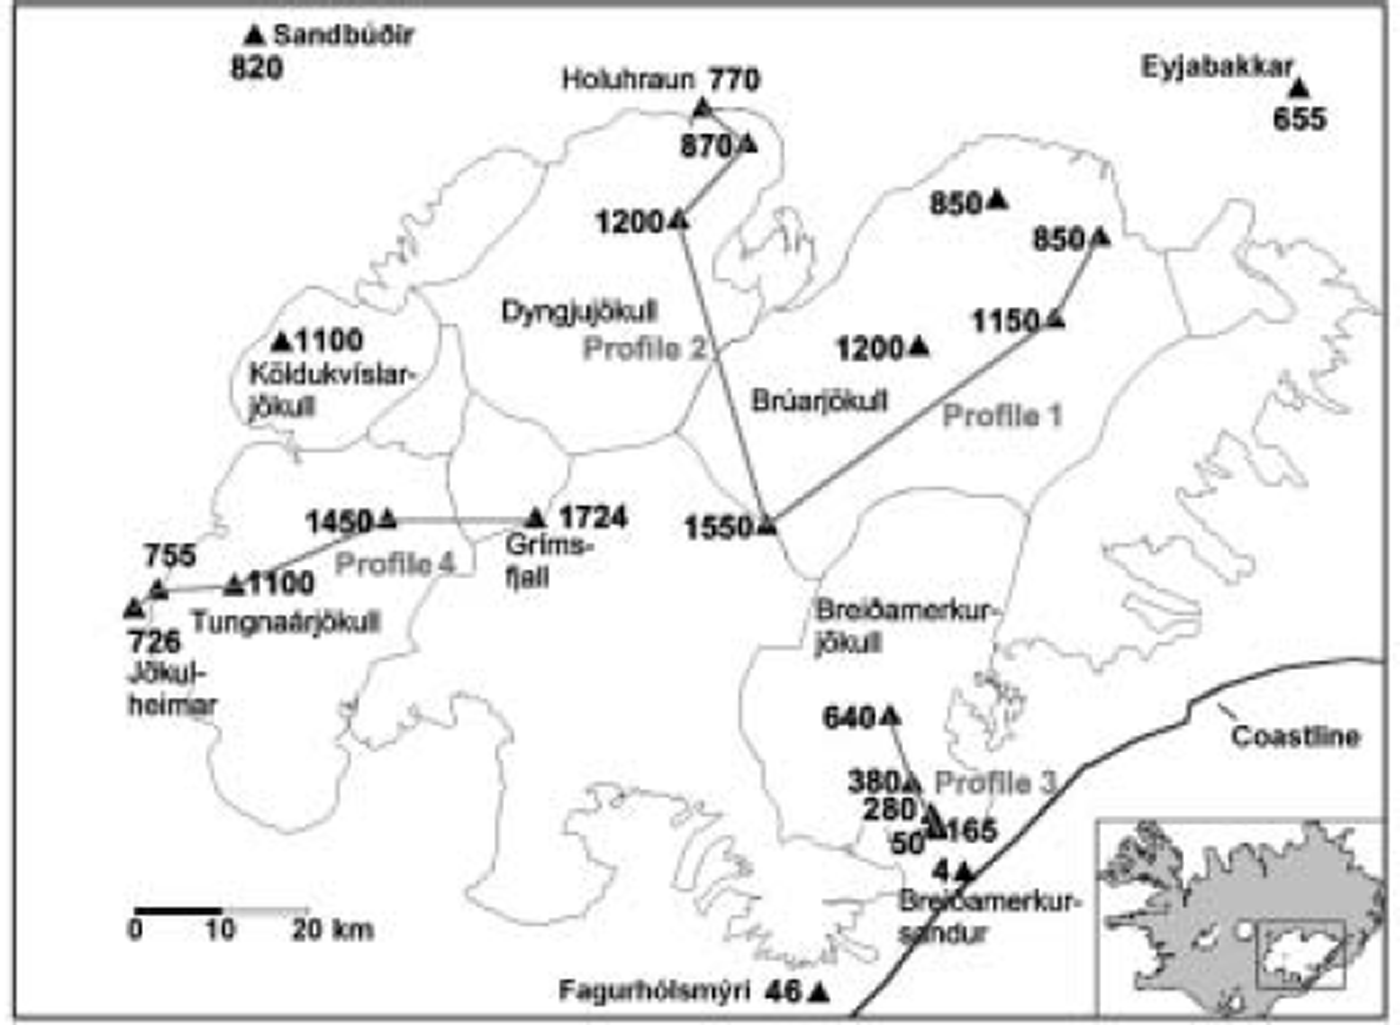
The sites of AWSs within and outside Vatnajökull. The temperature (TS) at Eyjabakkar at 655 m is related to the wind speed at Bruarjokull outlet, and at Sandbúðir at 820 m to the wind speed at Köldukvíslarjökull and Tungnaárjökull outlets.
Several meteorological experiments have been performed on medium- and small-sized glaciers with significant ablation zones like Vatnajökull (e.g. Reference Van den BroekeVan den Broeke, 1997; Reference Oerlemans, Holtslag and DuynkerkeOerlemans, 1998; Reference OerlemansOerlemans and others, 1999; Reference Oerlemans and GrisogonoOerlemans and Grisogono, 2001; Reference Parmhed, Oerlemans and GrisogonoParmhed and others, 2004). They have described the microclimate created during the summers that is characterized by a shallow downslope wind field, typically 10–50 m thick. A temperature deficit is created between the boundary layer over the melting glacier and the free atmosphere which generates negative buoyancy forces and gravity winds. Further, warm air may rise outside the margins of the glacier, producing a pressure gradient down-glacier.
In this paper, we describe the temperature and wind climate of Vatnajökull based on observations from 2–15 automatic weather stations (AWSs) during the summers of 1994–2003 (Fig. 1). These long-term observations allow us to derive an empirical relation between the glacier wind speed and the temperature observed at the lowland environs of the ice cap. This can be used for discussion of the impact of glacier winds in a warmer climate.
2. Meteorological Observations
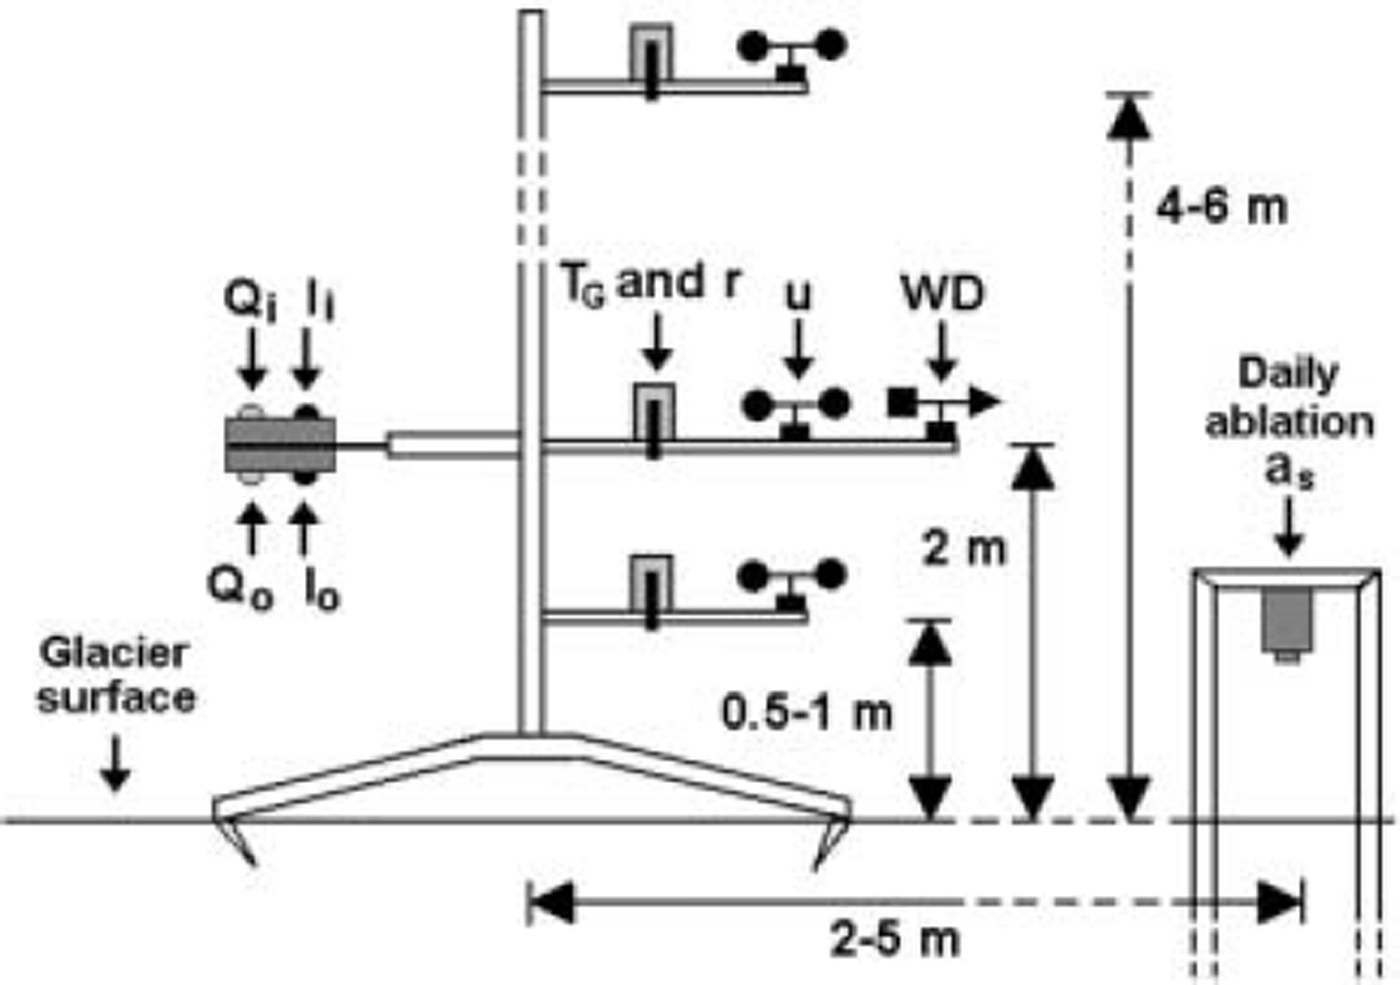
The AWSs on Vatnajökull were typically operated from early May to the beginning of September and sometimes to late September or early October. The AWSs on the ice cap (Fig. 2) measured the incoming and outgoing shortwave radiation (Q i, and Q o, respectively), incoming and outgoing longwave radiation (I i and I o, respectively) and wind direction (WD) at 2 m above the surface. Wind speed (u G), air temperature (T G) and relative humidity (r) were measured at one to four levels. Air pressure was recorded at only one to three stations on the glacier but several stations outside the glacier. The daily changes in surface height were measured directly by a sonic echo sounder (Fig. 2), and the observed snow density used to calculate the corresponding ablation rate (a s) in water equivalent. The ablation rate was also calculated directly from the energy components (Fig. 3). A description of the set-up, instrumentation and the calibration and accuracy of the meteorological observations is given by Reference OerlemansOerlemans and others (1999). The instruments were calibrated before the fieldwork each year. Air temperature (T S) was observed at several AWSs outside the ice cap (Fig. 1). In this paper, we use observations at 2 m above the glacier surface.
Schematic graph of an AWS. The instruments are mounted to a mast standing on the melting surface, and the sonic echo sounder on a mast drilled several meters into the glacier. Parameters are defined in section 2.
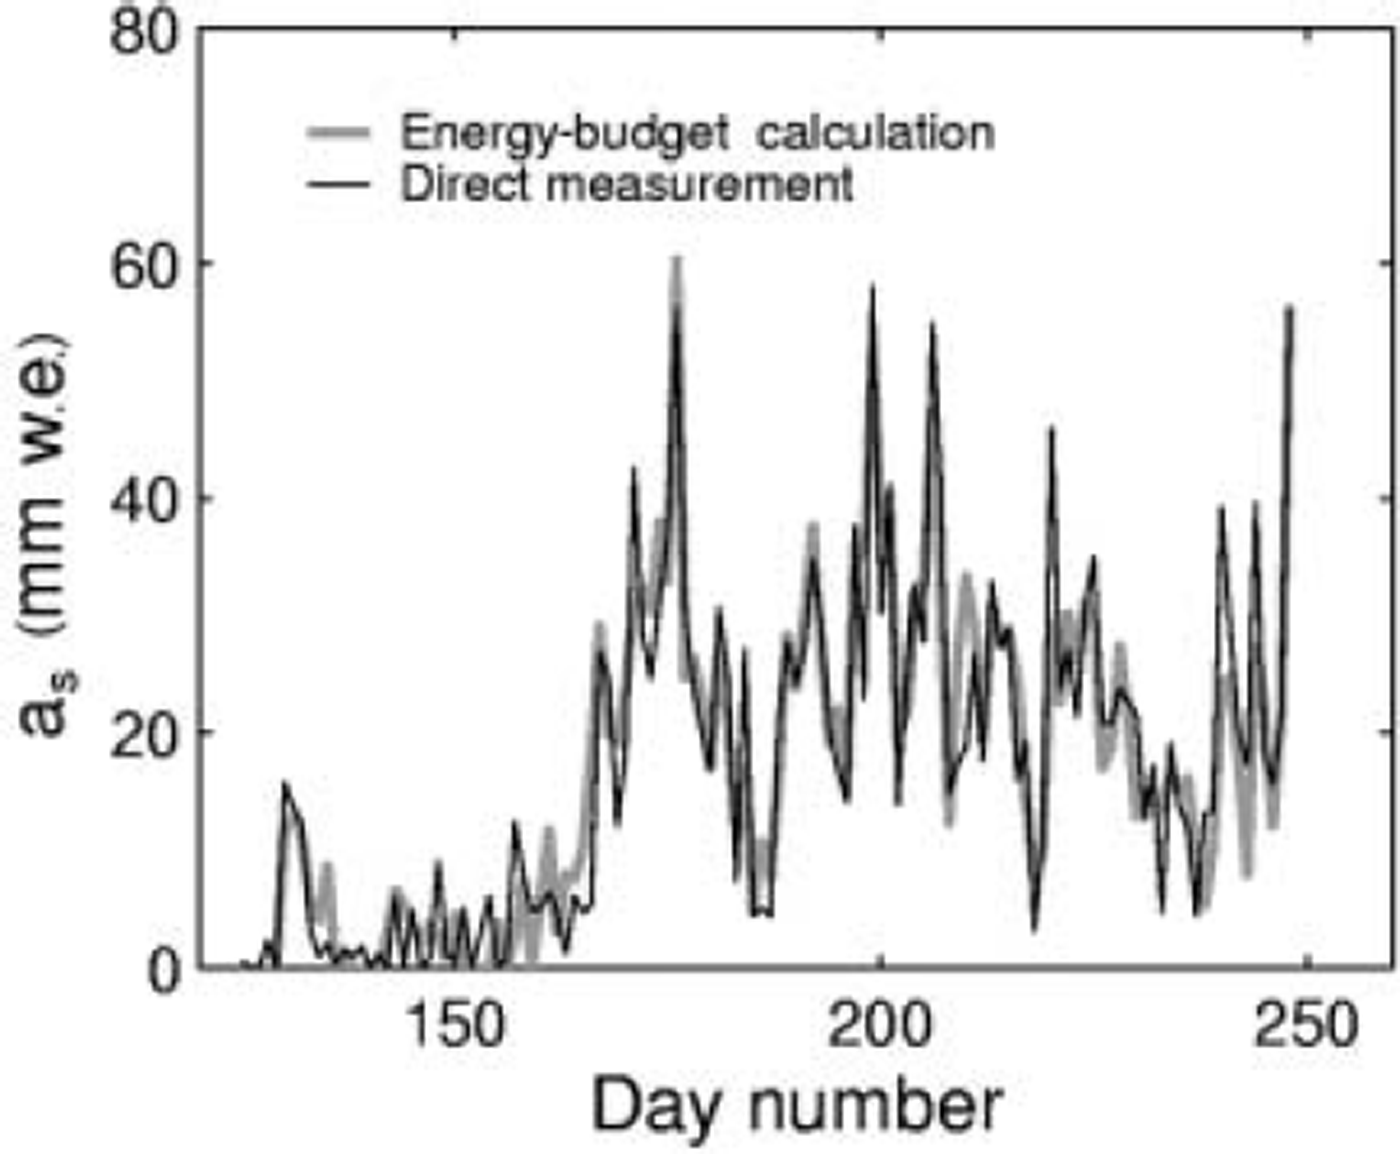
Comparison of direct ablation measurements and energy-budget calculations (Equation (5)). The results show daily melting on Brúarjökull at 1150m in 1996.
3. The Microclimate of Temperature and Wind
Typically the ablation season at the margins of Vatnajökull starts in May and ends in late September. At the southern outlets terminating at 100m elevation, melting can take place in any month, but at the northern and eastern outlets, terminating at 750–850m, ablation typically starts from the beginning to end of May, and 1–2 weeks later at the equilibrium line (1100–1200 m). During the ablation season, temperatures below freezing point were often observed in the accumulation area, although some sublimation was kept up by the net radiation. At the highest AWS, at Grímsfjall (1724 m; Fig. 1), the summer temperature hovers around 0˚C, and the summer balance at the highest elevations of the glacier is typically slightly negative (Reference Björnsson, Pálsson, Guðmundsson and HaraldssonBjörnsson and others, 1998).
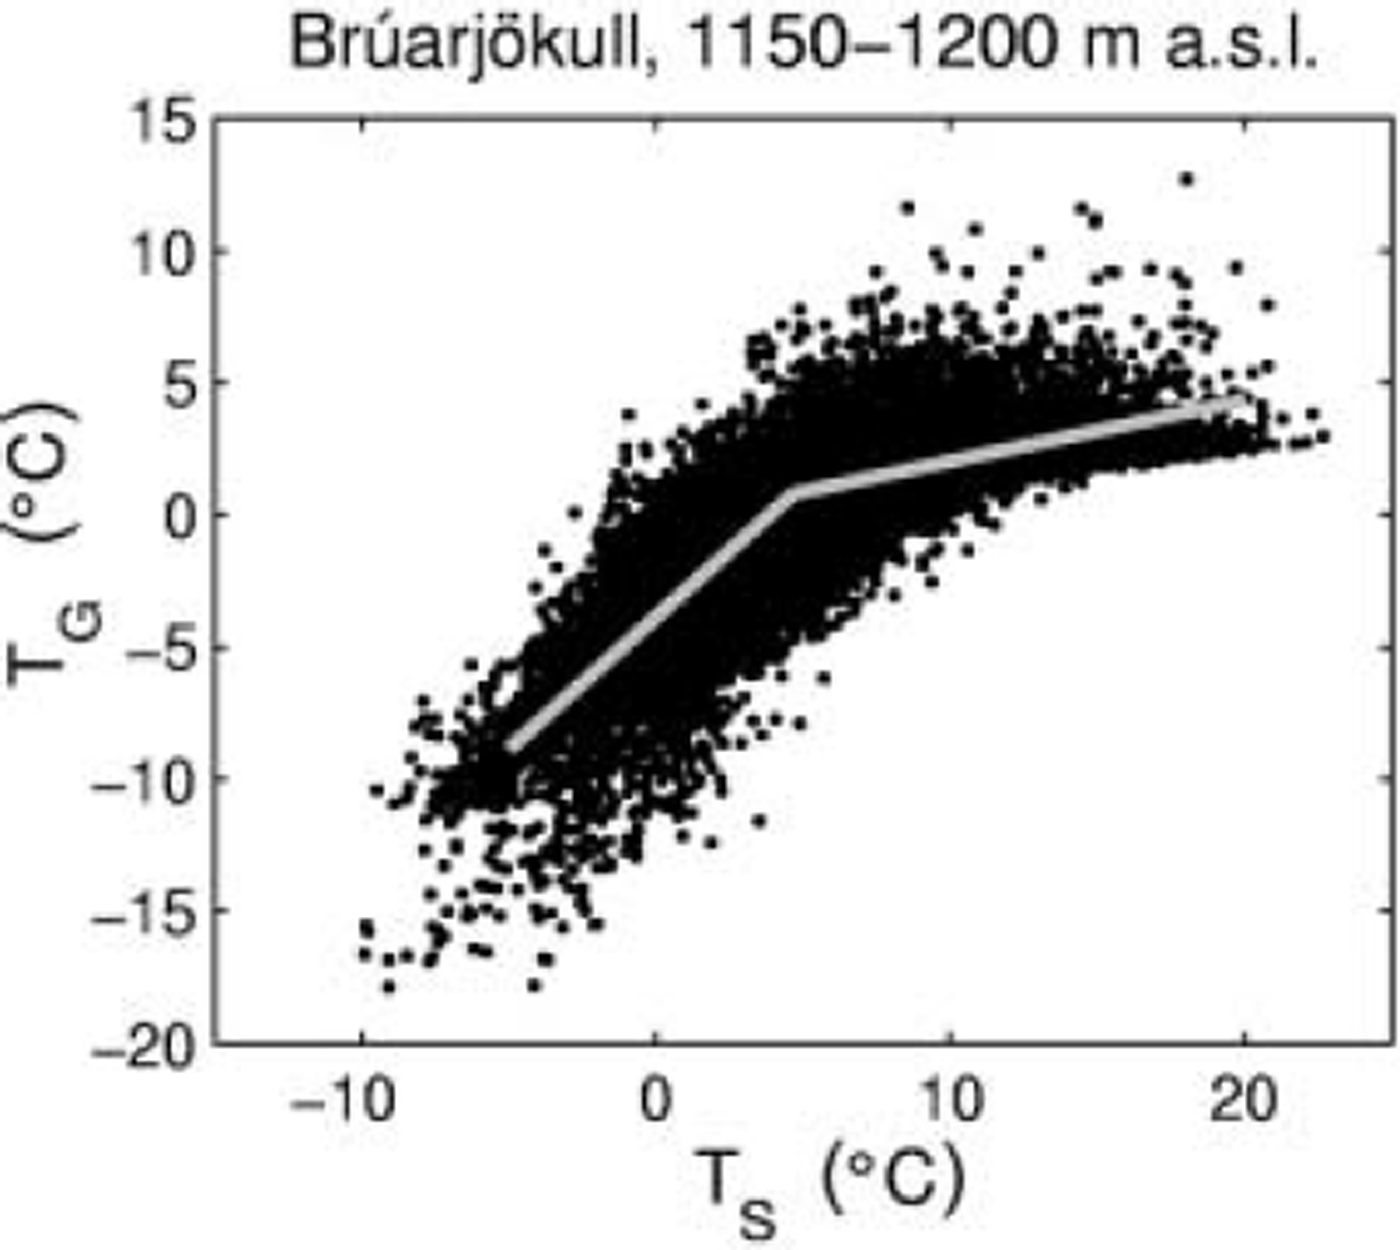
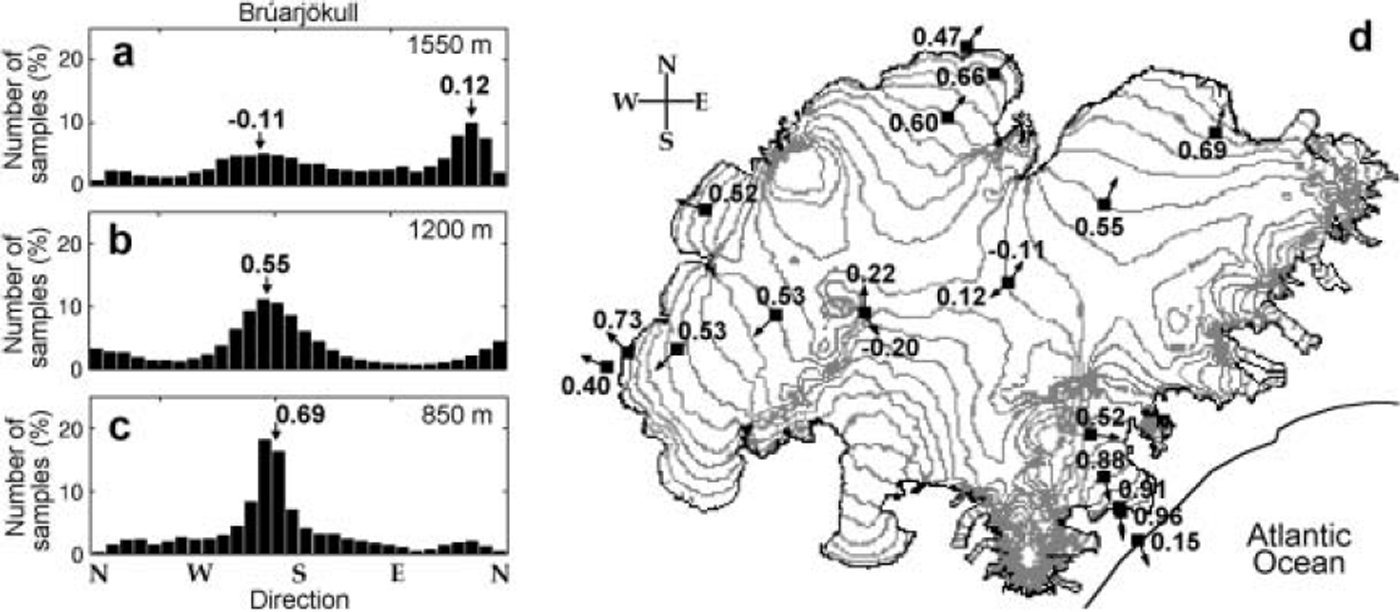
During the reduced cyclonic activity of the summer months, the melting ice cap develops its own microclimate characterized by persistent downslope winds. The air above the glacier boundary layer is warmer than the melting surface, resulting in negative buoyancy forces and gravity winds down the sloping outlets. Furthermore, a large air-temperature difference is set up between the boundary layer over the melting glacier and its low-albedo environs (Fig. 4), and the glacier wind may go together with a pressure gradient set up down-glacier as the warm air rises outside the margins of the glacier. Typically the observed pressure gradient is about 5–10 hPa per 50 km at western Vatnajökull, and even larger at the southern outlet, Breiðamerkurjökull, which terminates at sea level (profile 3 in Fig. 1). The distribution of the wind directions is rather flat on the top of the ice cap but becomes more consistently downslope at the lower elevation (Fig. 5). From September to early May, the conditions for developing the microclimate of the ablation season change and cyclonic weather systems passing Iceland become more influential for the local climate of Vatnajökull.
Example of relationship between air temperatures above the glacier surface (TG) and at the stations outside (TS), as 1 hour means from 1994 to 2003. Piecewise linear regression between temperatures on and off the glacier is shown as imprinted grey lines (see Equation (1)).
(a-c) Histograms showing the distribution of wind directions at Bruarjokull at 1550m (a), 1200m (b) and 850m (c); hourly-mean values, June-August 1994-2003. (d) Contour map of Vatnajökull. The arrows show the most frequent wind direction 0 (typically downslope on the glacier) at all the AWSs (Fig. 1), and the corresponding direction number, calculated as

where i is the sample number, u G the wind speed and WD the wind direction. Thus, Gi for – 1 , 0 and 1 wind blows only up-slope, equally from all directions and only downslope, respectively. The direction numbers and the most frequent wind directions for Brúarjökull are also marked on the histograms in (a) and (b).
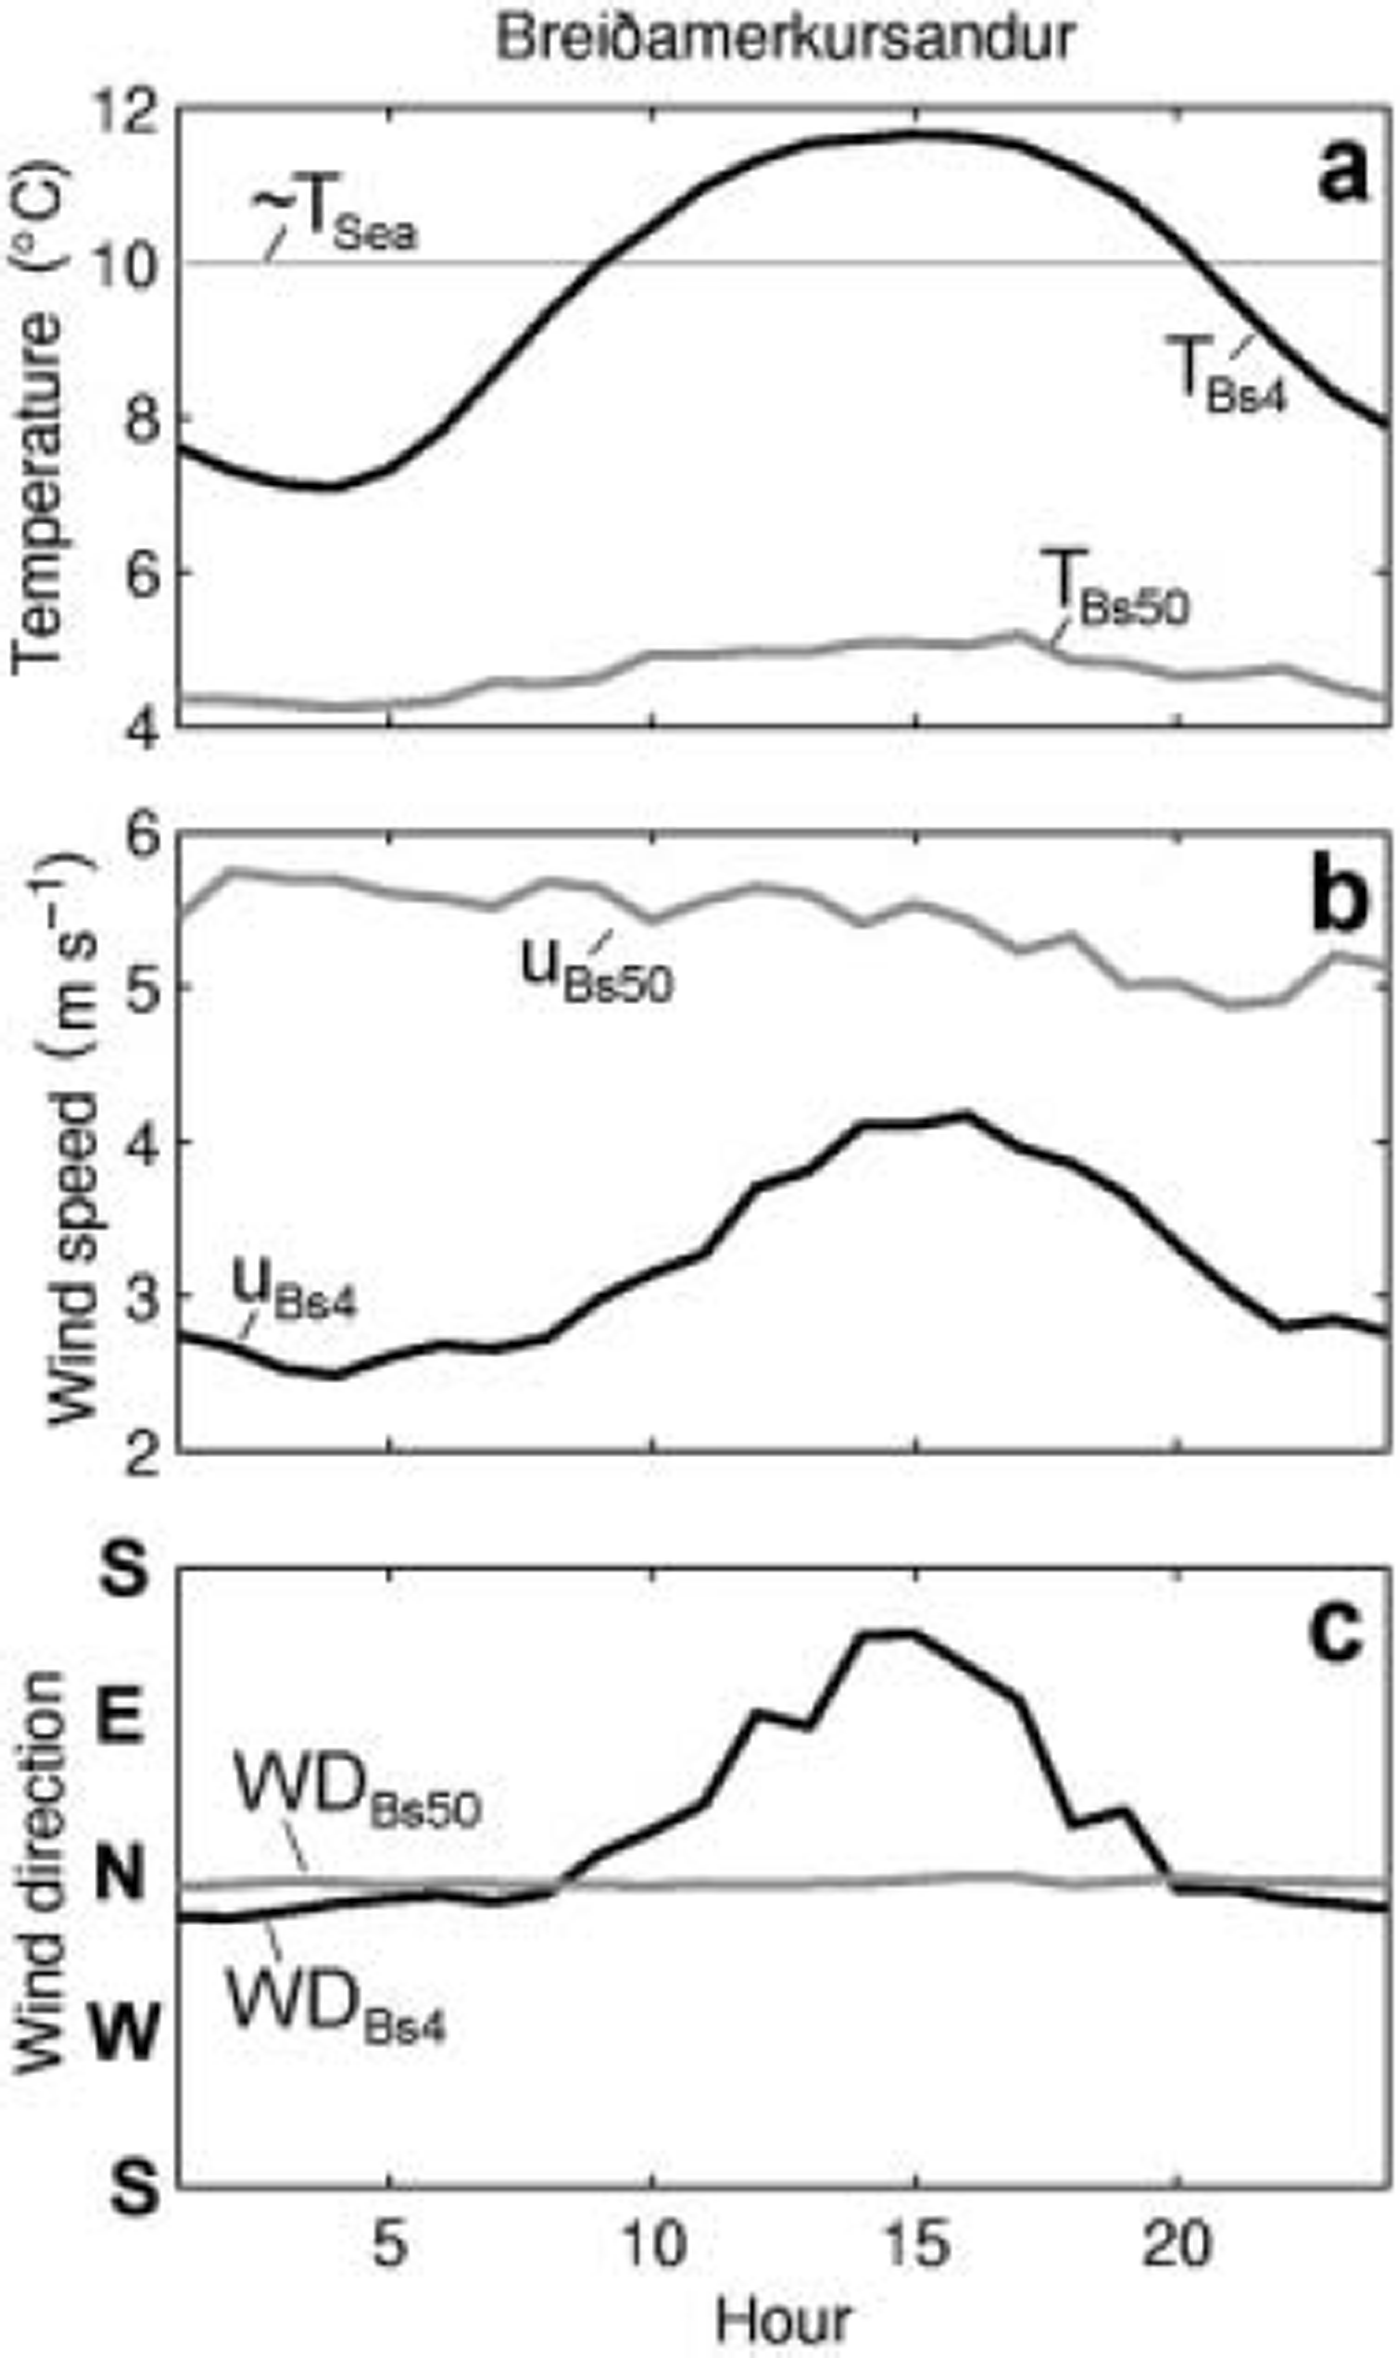
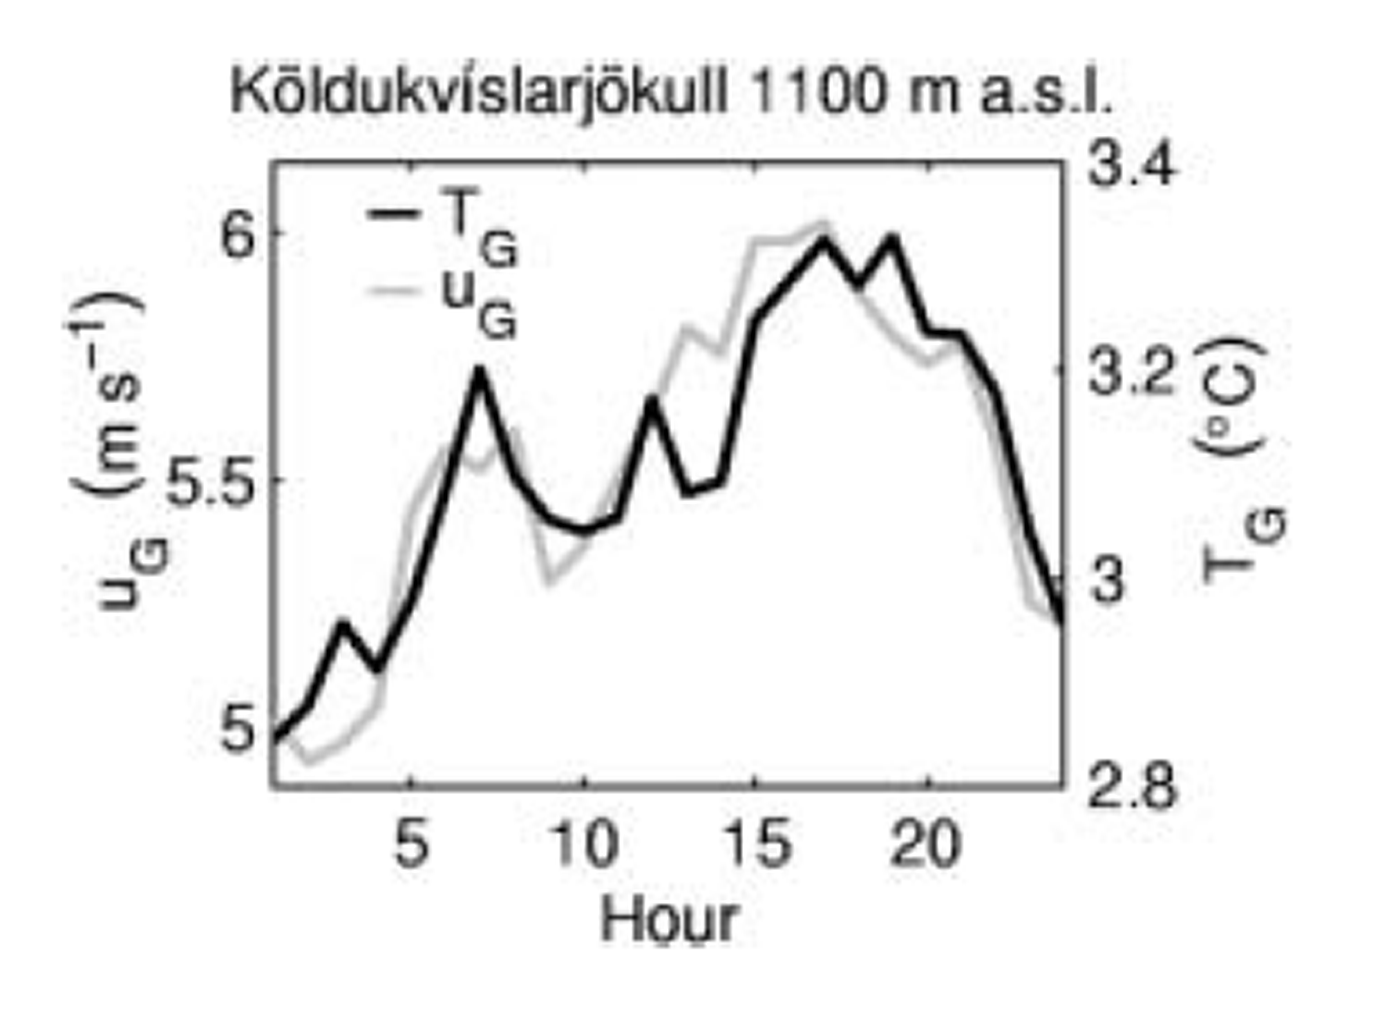
The downslope glacier wind flow is observed during both day and night in June–August (e.g. WDBs50 in Fig. 6c), but the speed is in general related to the temperature variations (in both T G and T S; Figs 7 and 8). Larger diurnal variations in glacier winds were observed in the northern and western than in the southern outlets, and in general no acceleration was seen down the broad, gently sloping Brúarjökull, Dyngjujökull and Tungnaárjökull outlets (profiles 1 , 2 and 4 in Fig. 1). The glacier winds are strongest and most persistent at the steep south-facing Breiðamerkurjökull where they also accelerate down-glacier and show little variation from day to night. The wind field even survives cyclonic activity producing southerly winds at the coast. At 50 m elevation on Breiðamerkursandur outwash plain, wind always blows from the glacier (Fig. 6b and c), but at the coast (4 m elevation) the wind generally blows from sea to land during the daytime (from the east or southeast) and from land to sea during the night (from the north or north-northwest) (Fig. 6a–c).
Mean summer day values (June–August) of (a) temperature, T, (b) wind speed, u, and (c) wind direction, WD, at Breiðamerkursandur. The subscript Bs4 refers to the coast at 4 m a.s.l., and Bs50 to the glacier terminus at 50 m a.s.l. In (a) T sea shows the sea temperature of 10˚C.
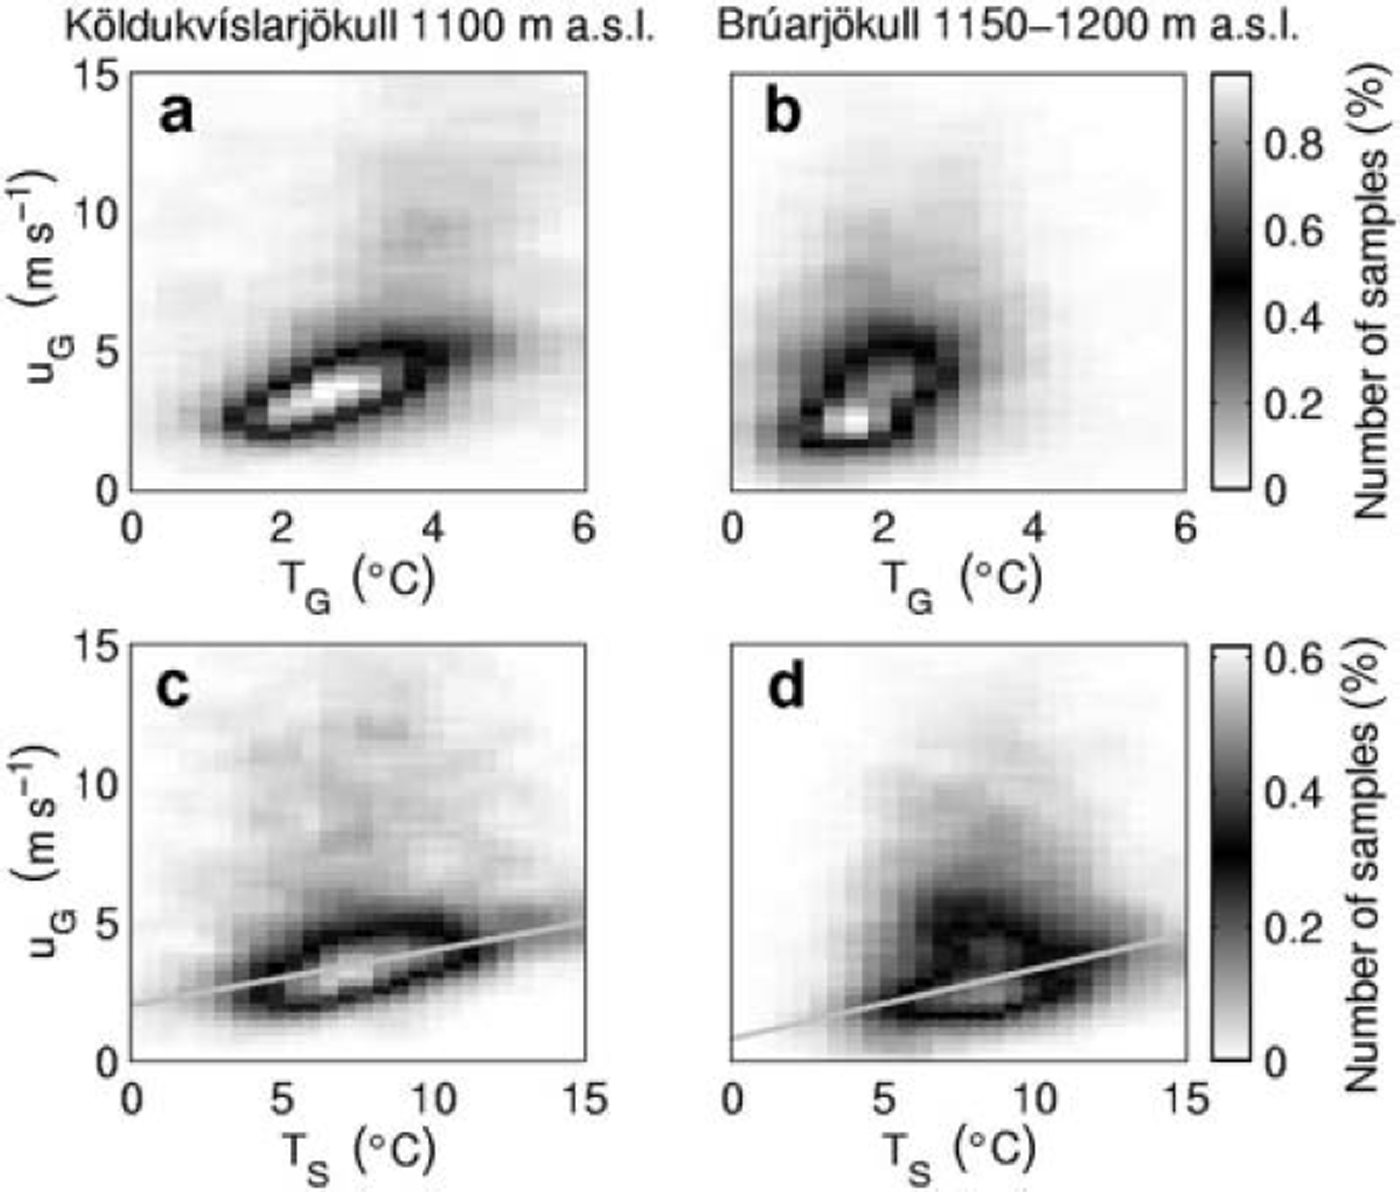
Variation of the glacier wind speed with temperature at 2 m above the melting surface (a, b) and outside the glacier (c, d), shown as three-dimensional histograms with a vertical view. The subplots include 1 hour data from June to August in 1996–2000 at Köldukvíslarjökull at 1100m (a, c) and 1994–2003 at Brúarjökull at 1150–1200m (b, d). The grey lines in (c) and (d) show the slope b1 in Table 1 and Equation (2).
Mean diurnal variations of temperature and glacier wind, calculated using the data in Figure 7a.
4. Empirical Relation Between Glacier Wind Speed and Air Temperatures on the Lowland Off the Melting Ice Cap
A piecewise-linear regression of our AWS data gives the relation

between the temperature changes in the boundary layers on the glacier (ΔTG in °C) and its close environs (ΔT S in °C). Approximating melting conditions with TG ≥ 0°C,

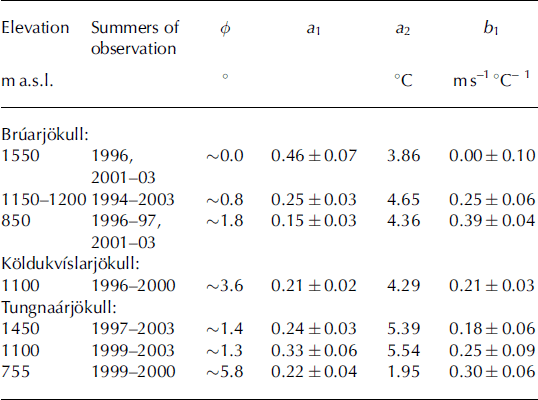
relates the change in the speed of the glacier wind (ΔuG in ms–1) to ΔT S (Fig. 7c and d). The coefficients a 1 , a2 and b1 vary with elevation and between locations on the glacier (Table 1); a 1 and b 1 display the sensitivity of TG and uG at 2 m above the glacier, respectively, to changes in T S. The smallest values of a 1 are found at lower elevations (Table 1) where the temperature deficit is highest between the free atmosphere and the boundary layer of the melting glacier. In general, the conditions for developing the glacier wind become enhanced down-glacier, and its strength increasingly more sensitive to T S (Table 1; Fig. 9a and b). The accuracy of b1 (Table 1) improves with the number of summers observed, increased inclination of the surface and reduced elevation.
Observation periods, the surface slope (φ) and the constants a 1, a2 and b 1 of Equations (1-2)
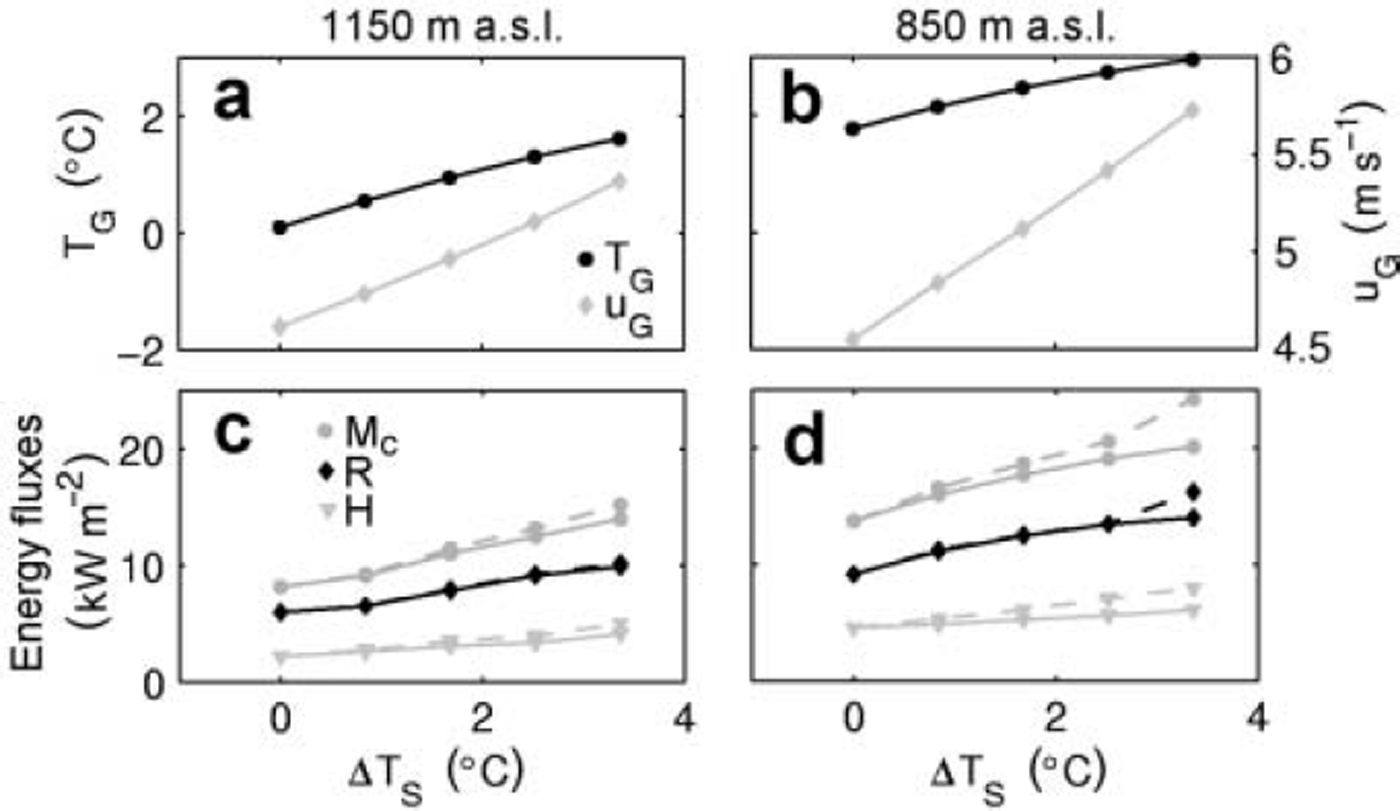
Calculated temperature, wind speed and energy components at Bruarjokull as functions of assumed regional temperature changes at Eyjabakkar (ATS). All parameters represent averages over the period May-August. The solid lines in (c) and (d) show the energy budget assuming only the temperature changes in (a) and (b), and the dashed lines when the wind-speed changes are included.
Using observations from one summer (1996) and external temperature ∼35 km southwest of Vatnajökull, Reference De RuyterdeWildt, Oerlemans and Björnssonde Ruyter de Wildt and others (2003) derived different b 1 values for Bruarjokull (−0.12 to 0.21 ms–1˚C–1 at 1550-850ma.s.l., respectively) and Köldukvíslarjökull (−0.20 ms–1 °C–1). Their estimate for Dyngjujökull is, however, comparable to our values for Bruarjokull. They also obtained b 1 in the range 0.12-0.3 ms–1 °C–1 from 380 down to 165 ma.s.l., respectively, at Breiðamerkurjökull.
5. Estimated Impact of Glacier Wind on Summer Melting
Our observations suggest that warmer climate is accompanied by increased speed of glacier winds on Vatnajökull (Table 1; Fig. 7c and d). To quantify the effect of increased turbulent heat fluxes, we have calculated the energy balance at AWSs on Vatnajökull for two scenarios: first, as observed during May-August 1996 and 2000 (at Bruarjokull and Köldukvíslarjökull in 1996 and at Tungnaárjökull in 2000), and, second, superimposing a stepwise temperature increase (ΔT S) on the observed record. The surface topography was assumed to be unchanged and the winter balance (bw) was set equal to that observed in 1996 at Bruarjokull and Köldukvíslarjökull and 2000 at Tungnaárjökull.
We consider an increase in regional temperature (ATS) as suggested by Reference JόhannessonJόhannesson and others (2004), based on scenarios for climate change in the North Atlantic area:

where At is one decade, d is Julian day and n the total number of days per year. Equation (3) describes sinusoidal variation within the year, with lowest temperature changes taking place in mid-summer and peaks around mid-winter (+0.15˚C and +0.3˚C per decade, respectively). Here, we only predict temperature changes for May-August, a maximum of +0.22˚C per decade in May.
The total energy (Mc) was calculated for a melting glacier surface as

where R is the net radiation. The sensible (Hd) and latent (Hl) heat fluxes were calculated from the wind, temperature and relative humidity at 2 m above the glacier surface using the Monin-Obukhov model (e.g. Reference BjörnssonBjörnsson, 1972). The daily ablation was calculated as
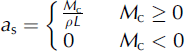
where p is the density of water and L = 3.3 × 10⁵ J kg-1 is the specific latent heat of melting. The daily melting rates (as) estimated by the energy-budget calculations were in good agreement with direct ablation measurements at all the AWSs (Fig. 3).
The daily net radiation was calculated as

with Qi as the incoming shortwave radiation, I i and I o the incoming and outgoing longwave radiation, respectively, and the surface albedo (a) based on observation and varying with the timing of snow to firn/ice transition. According to Reference De RuyterdeWildt, Oerlemans and Björnssonde Ruyter de Wildt and others (2003), the glacier boundary layer above Breiðamerkurjökull outlet (Fig. 1) is generally not thick enough to influence the incoming longwave radiation (I i ) . Our long-term data, however, strongly indicate the variation of I i at western and northern Vatnajökull is lower than changes in
 and higher than in
(σ being the Stefan-Boltzmann constant), i.e. the cold glacier boundary layer affects I i but is not thick enough to eliminate effects of the warm air above. Further, the glacier boundary layer may become thicker with increased T S. Therefore, the changes ΔI i from the present longwave radiation I i were assumed to be intermediate between those of
and
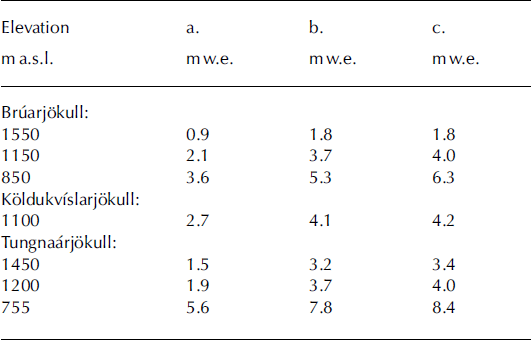
Given our second scenario, calculations predict enhanced summer melting caused by increased eddy fluxes (H = Hd + Hl) and net radiation as shown in Figure 9c and d. The net radiation is more modified by the increased longwave radiation than reduced surface albedo despite earlier exposure of the previous year’s summer surface. The wind-speed changes affect the turbulent eddy fluxes and the ablation at an increasing rate at the lower elevations (Fig. 9; Table 2). For ΔTS =+3°C, ΔTG calculated with Equation (1) and ΔuG =0ms–1, the present summer melting increases by ∼1 mw.e. at 1550m on Bruarjokull and ∼2mw.e. at 755 m on Tungnaárjökull (Table 2, columns a and b). Melting at the other stations increases by ∼1.4-1.8m w.e. Including the wind-speed changes in Equation (2), the melting rates would not change at 1550 m on Brúarjökull, but would increase by 6-8% at the other sites (Table 2, columns b and c). The exceptionally high difference of 19% (5.3-6.3 mw.e. in Table 2) at 850m on Bruarjokull is partly due to the increase in the absorbed net solar radiation (Fig. 9d). At 1100m elevation on the steep-sloping Köldukvíslarjökull, summer wind speed is considerably higher than at the other sites listed in Table 2, explaining the relatively small difference (2% increase).
Column a: May-August ablation in 1996 on Bruarjokull and Köldukvíslarjökull and in 2000 on Tungnaárjökull. Columns b and c: average May-August ablation for ΔTS = +3°C, using only the temperature changes in Equation (1), and including the wind-speed changes in Equation (2), respectively
6. Conclusion
During the ablation season, Vatnajökull develops its own microclimate with persistent glacier winds. The wind field is created by the temperature difference between the boundary layer over the melting glacier and the free atmosphere and the rising air over the warmer lowland environs of the glacier. The variations in speed of the glacier wind can be related empirically to the temperature fluctuations of the lowland environs of the ice cap. This suggests that climate warming would be accompanied by stronger glacier winds, producing stronger turbulent fluxes and increasing the melting rates in the lower ablation areas of ice caps in Iceland.
Acknowledgements
The work was supported by the National Power Company of Iceland, the University of Iceland Research Fund, the European Union projects IEMASS (ENV4-CT97-0490) and SPICE (EVK2-CT-2002-00152) and the Nordic project Climate, Water and Energy. Comments from an anonymous reviewer and the Scientific Editor W. Harrison greatly improved the manuscript.



