


1. Introduction
As one of the major igneous provinces of the world, South China is an important part of the Circum-Pacific magmatic belt, which has long attracted the interest of geologists (e.g. Jahn, Chen & Yan, Reference Jahn, Chen and Yan1976; Jahn, Zhou & Li, Reference Jahn, Zhou and Li1990; Charvet, Lapierre & Yu, Reference Charvet, Lapierre and Yu1994; Lapierre et al. Reference Lapierre, Jahn, Charvet and Yu1997; Li et al. Reference Li, Li, Li, Liu, Yuan, Wei and Qi2007; Li & Li, Reference Li and Li2007). The coastal area of Fujian province is situated along the southeastern boundary of the South China Block (SCB), where the emplacements of voluminous Mesozoic volcanic–intrusive complexes have formed a calc-alkaline volcanic–plutonic belt that is 500 km long and 100 km wide (Charvet, Lapierre & Yu, Reference Charvet, Lapierre and Yu1994; Lapierre et al. Reference Lapierre, Jahn, Charvet and Yu1997; Xu et al. Reference Xu, Dong, Li and Zhou1999; Li, Reference Li2000; Zhou & Li, Reference Li2000; Zhou et al. Reference Zhou, Sun, Shen, Shu and Niu2006b; Zhao et al. Reference Zhao, Hu, Zhou and Liu2007). Late Mesozoic granitic rocks are widely distributed in this region, covering more than 70% of the area (Xu et al. Reference Xu, Dong, Li and Zhou1999). Small volumes of mafic rocks (< 5% of the total igneous rocks), mainly gabbros, are also scattered throughout the area close to the Changle–Nan'ao shear zone (e.g. at Pingtan, Daiqianshan, Qinglanshan, Quanzhou, and Huacuo; see Fig. 1), and they generally show a close spatial relationship with the granitoids forming gabbro–granite complexes, although the gabbros may also occur as stocks, dykes or enclaves (Zhou et al. Reference Zhou, Xu, Dong and Li1994; Zou, Reference Zou1995; Dong et al. Reference Dong, Zhou, Li, Ren and Zhou1997, Reference Dong, Li, Chen, Xu and Zhou1998; Xu et al. Reference Xu, Dong, Li and Zhou1999; Wang, Reference Wang2002).
(a) Simplified geological map of the southeast coast of Fujian showing the distribution of Late Mesozoic gabbro–granite complexes (modified after FJBGMR, 1998; Zhao, Hu & Liu, Reference Zhao, Hu and Liu2004). (b) Geological sketch map of the QZ complex in the Quanzhou area (modified from the 1:500000 geological map of the Fujian Province, FJBGMR, 1998). (c) Geological sketch map of the HC complex in the northwestern suburbs of Tong'an, Xiamen (modified after the 1:50000 geological map of Tong'an Sheet).

Previous studies of the acid and basic igneous rocks of this area have provided petrological, geochemical and isotopic constraints on their origins and evolution, as well as substantial insights into the tectonic setting. The main conclusion of these studies is that the Late Mesozoic magmatism along the coastal area of Fujian province was triggered by the subduction of the Palaeo-Pacific Plate beneath the Eurasian continent, with an emphasis on the significance of the underplating of mantle-derived mafic magmas and crust–mantle interactions (e.g. Lapierre et al. Reference Lapierre, Jahn, Charvet and Yu1997; Xu et al. Reference Xu, Dong, Li and Zhou1999; Li, Reference Li2000; Zhou & Li, Reference Li2000; Zhou & Chen, Reference Zhou and Chen2001; Griffin et al. Reference Griffin, Wang, Jackson, Pearson, O'Reilly, Xu and Zhou2002; Zhao, Hu & Liu, Reference Zhao, Hu and Liu2004; Zhou et al. Reference Zhou, Sun, Shen, Shu and Niu2006b; Zhao et al. Reference Zhao, Hu, Zhou and Liu2007). However, these earlier studies focused separately on either the acidic (e.g. Wu, Reference Wu1991; Martin et al. Reference Martin, Bonin, Capdevila, Jahn, Lameyre and Wang1994; Qiu, Wang & McInnes, Reference Qiu, Wang and McInnes1999; Qiu et al. Reference Qiu, Wang, McInnes, Jiang, Wang and Kanisawa2004, Reference Qiu, Xiao, Hu, Xu, Jiang and Li2008) or the basic rocks (e.g. Zou, Reference Zou1995; Wang, Reference Wang2002; Zhao, Hu & Liu, Reference Zhao, Hu and Liu2004; Zhao et al. Reference Zhao, Hu, Zhou and Liu2007), and insufficient attention has been given to the genetic relationships between the acid and basic magmas, or their interactions within the intrusive environment. Only Xu et al. (Reference Xu, Dong, Li and Zhou1999) performed integrated petrographical, geochemical and Sr–Nd isotope studies on both the gabbros and granites, and they proposed that mechanical mingling and limited chemical mixing between high-alumina basaltic magma and granitic magma resulted in the formation of the Pingtan and Daiqianshan igneous complexes (gabbro–diorite–granite) in the coastal area of Fujian. In addition, Griffin et al. (Reference Griffin, Wang, Jackson, Pearson, O'Reilly, Xu and Zhou2002) and Wang et al. (Reference Wang, Griffin, O'Reilly, Zhou, Xu, Jackson and Pearson2002), based on studies of zircon morphology, geochemistry and in situ Lu–Hf isotopes, advocated the mixing of juvenile, mantle-derived and crust-derived magmas during the generation of the Pingtan igneous complex.
Zircon Lu–Hf isotopic data from the Pingtan igneous complex clearly point to the existence of a depleted mantle source region beneath the coastal area of Fujian during the Late Mesozoic batholith-scale magmatic episode. Furthermore, a recent study of Re–Os and Sm–Nd isotopes, and trace elements in representative basalts and hornblende gabbros from the southeastern coast of China also indicated that the Early Cretaceous basaltic magmas might be derived from a depleted rather than an enriched mantle source (Zhou et al. Reference Zhou, Jiang, Wang, Yang and Zhang2006a). In contrast, other studies of the whole-rock element and Sr–Nd isotopic geochemistry of the mafic rocks (mainly gabbros) exposed along the coastal area of Fujian (including the Pingtan and Daiqianshan gabbros) generally indicate their derivation from an enriched mantle source (Xu et al. Reference Xu, Dong, Li and Zhou1999; Yang et al. Reference Yang, Shen, Tao and Shen1999; Zhou & Chen, Reference Zhou and Chen2001; Zhao, Hu & Liu, Reference Zhao, Hu and Liu2004; Dong et al. Reference Dong, Zhang, Xu, Yan and Zhu2006; Zhao et al. Reference Zhao, Hu, Zhou and Liu2007). Consequently, the nature of the Late Mesozoic mantle beneath the coastal area of Fujian remains a topic of controversy.
The gabbro–granite complexes in the coastal area of Fujian province are ideal for studying the origin and nature of Yanshanian magmatism and the Late Mesozoic tectonic setting of South China. They also offer excellent opportunities to investigate crust–mantle interactions and to gain a better understanding of the evolution of the lithospheric mantle beneath South China. Two representative gabbro–granite complexes from the southeastern coastal area of South China have been selected for analysis in the present study: the Quanzhou (QZ) gabbro–granite complex in the Quanzhou area, and the Huacuo (HC) gabbro–granite complex of Tong'an, Xiamen (Fig. 1). In this paper, we present new geochronological, geochemical, whole-rock Sr–Nd and zircon Lu–Hf isotopic data for the Late Mesozoic gabbros and granites of these two complexes. Our first objective was to determine the nature of the Late Mesozoic mantle beneath the Fujian coastal area of South China, mainly using in situ zircon Lu–Hf isotopic data from the gabbro–granite complexes. Our second objective was to obtain well-constrained emplacement ages and new elemental and isotopic data in order to assess the possible petrogenetic relations between the acid and basic magmas, to understand their genesis and to elucidate the crust–mantle interactions and magmatic differentiation that occurred during their origin and evolution. Our third, more general objective was to provide a better understanding of the geological evolution of the South China coastal area.
2. General geology
South China consists of the Yangtze Block to the northwest and the Cathaysia Block to the southeast, which became amalgamated along a Neoproterozoic collision belt during the Jinningian subduction/collision event (Chen et al. Reference Chen, Foland, Xing, Xu and Zhou1991; Charvet et al. Reference Charvet, Shu, Shi, Guo and Faure1996; Chen & Jahn, Reference Chen and Jahn1998). Located within the eastern part of the Cathaysia Block, and adjacent to the Pacific Plate, the Fujian province of South China is conventionally subdivided into three main tectonic belts (from east to west): the Pingtan–Dongshan metamorphic belt, the Yanshanian magmatic belt, and an Early Palaeozoic fold belt (e.g. Zhao, Hu & Liu, Reference Zhao, Hu and Liu2004; Zhao et al. Reference Zhao, Hu, Zhou and Liu2007). These belts are separated from each other by two major NE–SW-trending faults: the Changle–Nan'ao and Zhenghe–Dapu faults (Fig. 1a, lower right inset). The Pingtan–Dongshan metamorphic belt, exposed in southeastern Fujian, is composed of Yanshanian regionally metamorphosed rocks, Mesozoic granites, volcanic rocks and mafic–ultramafic rocks (Zou, Reference Zou1995; Wang, Reference Wang2002; Yu & Shu, Reference Yu, Shu, Wang and Zhou2002). The Yanshanian magmatic belt, located between the Zhenghe–Dapu and Changle–Nan'ao faults, is made up of Late Jurassic–Cretaceous granitic and volcanic rocks. The granitic rocks include Late Jurassic to Early Cretaceous I-type granites (165 Ma and 120–90 Ma) and minor Late Cretaceous A-type granites (90–70 Ma) (Li, Reference Li2000; Zhao, Hu & Liu, Reference Zhao, Hu and Liu2004; Zhao et al. Reference Zhao, Hu, Zhou and Liu2007). The Early Palaeozoic fold belt to the west has a Precambrian basement that comprises the Mayuan (1766 Ma; Li, Reference Li1997) and Mamianshan (818 Ma; Li, Li & Li, Reference Li, Li and Li2005) groups, strongly overprinted by widespread Mesozoic magmatism. Caledonian and Indosinian overprints have also been recognized locally (Xu et al. Reference Xu, O'Reilly, Griffin, Wang, Pearson and He2007).
The present study area is more or less along the Changle–Nan'ao shear zone, and it includes the middle segment of the Pingtan–Dongshan metamorphic belt and the easternmost part of the Yanshanian magmatic belt (Fig. 1a). The main rocks exposed in the study area are a mixed package of metamorphic rocks, Late Mesozoic granites, volcanics and mafic rocks (mainly gabbros).
The metamorphic rocks in the coastal area of Fujian are composed of greenschist- to amphibolite-facies metasediments (mainly quartzite, impure quartzite, mica schist, mica–quartz schist, andalusite and/or sillimanite–mica schist, and plagioclase-bearing amphibolite) and orthogneisses (mainly granitic gneisses and gneissic granitoids). The metamorphism is traditionally regarded as Early Cretaceous in age, with an apparent peak in the age range 105–125 Ma (Yu & Shu, Reference Yu, Shu, Wang and Zhou2002).
The granitoids exposed in this region are mainly Late Mesozoic calc-alkaline I-type granites. Previously determined zircon U–Pb ages range from 124.7 to 100.3 Ma, and the emplacement of the granitoids and deformation along the Changle–Nan'ao shear zone have been assigned a common age of 120–90 Ma, suggesting their close spatial and temporal relationships (e.g. Tong & Tobisch, Reference Tong and Tobisch1996; Wang, Reference Wang2002 and references therein).
The volcanic rocks in the study area are commonly regarded as components of the Min (Fujian)–Zhe (Zhejiang) Mesozoic volcanic arc (e.g. Wang, Reference Wang2002). They are composed mainly of acidic to intermediate rocks with subduction zone signatures, and they are generally classified as part of the Lower Cretaceous Nanyuan Formation, on the basis of regional structure, stratigraphy and SHRIMP U–Pb zircon ages of 142.3–130.1 Ma (Xing et al. Reference Xing, Lu, Chen, Zhang, Nie, Li, Huang and Lin2008).
The gabbroic rocks distributed along the Changle–Nan'ao shear zone crop out mainly (from north to south) at Pingtan, Daiqianshan, Qinglanshan, Quanzhou and Huacuo (Fig. 1a). All the gabbros, except those at Qinglanshan, are spatially associated with granite, and form gabbro–granite complexes. Outcrops are generally fresh, and they provide excellent exposures for observing petrographic relationships and taking samples for further study.
The Quanzhou (QZ) complex is well exposed in the eastern suburbs of Quanzhou, in Fujian province, and is composed mainly of monzogranite and biotite granodiorite with lesser amounts of hornblende gabbro (Fig. 1b). Diorites are seldom observed. The monzogranites are massive and medium grained, and they contain quartz (30–35%), K-feldspar (30–35%), plagioclase (25–30%) and biotite (~ 1%), with accessory magnetite and zircon. The K-feldspar occurs mostly as microcline with tartan twinning. The biotite granodiorites are coarse grained, with a typical granitic texture. They consist mainly of plagioclase (60–65%), K-feldspar (5–8%), quartz (20–25%) and biotite (8–10%), with accessory apatite, zircon and Fe–Ti oxides. The plagioclases are euhedral–subhedral and generally exhibit polysynthetic twinning and compositional zoning. The hornblende gabbro in the QZ complex is exposed as two isolated and relatively large blocks in the wall rocks of the granitoids (Fig. 1b). These Dongyueshan and Taohuashan blocks are located in the western and eastern parts of the complex, respectively, and have a total area of about 4 km2. The gabbro is medium to coarse grained with porphyritic or porphyritic-like textures. Typical samples are composed mainly of plagioclase (40–65%), hornblende (25–40%) and pyroxene (5–15%), with minor biotite. Accessory phases include zircon and Fe–Ti oxides such as magnetite. Hornblende, the most abundant mafic mineral, occurs mainly as subhedral to euhedral phenocrysts, and is locally altered to calcite and chlorite. It also forms ophitic texture with plagioclase. It is noteworthy that the plagioclase An (anorthite) content in these gabbros ranges from 60% to 92% (including phenocrysts and poikilitic grains), similar to the plagioclase in the Pingtan and Daiqianshan gabbros (Zhou et al. Reference Zhou, Xu, Dong and Li1994; Dong et al. Reference Dong, Li, Chen, Xu and Zhou1998; Xu et al. Reference Xu, Dong, Li and Zhou1999).
The Huacuo (HC) complex, named after Huacuo village, is located in the northwestern suburbs of Tong'an, Xiamen (Fig. 1a). The intrusive rocks of this complex include biotite granite and hornblende gabbro. The biotite granites are massive and medium grained, and they exhibit hypidiomorphic inequigranular textures because of the presence of K-feldspar and quartz megacrysts. The main minerals are quartz (30–40%), K-feldspar (35–45%), plagioclase (~ 15%) and biotite (3–5%), with accessory magnetite and zircon. The hornblende gabbros in the HC complex, which have pod-like shapes, coexist with the biotite granite, and were also intruded into the volcanic rocks of the Lower Cretaceous Nanyuan Formation (Fig. 1c). These gabbros contain plagioclase (40–50%), hornblende (45–55%) and pyroxene (~ 10%), with minor magnetite and rare anhedral quartz. The plagioclase and hornblende commonly exhibit hypidiomorphic textures, and the pyroxene is locally enclosed by plagioclase and hornblende. Remarkably, the plagioclases are nearly pure anorthite, with An contents ranging from 90% to 95%.
3. Analytical procedures
3.a. Zircon U–Pb dating and Lu–Hf isotopes
Zircons from three samples (QZ-1 and QZ-7 from the QZ complex, and HC-2 from the HC complex; see Fig. 1 and Table 1) were separated by conventional techniques, including crushing, sieving, and magnetic and liquid methods. Single crystals of zircon from each sample were hand-picked under a binocular microscope on the basis of size, clarity, colour and morphology. The hand-picked crystals were mounted in epoxy resin and polished to expose their centres. Cathodoluminescence (CL) imaging was then carried out using a Mono CL3+ (Gatan, Pleasanton, CA, USA) attached to a scanning electron microscope (Quanta 400 FEG, Hillsboro, OR, USA) at the State Key Laboratory of Continental Dynamics, Northwest University, Xi'an, China, in order to select appropriate sites for in situ analyses.
U–Pb isotope analyses of zircons from representative samples of the QZ and HC gabbro–granite complexes
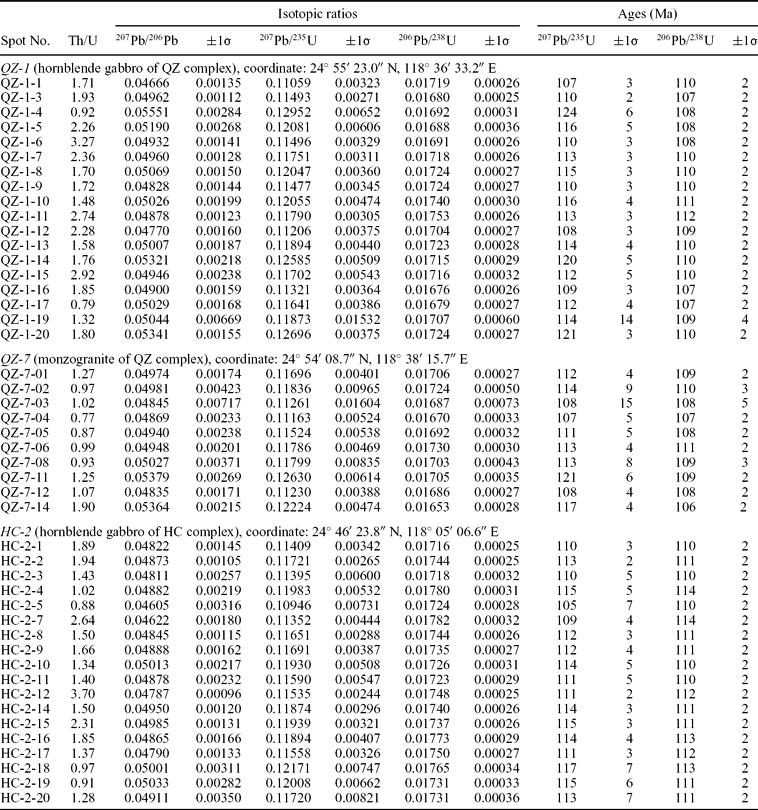
U–Pb ages for the zircons were obtained using laser ablation-inductively coupled plasma-mass spectrometry (LA-ICP-MS) at the State Key Laboratory for Mineral Deposits Research, Nanjing University, China, using an Agilent 7500a ICP-MS attached to a New Wave 213 nm laser ablation system, with spot sizes of 20 μm (QZ-1 and HC-2) and 32 μm (QZ-7), and a repetition rate of 5 Hz. The ablated material was transported in a He carrier gas through PVC tubing (inner diameter, 3 mm) and then combined with Ar in a 30 cm3 mixing chamber prior to entering the ICP-MS for isotopic quantification. A homogeneous standard zircon, GEMOC GJ-1 (207Pb/206Pb age of 608.5 ± 1.5 Ma; Jackson et al. Reference Jackson, Pearson, Griffin and Belousova2004), was used to correct the mass discrimination of the mass spectrometer and residual elemental fractionation. A near-concordant standard zircon, Mud Tank (intercept age 732 ± 5 Ma; Black & Gulson, Reference Black and Gulson1978), was used as the internal standard to optimize the reproducibility and instrument stability. Data were processed using the GLITTER software package (ver. 4.4) (www.mq.edu.au/GEMOC) and the ISOPLOT program (ver. 2.49) (Ludwig, Reference Ludwig2001); corrections for common lead were made using the algorithm developed by Andersen (Reference Andersen2002). The analytical conditions and procedures are similar to those described by Griffin et al. (Reference Griffin, Belousova, Shee, Pearson and O'Reilly2004) and Jackson et al. (Reference Jackson, Pearson, Griffin and Belousova2004).
Each dated zircon crystal was then analysed in situ for Lu–Hf isotope compositions using a Nu Plasma HR multiple-collector (MC)-ICP-MS (Nu Instruments Ltd, Wrexham, UK) coupled with a Geolas 2005 LA system at the State Key Laboratory for Continental Dynamics, targeting (where possible) the same locations used for U–Pb dating or the same oscillatory zones that contained the pits generated by LA-ICP-MS analysis. A spot size of 44 μm and a repetition rate of 10 Hz were used. For details of the analytical conditions and procedures, see Yuan et al. (Reference Yuan, Gao, Dai, Zong, Günther, Fontaine, Liu and Diwu2008). The isobaric interference of 176Lu on 176Hf was corrected based on measurements of the interference-free 175Lu isotope and a recommended 176Lu/175Lu ratio of 0.02669 (DeBievre & Taylor, Reference DeBievre and Taylor1993). Similarly, the interference-free 172Yb isotope and a recommended 176Yb/172Yb ratio of 0.5886 (Chu et al. Reference Chu, Taylor, Chavagnac, Nesbitt, Boella, Milton, German, Bayon and Burton2002) were used to correct the interference of 176Yb on 176Hf. During analyses, three reference standards were also measured: 91500 (176Hf/177Hf ratio 0.282298 ± 0.000011, n = 20, 2σ); GJ-1 (176Hf/177Hf ratio 0.282019 ± 0.000013, n = 23, 2σ); and MON-1 (176Hf/177Hf ratio 0.282726 ± 0.000012, n = 23, 2σ). Their 176Hf/177Hf ratios agree with the recommended values within 2σ error (Yuan et al. Reference Yuan, Gao, Dai, Zong, Günther, Fontaine, Liu and Diwu2008 and references therein).
3.b. Major and trace element and Sr–Nd isotope analyses
All the samples selected for chemical and isotopic analysis have well-preserved igneous textures and are largely fresh. No obvious alteration was found in thin-sections observed under the microscope. Whole-rock samples were crushed and powdered to 200-mesh using an agate mill.
Major element compositions were determined using an ARL9800XP+ X-ray fluorescence (XRF) spectrometer at the Centre of Materials Analysis, Nanjing University, with an analytical precision better than 5%, following the procedures described by Franzini, Leoni & Saitta (Reference Franzini, Leoni and Saitta1972). Trace and rare earth element (REE) contents were determined using a Finnigan Element II ICP-MS at the State Key Laboratory for Mineral Deposits Research, following the procedures described by Gao et al. (Reference Gao, Lu, Lai, Lin and Pu2003). The analytical uncertainty was less than 5% for most elements.
Whole-rock Sr and Nd isotopic compositions were determined at the Centre of Materials Analysis, Nanjing University, using a VG-354 thermal ionization MS (TIMS). Details on sample preparation and analytical procedures can be found in Wang et al. (Reference Wang, Yang, Tao and Li1988). For the present analyses, the Sr and Nd isotopic ratios were corrected for mass fractionation by normalizing to 86Sr/88Sr = 0.1194 and 146Nd/144Nd = 0.7219, respectively. The measured 87Sr/86Sr ratio of the NBS 987 standard and 143Nd/144Nd of the La Jolla standard are 0.710241 ± 0.000006 (2σ) and 0.511859 ± 0.000006 (2σ), respectively. The total procedural blank was 1 × 10⁻⁹ to 2 × 10⁻⁹ g for Sr, and 5 × 10⁻¹¹ to 7 × 10⁻¹¹ g for Nd.
4. Results
4.a. Geochronology
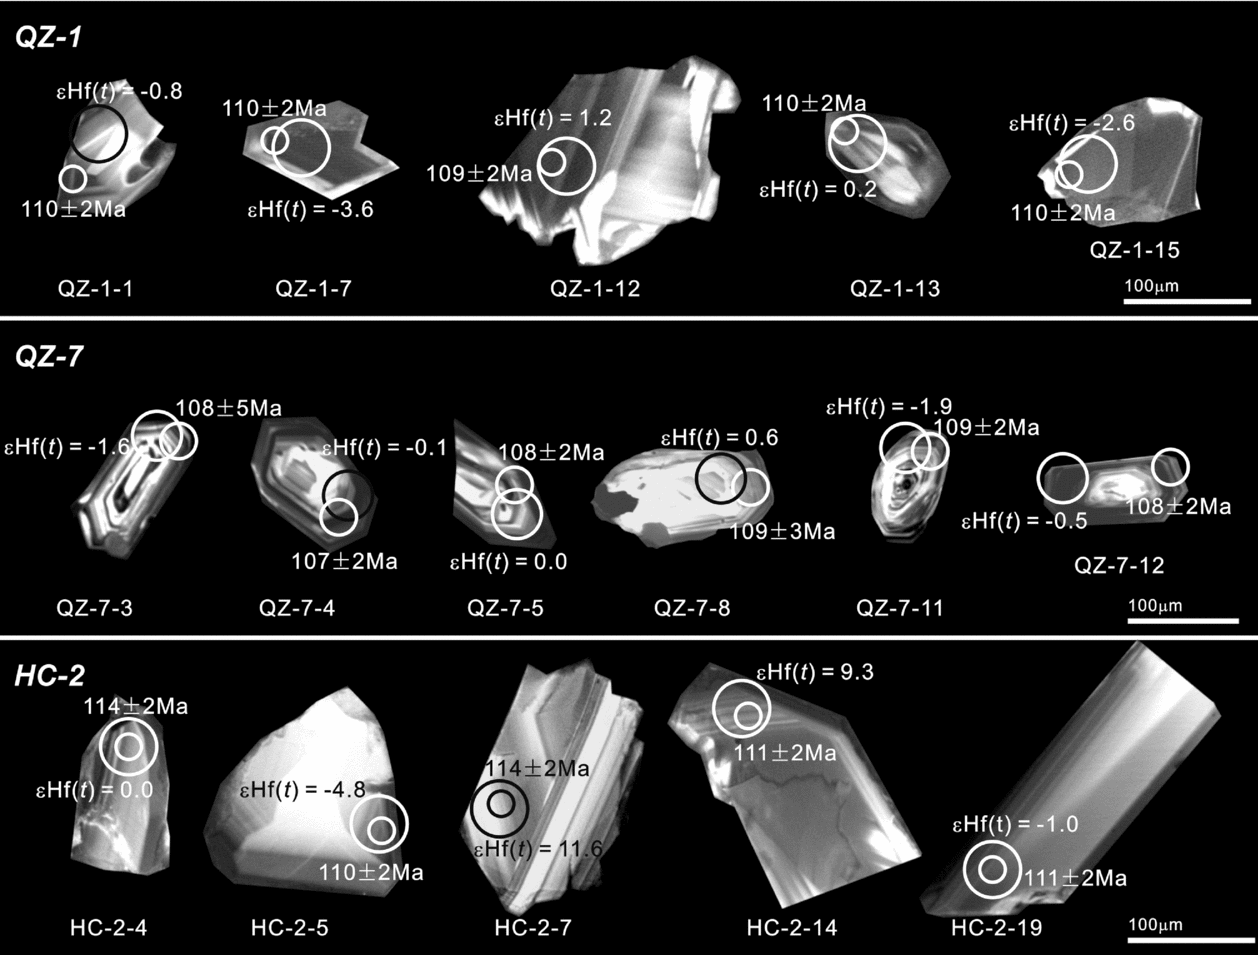
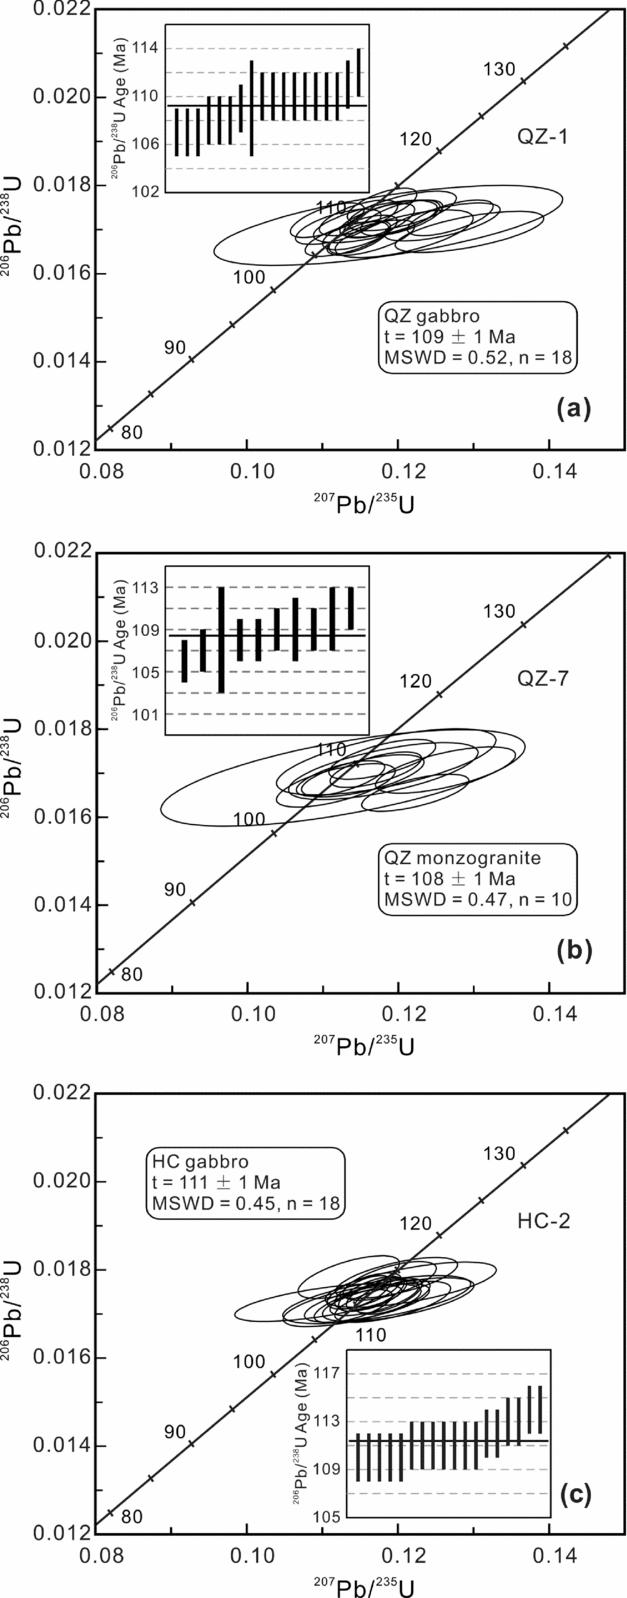
Figure 2 shows CL images of representative zircon grains from the QZ and HC gabbro–granite complexes. The results of LA-ICP-MS U–Pb isotopic analyses are given in Table 1 and are presented graphically in Figure 3. Owing to the imprecision of 207Pb analyses in Phanerozoic zircons, the more reliable weighted mean 206Pb/238U ages of the analysed zircons are adopted here (Compston et al. Reference Compston, Williams, Kirschvink, Zhang and Ma1992).
Representative cathodoluminescence (CL) images of selected zircons from the QZ gabbro (QZ-1), QZ granite (QZ-7) and HC gabbro (HC-2). The morphology of zircon grains, their 206Pb–238U ages and εHf(t) values are shown. Small circles indicate the U–Pb dating positions, and large circles indicate the positions for Hf isotope analysis, with their diameters showing the approximate spot sizes.
Zircon U–Pb concordant diagrams for representative samples from the QZ and HC gabbro–granite complexes on the southeast coast of Fujian. The recalculated weighted mean 206Pb–238U ages are also shown. (a) QZ-1 hornblende gabbro (QZ complex); (b) QZ-7 monzogranite (QZ complex); (c) HC-2 hornblende gabbro (HC complex).
4.a.1. QZ hornblende gabbro (QZ-1)
Zircons in the medium-grained hornblende gabbro QZ-1, from the QZ complex, are fine to medium (lengths of 60–170 μm and length/width ratios in the range 2–3/1), colourless or light brown, transparent to cloudy, euhedral to subhedral grains and fragments. All grains have high Th/U ratios (0.79–3.27) (Table 1) and show typical zoning absorption in CL images (Fig. 2), indicating an origin from mafic magma (Yang et al. Reference Yang, Xu, Yang, Wang, Wang and Liu2008). Eighteen analyses form a concordant group with a weighted mean 206Pb/238U age of 109 ± 1 Ma (MSWD = 0.52, 2σ) (Fig. 3a), which represents the crystallization age of the QZ hornblende gabbro.
4.a.2. QZ monzogranite (QZ-7)
Zircon grains in the medium-grained monzogranite QZ-7, from the QZ complex, are dominantly colourless and transparent, euhedral and prismatic, with lengths of 100–160 μm and length/width ratios in the range 2–4/1. The rhythmic oscillatory zoning shown in the CL images (Fig. 2), combined with the high Th/U ratios (0.77–1.90) (Table 1), suggest a magmatic origin. Ten analyses are all concordant or near-concordant, with a weighted mean 206Pb/238U age of 108 ± 1 Ma (MSWD = 0.47, 2σ) (Fig. 3b), considered to represent the crystallization age of the QZ monzogranite.
4.a.3. HC hornblende gabbro (HC-2)
Zircon grains in the medium-grained hornblende gabbro HC-2, from the HC complex, are colourless and transparent, euhedral to subhedral, and pyramidal or prismatic in shape with lengths of 120–300 μm and length/width ratios in the range 1.5–4/1. They generally show typical zoning absorption and occasionally subtle magmatic oscillatory zoning in CL images (Fig. 2), and have high Th/U ratios (0.88–3.70) (Table 1), indicating their magmatic origin. None has a texturally distinct core. Eighteen analyses on homogeneous or oscillatory-zoned magmatic zircons yielded a concordant group with a weighted mean 206Pb/238U age of 111 ± 1 Ma (MSWD = 0.45, 2σ) (Fig. 3c), considered to be the best estimate for the crystallization age of the HC hornblende gabbro.
4.b. Geochemistry
4.b.1. Major elements
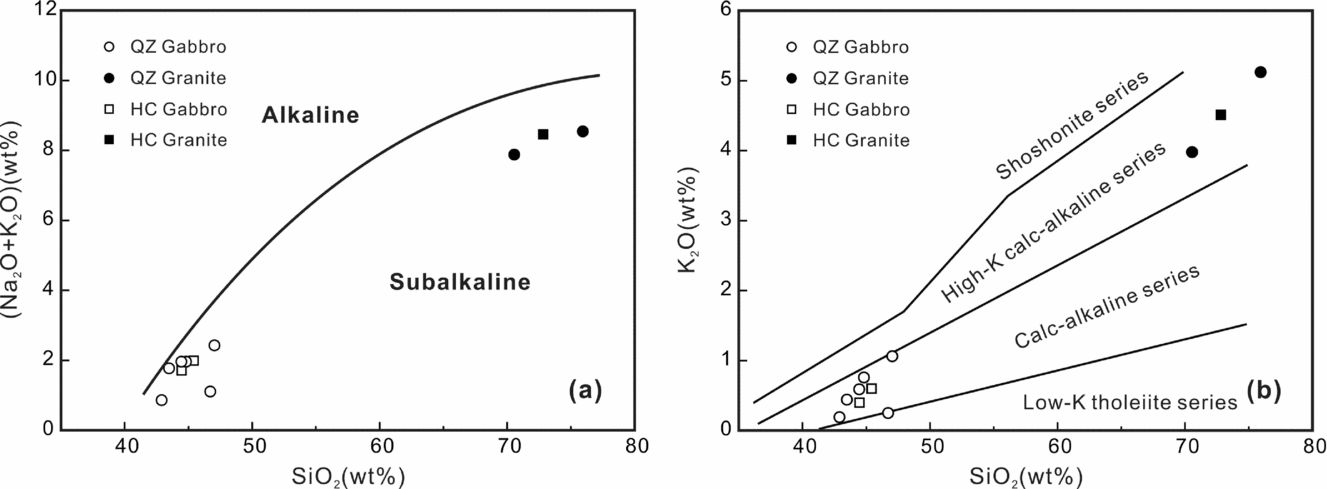
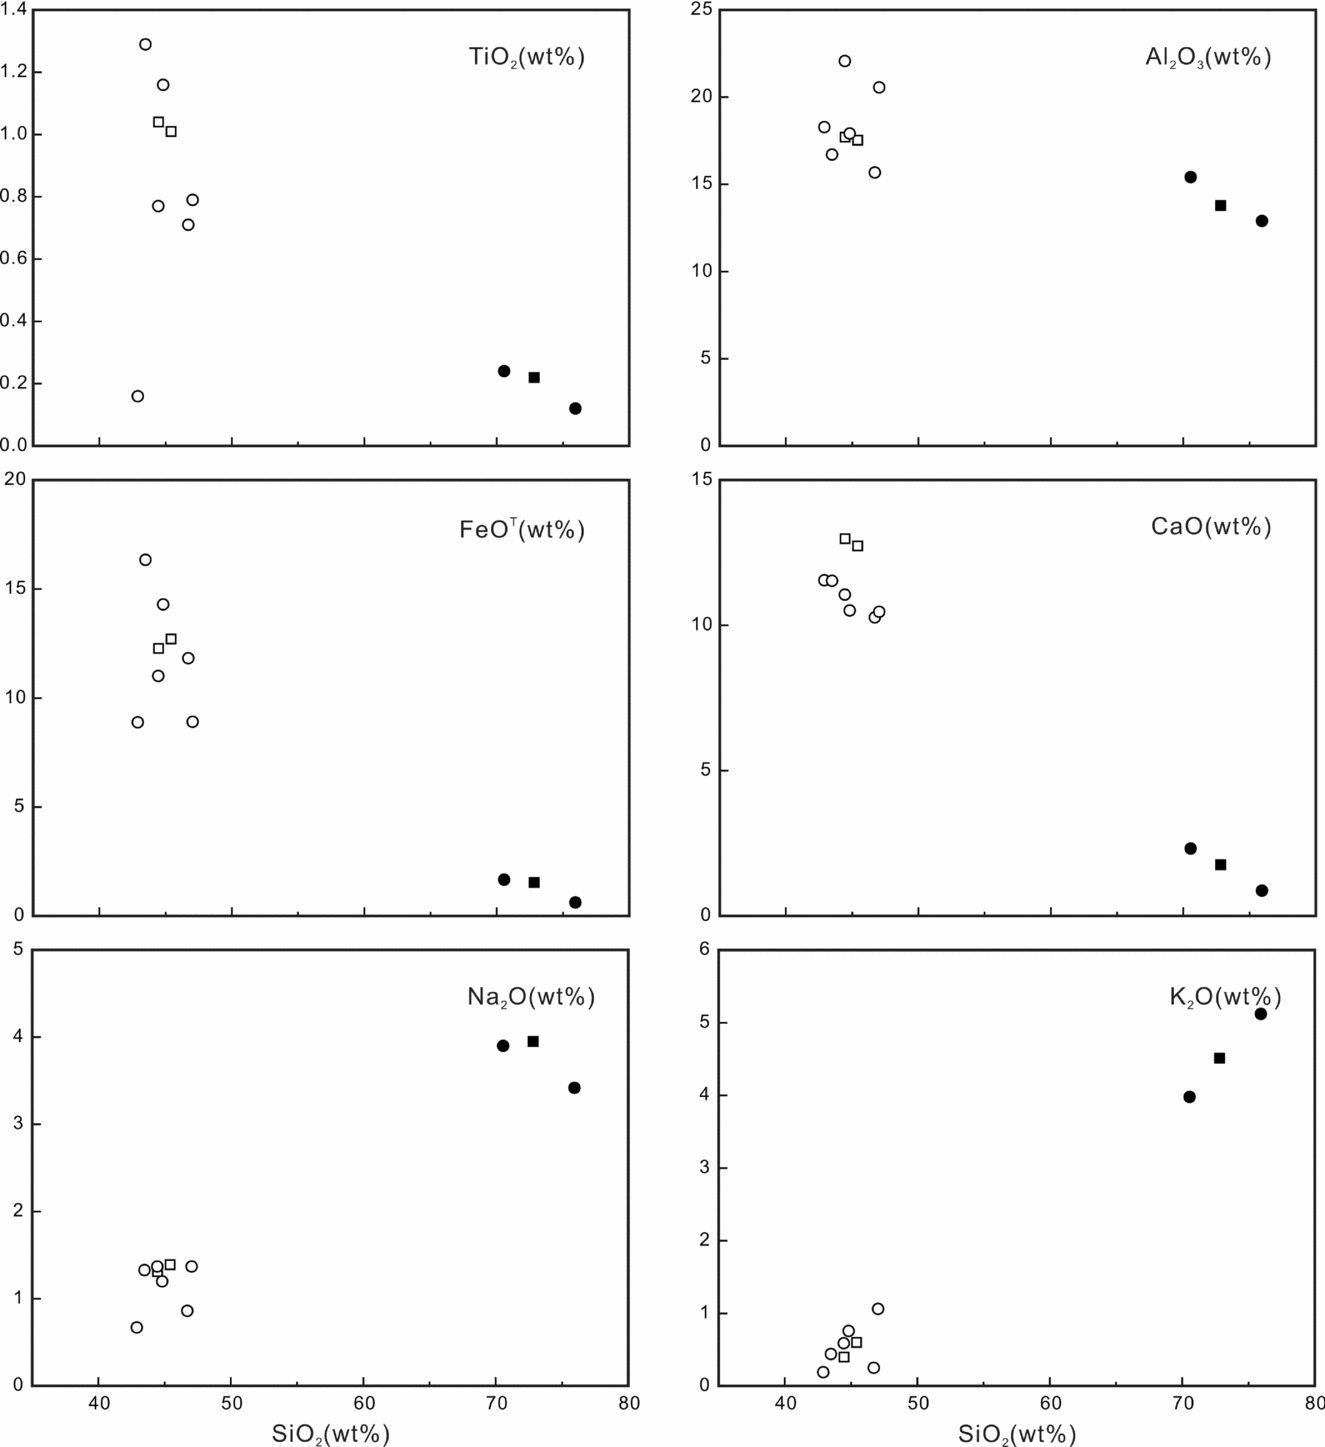
Table 2 lists the whole-rock major element data obtained for representative samples collected from the QZ and HC gabbro–granite complexes. The mafic rocks in both the QZ and HC complexes are hornblende gabbros, with SiO2 contents ranging from 42.90% to 47.03% (Fig. 4a). These gabbros are characterized by high Al2O3 (generally > 17%, with an average value of 18.31%) and CaO (> 9%) contents (Fig. 5), similar to high-alumina basalts, and they are calc-alkaline in terms of the SiO2 v. K2O diagram (Fig. 4b). They contain low concentrations of TiO2 (0.16–1.29%) and P2O5 (0.06–0.12%), and variable contents of MgO (6.08–14.69%), with Mg no. ranging from 0.41 to 0.75.
Major element contents (wt%) of representative samples from the QZ and HC gabbro–granite complexes
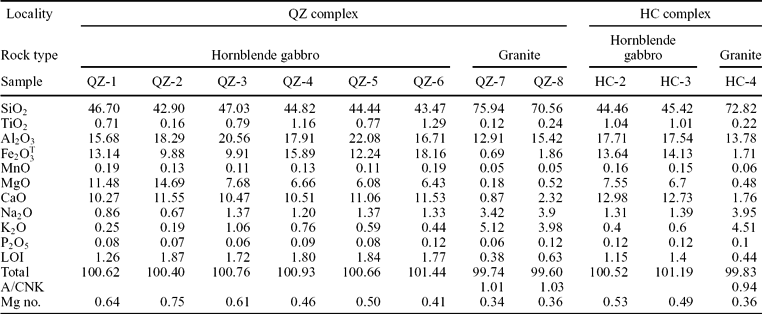
Note: LOI – loss on ignition; A/CNK = molar Al2O3/(CaO + Na2O + K2O); Mg no. = molar Mg/(Mg + Fe).
(a) SiO2 v. K2O + Na2O diagram of representative samples from the QZ and HC gabbro–granite complexes on the southeast coast of Fujian. The boundary between the alkaline and subalkaline series is after Irvine & Baragar (Reference Irvine and Baragar1971). (b) SiO2 v. K2O diagram of representative samples from the QZ and HC gabbro–granite complexes on the southeast coast of Fujian. The series boundaries are after Rickwood (Reference Rickwood1989).
Plots of TiO2, Al2O3, FeOT, CaO, Na2O and K2O v. SiO2 for representative samples from the QZ and HC gabbro–granite complexes on the southeast coast of Fujian. Symbols are the same as those in Figure 4.
The felsic rocks in the QZ complex are predominantly granodiorite to monzogranite, with SiO2 contents ranging from 70.56% to 75.94% (Fig. 4a). They are potassium-rich, with K2O/Na2O ratios of 1.02 to 1.50, they have moderate alkali concentrations (K2O + Na2O = 7.88–8.54%; Fig. 4a), and they fall within the high-K calc-alkaline series on the SiO2 v. K2O diagram (Fig. 4b). Several lines of evidence, including the relatively low A/CNK (molar A12O3/(CaO + Na2O + K2O); Shand, Reference Shand1943) values of 1.01 to 1.03, and the lack of typical peraluminous minerals (e.g. cordierite, andalusite and garnet) or alkaline mafic minerals (e.g. arfvedsonite, riebeckite and aegirine-augite), indicate that the granitoids of the QZ complex are I-types. Similarly, biotite granite in the HC complex has a high SiO2 content (72.82%), is also high-K and calc-alkaline, has total alkalis (K2O + Na2O) of 8.46% and a K2O/Na2O ratio of 1.14 (Fig. 4a, b), and has I-type affinities with a lower A/CNK value of 0.94.
Moreover, the major element data for representative samples from these complexes show a distinctly bimodal distribution of silica, corresponding to the Daly gap on a Harker diagram of SiO2 v. other oxides (Fig. 5).
4.b.2. Trace elements
Table 3 lists the trace element compositions of rocks in the QZ and HC gabbro–granite complexes. Hornblende gabbros from the QZ and HC complexes have total rare earth elements (ΣREEs) of 16.26–71.01 ppm and 48.25–71.11 ppm, respectively. The analysed samples are moderately enriched in light rare earth elements (LREEs), with (La/Yb)N ratios of 3.40–7.82 (QZ) and 4.41–5.06 (HC), and show a minor positive or small negative Eu anomaly, with Eu/Eu* values of 0.82–1.52 (QZ) and 0.78–1.05 (HC) (Table 3), suggesting that fractional crystallization or the accumulation of plagioclase did not play significant roles in their origins. The granitoids in these two complexes possess slightly higher ΣREE contents of 82.28–95.42 ppm (QZ) and 114.06 ppm (HC), and show similar chondrite-normalized REE patterns (Fig. 6a, b) relative to the coexisting gabbros. However, they display a stronger enrichment in LREEs, with (La/Yb)N ratios of 10.32–26.95 (QZ) and 9.00 (HC), and a more pronounced LREE fractionation, as shown by steeper slopes in chondrite-normalized REE patterns (Fig. 6a, b). They also have moderate negative Eu anomalies, with Eu/Eu* values of 0.47–0.87 (QZ) and 0.67 (HC) (Table 3).
Trace and rare earth element (ppm) analyses of representative samples from the QZ and HC gabbro–granite complexes
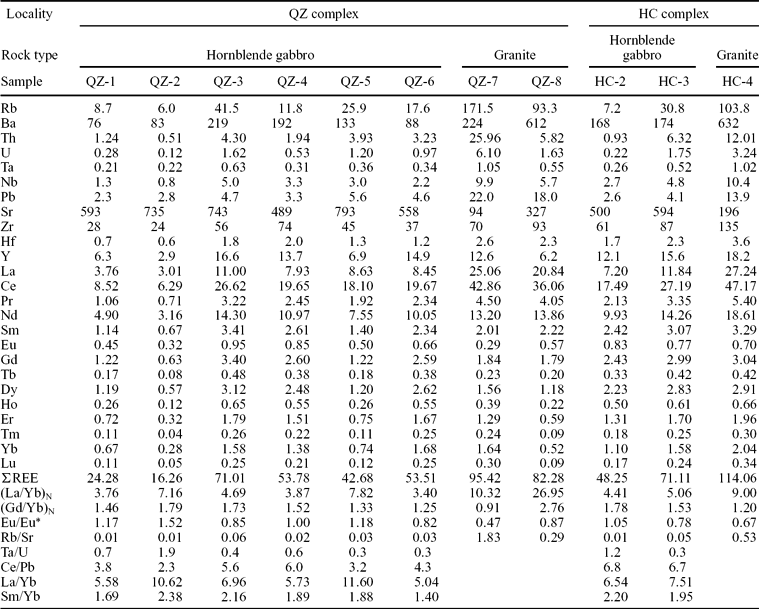
Note: (La/Yb)N = LaN/YbN, (Ga/Yb)N = GaN/YbN, Eu/Eu* = EuN/(SmN × GdN)1/2; subscript N – chondrite-normalized value.
Chondrite-normalized REE patterns (a, b) and primitive mantle-normalized trace element spidergrams (c, d) for representative samples from the QZ and HC gabbro–granite complexes on the southeast coast of Fujian. Normalized values for chondrite and primitive mantle are from Boynton (Reference Boynton and Henderson1984) and McDonough & Sun (Reference McDonough and Sun1995), respectively.
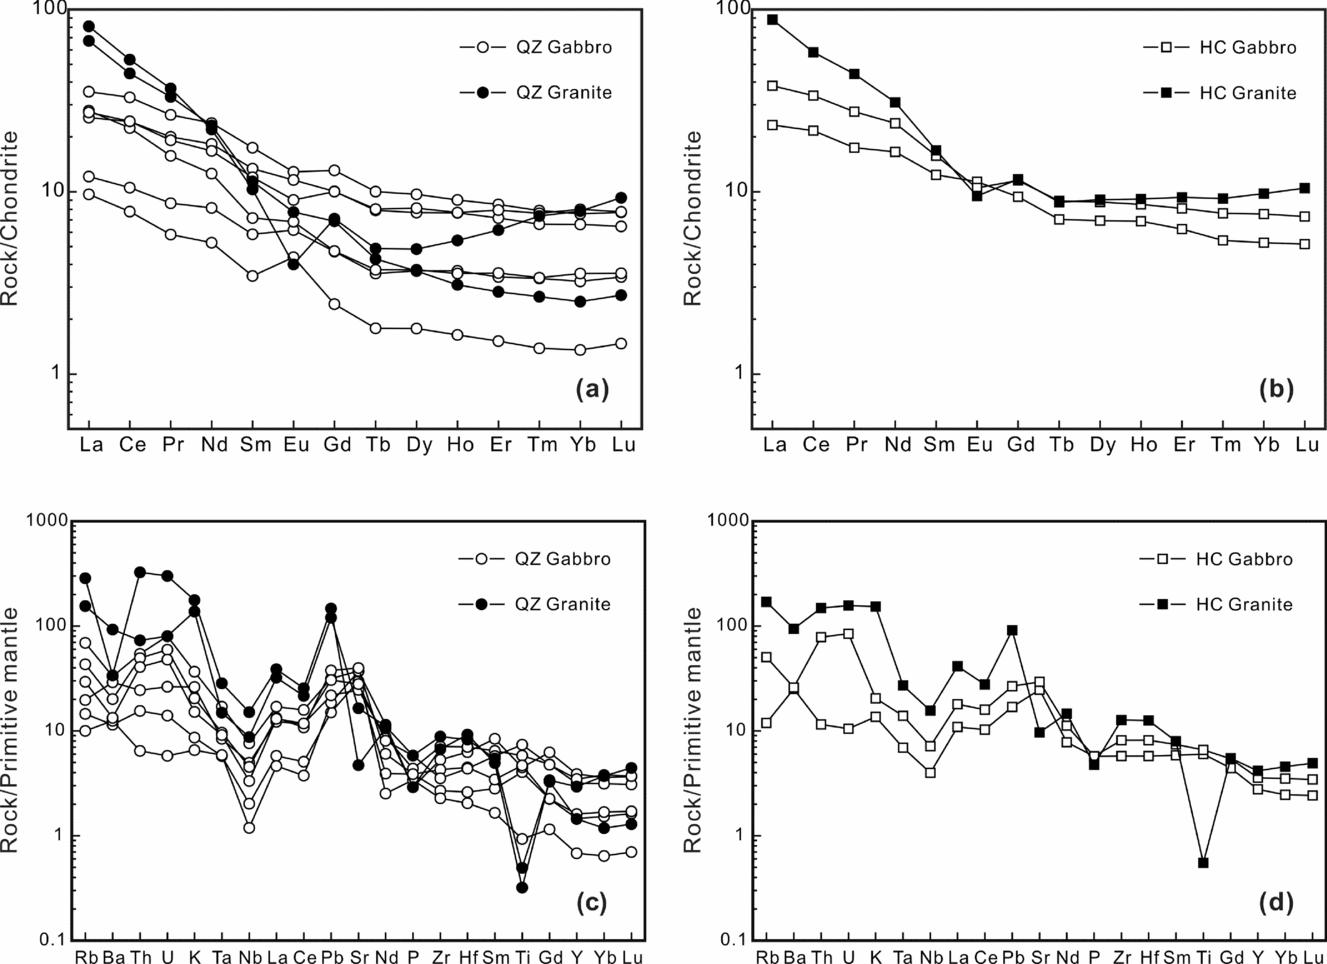
In primitive mantle-normalized spidergrams (Fig. 6c, d), all of the gabbro samples show a significant enrichment in large-ion lithophile elements (LILEs; Rb, Ba, Th, and U) and depletion in high-field-strength elements (HFSEs; Nb and Ta), which is strongly indicative of a subduction zone origin. The associated granitoids show a Nb–Ta trough in spidergrams, consistent with the trace element patterns expected in magmatic rocks related to a subduction zone. Although the granitoids differ from the gabbros in terms of being depleted in Sr and Ti, and enriched in Pb, their primitive mantle-normalized patterns still show some similarities with those of the gabbros (Fig. 6c, d).
In brief, the REE and trace element patterns of the gabbroic and granitic rocks from the QZ and HC complexes are similar in many respects, suggesting that they are genetically related.
4.c. Whole-rock Sr–Nd isotopes
The whole-rock Sr–Nd isotopic compositions of representative gabbroic and granitic rocks from the QZ and HC complexes are listed in Table 4 and plotted in Figure 7. The initial 87Sr/86Sr ratios (87Sr/86Sri), initial 143Nd/144Nd ratios (143Nd/144Ndi) and εNd(t) values were calculated for the new ages determined as part of this study, as obtained using the LA-ICP-MS zircon U–Pb method (except for sample Ta-2; see Table 4).
Whole-rock Rb–Sr and Sm–Nd isotopic compositions of representative samples from the QZ and HC gabbro–granite complexes
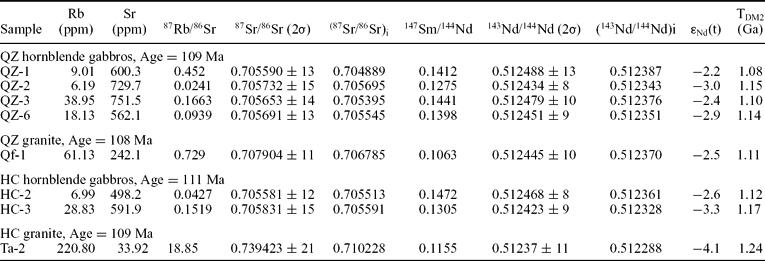
Note: Chondrite uniform reservoir (CHUR) values (87Rb/86Sr = 0.0816, 87Sr/86Sr = 0.7045, 147Sm/144Nd = 0.1967 and 143Nd/144Nd = 0.512638) are used for calculation. (87Sr/86Sr)i, (143Nd/144Nd)i and εNd(t) values are calculated based on 87Rb decay constant of 1.42 × 10⁻¹¹ (Steiger & Jäger, Reference Steiger and Jäger1977) and 147Sm decay constant of 6.54 × 10⁻¹² (Lugmair & Marti, Reference Lugmair and Marti1978), respectively. TDM2 ages are calculated according to the two-stage model as presented by Wu et al. (Reference Wu, Jahn, Wilde, Lo, Yui, Lin, Ge and Sun2003). The primitive Sr–Nd analytical results of QZ and HC granites are from Zhou & Chen (Reference Zhou and Chen2001).
(a) Age v. εNd(t) values plot and (b) initial 87Sr/86Sr v. 143Nd/144Nd plot for representative samples from the QZ and HC gabbro–granite complexes on the southeast coast of Fujian. CHUR – chondritic uniform reservoir; DM – depleted mantle; EM-1 and EM-2 – enriched mantle; HIMU – mantle with high U/Pb ratio; PREMA – frequently observed PREvalent MAntle; BSE – bulk silicate Earth; MORB – mid-ocean ridge basalts. The area for Nd evolution of the Proterozoic crust in the SCB is from Shen et al. (Reference Shen, Zhu, Liu, Xu and Ling1993); the approximate fields of mantle reservoirs and MORB are from Zindler & Hart (Reference Zindler and Hart1986). Symbols are the same as those in Figure 4.
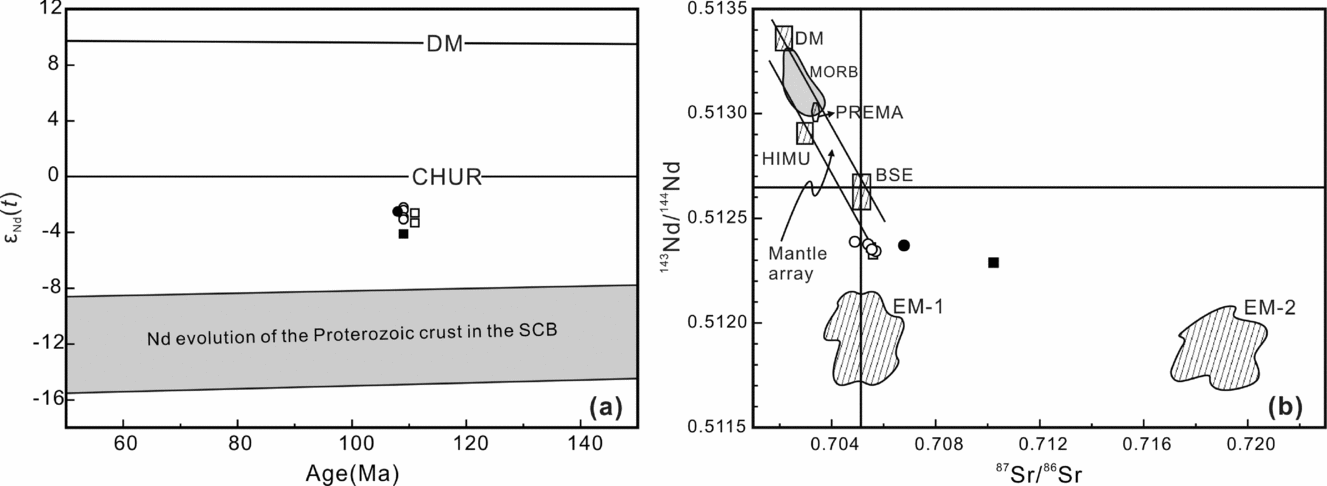
The QZ gabbros and granites have consistent Sr isotopic compositions, with moderate initial 87Sr/86Sr ratios of 0.7049–0.7057 (QZ gabbros) and 0.7068 (QZ granites), and homogeneous Nd isotopic compositions, with εNd(t) values of −3.0 to −2.2 (QZ gabbros) and −2.5 (QZ granites). Similarly, the gabbros and granites from the HC complex show analogous Nd isotopic compositions, with εNd(t) values of −3.3 to −2.6 (HC gabbros) and −4.1 (HC granites), but their Sr isotopic compositions are different from each other. The HC gabbros have 87Sr/86Sr ratios in the range 0.7055–0.7056, whereas the HC granite (sample Ta-2) yields a value of 0.7102. This discrepancy is largely the result of the low Sr and high Rb contents (thus the elevated Rb/Sr ratio of 6.51) of sample Ta-2 (Table 4), which induce radiogenic ingrowth of 87Sr and strongly magnified the error associated with estimating the Rb/Sr ratio when calculating the initial 87Sr/86Sr ratio (Wu et al. Reference Wu, Li, Yang and Zheng2007).
In summary, the Sr and Nd isotopes of the QZ and HC gabbros show similarities with those of the coexisting granites, indicating that the gabbros and granites are genetically related.
4.d. Zircon Lu–Hf isotopes
The same three samples selected for U–Pb dating were used for in situ Lu–Hf isotopic analysis of the zircons. The results are given in Table 5 and plotted in Figure 8. The gabbro samples are characterized by highly variable zircon Hf isotopic compositions, with εHf(t) values ranging from negative to positive, and spread over a total range of 10.7–16.4 εHf units (specifically, −4.6 to +6.1 and −4.8 to +11.6 for the QZ and HC gabbros, respectively; Table 5 and Fig. 8). In contrast, the granite samples have relatively steady εHf(t) values (−1.9 to +1.8; Fig. 8), corresponding to younger two-stage Hf model ages (TDM2) of 1.05 to 1.28 Ga (Table 5) relative to basement rocks in eastern Cathaysia (for which the mean TDM2 model ages show a peak at around 1.4 Ga; Xu et al. Reference Xu, O'Reilly, Griffin, Wang, Pearson and He2007).
Hf isotopic compositions of zircons from representative samples of the QZ and HC gabbro–granite complexes
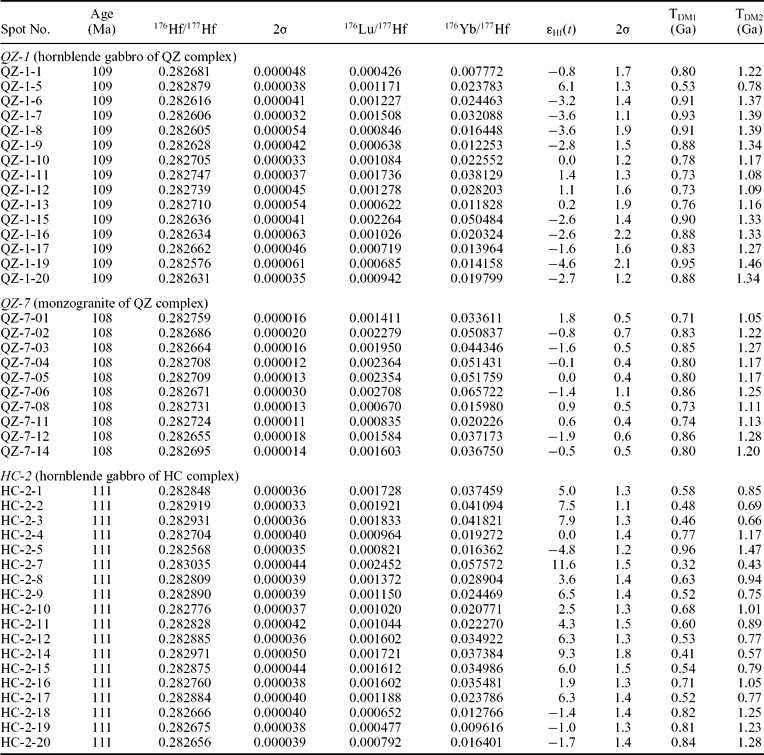
Note: For the calculation of εHf(t) values, we have adopted the 176Lu decay constant of 1.865 × 10⁻¹¹ (Scherer, Munker & Mezger, 2001), the present-day chondritic values of 176Lu/177Hf = 0.0332 and 176Hf/177Hf = 0.282772 (Blichert-Toft & Albarède, Reference Blichert-Toft and Albarède1997). To calculate one-stage model ages (TDM1) relative to a depleted-mantle source, we have adopted the present-day depleted-mantle values of 176Lu/177Hf = 0.0384 and 176Hf/177Hf = 0.28325 (Vervoort & Blichert-Tolf, 1999). To calculate two-stage modal ages (TDM2), we have adopted an assumed176Lu/177Hf ratio of 0.015 for the average continental crust (Griffin Reference Griffin, Pearson, Belousova, Jackson, Achterbergh, O'Reilly and Sheeet al. 2000).
Correlations between Hf isotopic compositions and U–Pb ages of zircons from representative samples of the QZ and HC gabbro–granite complexes on the southeast coast of Fujian. 2σ error bars for εHf(t) are indicated.

5. Age of the QZ and HC gabbro–granite complexes
Age data are critical for deciphering the origin and tectonic significance of the gabbro–granite complexes in the Fujian coastal region. A single-grain zircon U–Pb age from the QZ gabbros suggests crystallization at 106.5 ± 0.2 Ma (concordant age; Li et al. Reference Li, Dong, Xu and Zhou1995); however, the ages of coexisting QZ granites are poorly constrained, and the temporal relationships between the QZ gabbros and granites remain unclear. Previous geochronological data for the HC complex include a hornblende 40Ar–39Ar plateau age of 129.62 ± 0.15 Ma for the gabbros, and a whole-rock–mineral Rb–Sr isochron age of 109.4 ± 1.7 Ma for the granites (Zhou & Chen, Reference Zhou and Chen2001). These results seem to indicate that the spatially associated gabbroic and granitic intrusions in the HC complexes are not linked temporally.
For the present study, we obtained precise LA-ICP-MS U–Pb dates for zircons from the gabbroic and granitic intrusions of the QZ and HC complexes. The new data demonstrate that the QZ gabbros and granites crystallized at 109 ± 1 Ma and 108 ± 1 Ma, respectively. A slightly earlier crystallization age of 111 ± 1 Ma has been obtained for a HC hornblende gabbro, which is consistent with the 109.4 ± 1.7 Ma date for granite in the HC complex (Zhou & Chen, Reference Zhou and Chen2001). We now know, therefore, that the gabbroic and granitic intrusions of the QZ and HC complexes coexist both spatially and temporally, and that they were all generated during an Early Cretaceous period of magmatism.
6. Petrogenesis
6.a. Insights into a depleted mantle source region
As mentioned above, a typical feature of the isotopic composition of the QZ and HC granitic rocks is that they show high εNd(t) values of −2.5 (QZ) and −4.1 (HC) (Table 4 and Fig. 7a), and their two-staged Nd model ages (1.11 Ga and 1.24 Ga, respectively; Table 4) are significantly younger than those of the basement metamorphic rocks in the Cathaysia Block (1.8 to 2.2 Ga; Chen et al. Reference Chen, Guo, Tang and Zhou1999). In a t–εNd(t) diagram, all the granite samples plot above the evolutionary trend defined by the Proterozoic crust of the SCB and near the CHUR reference line (Fig. 7a). It is clear, therefore, that a significant amount of mantle material was involved in the genesis of the granites studied. The zircon Hf isotopic compositions also favour such a conclusion. Zircons in QZ granite have neutral εHf(t) values (−1.9 to +1.8; Fig. 8), corresponding to younger two-stage Hf model ages (TDM2) of 1.05 to 1.28 Ga (Table 5) compared with basement rocks in eastern Cathaysia (for which the mean TDM2 model ages show a peak at around 1.4 Ga; Xu et al. Reference Xu, O'Reilly, Griffin, Wang, Pearson and He2007), which supports the proposition that mantle-derived components were involved in the generation of the granites studied.
Other Late Mesozoic granitic rocks, which are widely distributed along the coastal region of South China, also have high εNd(t) values (−6.8 to −1.5 for I-types, and −6.3 to −2.5 for A-types; Huang et al. Reference Huang, Sun, De Paolo and Wu1986; Jahn, Zhou & Li, Reference Jahn, Zhou and Li1990; Martin et al. Reference Martin, Bonin, Capdevila, Jahn, Lameyre and Wang1994; Dong et al. Reference Dong, Zhou, Li, Ren and Zhou1997; Qiu, Wang & McInnes, Reference Qiu, Wang and McInnes1999; Qiu et al. Reference Qiu, Wang, McInnes, Jiang, Wang and Kanisawa2004, Reference Qiu, Xiao, Hu, Xu, Jiang and Li2008), implying the involvement of mantle material during their petrogenesis. However, the nature and origin of the mantle source have remained uncertain. The Cretaceous gabbros along the coastal area of Fujian province are thought to represent the mafic end-members of the calc-alkaline series that includes the widespread granites (Zhou et al. Reference Zhou, Xu, Dong and Li1994; Li et al. Reference Li, Dong, Xu and Zhou1995), and they therefore provide an excellent opportunity to investigate the nature of the mantle source.
The QZ and HC gabbros share similar geochemical and isotopic characteristics with other Cretaceous gabbros in the coastal region of Fujian. They are rich in LREEs and LILEs, yet relatively depleted in HFSEs (e.g. Nb, Ta), and they have moderately enriched Sr–Nd isotopic signatures (Table 4 and Fig. 7). The previous consensus among geochemists and petrologists was that these gabbroic rocks were derived by the partial melting of an enriched mantle source (Xu et al. Reference Xu, Dong, Li and Zhou1999; Yang et al. Reference Yang, Shen, Tao and Shen1999; Zhou & Chen, Reference Zhou and Chen2001; Zhao, Hu & Liu, Reference Zhao, Hu and Liu2004; Dong et al. Reference Dong, Zhang, Xu, Yan and Zhu2006; Zhao et al. Reference Zhao, Hu, Zhou and Liu2007). However, the effect of crustal contamination during the evolution of the gabbros was overlooked. The parental mantle-derived magmas may have been affected by crustal contamination during their ascent, and/or during temporary residence in magma chambers within the continental crust (Wang et al. Reference Wang, Zhou, Qiu, Jiang and Shi2008). Either way, the result of such contamination would be to obscure the primary whole-rock elemental and isotopic signatures of the magmas.
As a ubiquitous refractory accessory mineral, and being robust in most geological environments, zircon is extremely resistant to overprinting geological processes (Yang et al. Reference Yang, Wu, Wilde, Xie, Yang and Liu2007 and references therein). In addition to its advantage of being datable by the U–Pb method, zircon also has high Hf concentrations (average ~ 10000 ppm; Samson et al. Reference Samson, Inglis, D'Lemos, Admou, Blichert-Toft and Hefferan2004) and low Lu/Hf ratios (typically ~ 0.002; Kinny & Mass, Reference Kinny, Mass, Hanchar and Hoskin2003), which means the measured 176Hf/177Hf ratio for zircon is essentially the initial ratio, because in situ time-integrated changes in 176Hf/177Hf are negligible. Consequently, zircons generally retain a faithful memory of the Hf isotopic signature of the magmas from which they crystallized, and their Hf isotopic compositions act as sensitive tracers of crustal and mantle processes. In other words, in situ Hf isotopic data from igneous zircons are powerful petrogenetic indicators, and they can be used to gain insight into the nature of the Late Mesozoic mantle beneath the coastal area of Fujian. The use of zircons allows one to avoid the large ambiguities inherent in studies of radiogenic isotopes (e.g. Sr–Nd isotopes) and whole-rock elements (Griffin et al. Reference Griffin, Wang, Jackson, Pearson, O'Reilly, Xu and Zhou2002; Belousova, Griffin & O'Reilly, Reference Belousova, Griffin and O'Reilly2006; Kemp & Hawkesworth, Reference Kemp and Hawkesworth2006; Andersen, Griffin & Sylvester, Reference Andersen, Griffin and Sylvester2007; Yang et al. Reference Yang, Wu, Wilde, Xie, Yang and Liu2007).
Zircons with relatively high εHf(t) values are commonly observed in the QZ and HC gabbros (up to +6.1 and +11.6 for the QZ and HC gabbros, respectively; Table 5 and Fig. 8), and provide crucial evidence of an extensive contribution from a depleted mantle source in their parental basic magmas. A series of similar-aged Cretaceous granitoids along the coastal area of Fujian (including the coexisting granites in the QZ complex), which have generally been identified as involving mantle material in their genesis, show similar zircon Hf isotopic signatures, with zircon εHf(t) values of up to +7.1 (Pingtan granite, which yields a crystallization age of 125 Ma; Griffin et al. Reference Griffin, Wang, Jackson, Pearson, O'Reilly, Xu and Zhou2002), +1.9 (QZ monzogranite, which yields a crystallization age of 108 Ma; this study) and +10.2 (Zhangpu alkali-feldspar granite, which yields a crystallization age of 101 Ma; authors’ unpub. data). These data indicate the existence of a depleted mantle source region, related to the widespread Late Yanshanian magmatism, beneath the coastal area of Fujian. Moreover, Zhou et al. (Reference Zhou, Jiang, Wang, Yang and Zhang2006a), on the basis of Re–Os and Sm–Nd isotopic and trace element geochemistry of representative basalts and hornblende gabbros, suggested that Early Cretaceous basaltic magmas along the southeastern coast of China might be derived from a depleted rather than an enriched mantle source.
6.b. Evolution of the QZ and HC gabbros: the role of crustal contamination
The above results lead us to conclude that the parental basic magmas of the QZ and HC gabbros were derived from a depleted mantle source; however, their somewhat enriched Sr–Nd isotopic compositions need to be explained. In a diagram of initial 87Sr/86Sr v. 143Nd/144Nd, all the gabbro samples plot in a field close to an enriched mantle (EM-1 mantle), but far from the depleted mantle (DM) field (Fig. 7b). In contrast, the zircon Hf isotopic compositions of the QZ and HC gabbros are highly variable, with εHf(t) values spreading from negative to positive over a total range of 10.7–16.4 εHf units (specifically, −4.6 to +6.1 and −4.8 to +11.6 for the QZ and HC gabbros, respectively; Table 5 and Fig. 8). The existence of zircons with relatively low εHf(t) values in mafic rocks indicates an origin from an enriched mantle source or, as we prefer, crustal contamination of the source magma (Griffin et al. Reference Griffin, Pearson, Belousova, Jackson, Achterbergh, O'Reilly and Shee2000; Xu et al. Reference Xu, O'Reilly, Griffin, Wang, Pearson and He2007).
As is usually the case for mantle-derived magmas erupted in a continental setting, crustal components may play an important role, mainly via crustal contamination, during the evolution of the gabbros studied (Iizumi, Imaoka & Kagami, Reference Iizumi, Imaoka and Kagami2000; Wang, Reference Wang2002; Renna, Tribuzio & Tiepolo, Reference Renna, Tribuzio and Tiepolo2006, Reference Renna, Tribuzio and Tiepolo2007). On a primitive mantle-normalized multi-element diagram, as proposed by Hofmann (Reference Hofmann1997) (Fig. 9), the average QZ and HC gabbros show similar patterns to those of continental crust (CC), and differ significantly from the expected EM-1 mantle-derived melts, as suggested by their whole-rock Sr–Nd isotopic compositions (Fig. 7). Compared with a series of possible mantle reservoirs, such as PM, N-MORB, HIMU–OIB, EM-1–OIB and EM-2–OIB, these gabbros usually show higher incompatible element ratios, which are comparable to those of continental crust (Table 6). These observations suggest that crustal components contributed to the evolution of the QZ and HC gabbroic magmas via crustal contamination.
Comparison of the average QZ and HC gabbros with average continental crust (cont. crust), EM-1 (from Tristan ocean island), mid-ocean ridge basalts (MORB), HIMU (from Tubuai island) and Hawaii tholeiite on primitive mantle-normalized multi-element diagram (after Hofmann, Reference Hofmann1997).

Incompatible element ratios of gabbros in the QZ and HC complexes and comparison with those of the other geochemical reservoirs
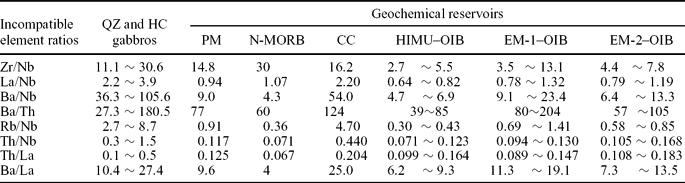
Note: PM – primitive mantle; CC – continental crust; the data for various geochemical reservoirs is from Weaver (Reference Weaver1991)
Several lines of evidence, from elemental and isotopic geochemistry, suggest a close genetic relationship between the gabbroic and granitic rocks in the QZ and HC complexes. Geochemically, the gabbros and granites display similar patterns in the chondrite-normalized REE and primitive mantle-normalized trace element diagrams, with relatively small ranges in abundance levels (Fig. 6). They generally display homogeneous Rb–Sr and especially Sm–Nd isotopic compositions (Fig. 7). In addition, in both complexes, the crystallization ages for the gabbros are in good agreement with those for the granites. Altogether, the geological evidence and isotopic data indicate a genetic relationship between the gabbros and granites in the QZ and HC bimodal complexes.
With reference to models for the gabbro–granite association of Ota (Corsica–Sardinia batholith; Renna, Tribuzio & Tiepolo, Reference Renna, Tribuzio and Tiepolo2006) and the gabbro–granite complex of Porto (Western Corsica; Renna, Tribuzio & Tiepolo, Reference Renna, Tribuzio and Tiepolo2007), where the evolution of gabbros has been interpreted in terms of crustal contamination by acid melts, giving rise to their associated granites, we speculate, similarly, that the parental magmas of the QZ and HC gabbros experienced a significant crustal contamination, mainly by the felsic melts that gave rise to the associated granitoids. Such crustal contamination brought about the somewhat enriched Sr–Nd isotopic compositions of the QZ and HC gabbros, as well as their similarities in both trace element and Sr–Nd isotopic signatures to the associated granitoids, by rapid chemical and isotopic diffusion/exchange. Owing to the higher closure temperature for the Lu–Hf isotopic system, and the relatively early crystallization of zircons during magma evolution, the Hf isotopic system in zircons from gabbros should record the initial isotopic signatures of their primary mafic magmas, and preserve the details of isotopic variations during the process of crustal contamination, thus making their highly variable zircon Hf isotopic compositions distinctly different from the steady compositions in the associated granitoids.
In addition, two sensitive indexes of crustal contamination, namely Ta/U and Ce/Pb ratios (Hofmann, Reference Hofmann1988) (Table 3), suggest that these mafic magmas were affected by the further addition of crustal components during their ascent. The Ta/U and Ce/Pb ratios in the QZ and HC gabbros are 0.3–1.9 and 2.3–6.8, respectively. They are not only much lower than the ratios in MORB and OIB (Ta/U ≈ 2.7 and Ce/Pb ≈ 25; Hofmann, Reference Hofmann1988), but the ratios for some samples are lower than those in the crust (Ta/U = 1.1 and Ce/Pb = 4.1; Taylor & McLennan, Reference Taylor and McLennan1995). The contamination of magmas during their ascent by upper-crustal sedimentary or metamorphic rocks is a plausible explanation of this result, as the upper continental crust possesses low ratios of Ta/U and Ce/Pb (0.2 and 3.2, respectively; Taylor & McLennan, Reference Taylor and McLennan1995). The absence of xenoliths or enclaves in the gabbros of the present study seems to be inconsistent with such a speculation, but slow ascent and storage in crustal reservoirs would facilitate chemical interaction between crust and magma, allowing the entrained xenoliths or enclaves to settle out or be disaggregated (Glazner & Farmer, Reference Glazner and Farmer1992). Such a process constitutes the so-called ‘cryptic crustal contamination’. The appearance of zircons with much lower εHf(t) values (as low as −4.6 in QZ gabbros) than in the coexisting QZ granites (lowest values of −1.9) is also consistent with such a process. Accordingly, the process of cryptic crustal contamination during the ascent of the mafic magmas cannot be ruled out when considering the genesis of the QZ and HC gabbros.
In summary, the confusing elemental geochemistry, enriched whole-rock Sr–Nd isotopic signatures and highly variable zircon Hf isotopic compositions of the QZ and HC gabbros can be explained by crustal contamination, mainly by the felsic melts that gave rise to the associated granitoids. However, it is also possible that upper-crustal material was added during magma ascent.
6.c. Inferences regarding the generation of the QZ and HC granitoids
It has been established that a significant amount of mantle material was involved in the genesis of the granites studied. From a broader perspective, both the acidic and basic magmas in the QZ and HC complexes were associated with a depleted mantle source. Given their close genetic relationship, several different models are employed to explain the formation of QZ and HC granitoids, including fractional crystallization, magma mixing, and, as we prefer, partial melting of juvenile basaltic crust.
The possibility that the granites fractionated from crystallizing gabbroic magmas was at first precluded, although it is indeed consistent with the similar ages and isotopic compositions of the two rock types. In the QZ and HC complexes, the much smaller amount of gabbros compared with granites (Fig. 1) (the gabbros are volumetrically inferior to the granites although their relative proportions at the surface may not be representative of their volumes), and the absence of intermediate rocks in the two complexes, are in conflict with the fractional crystallization model.
Alternatively, magma mixing may explain well the similar ages and Sr–Nd isotopic compositions of the two rock types, and agrees with the highly variable zircon Hf isotopic compositions in gabbros. Moreover, based on in situ Lu–Hf isotopic analysis of the zircons from some gabbro–granite complexes and/or granites with MMEs (mafic microgranular enclaves), some researchers recently emphasized that mixing between juvenile, mantle- and crust-derived magmas is an important factor in the development of those granites in relation to crust–mantle interactions (e.g. Griffin et al. Reference Griffin, Wang, Jackson, Pearson, O'Reilly, Xu and Zhou2002; Belousova, Griffin & O'Reilly, Reference Belousova, Griffin and O'Reilly2006; Andersen, Griffin & Sylvester, Reference Andersen, Griffin and Sylvester2007; Kemp et al. Reference Kemp, Hawkesworth, Foster, Paterson, Woodhead, Hergt, Gray and Whitehouse2007; Yang et al. Reference Yang, Wu, Wilde, Xie, Yang and Liu2007). These studies reported that zircons from these granites and/or MMEs generally have homogeneous U–Pb ages but highly variable Hf isotopic compositions, with εHf(t) values spreading from negative to positive, thus providing a clear indication of mixing between distinct (mafic and felsic) magmas. In particular, whole-rock elemental and isotopic geochemistry and detailed zircon Hf isotope evidence confirm that magma mixing occurred during the genesis of two Cretaceous I-type igneous complexes along the Changle–Nan'ao shear zone in the Fujian coastal region: the Pingtan gabbro–granodiorite–granite complex (115.2 ± 1.2 Ma; Dong et al. Reference Dong, Zhou, Li, Ren and Zhou1997) and the Daiqianshan gabbro–diorite–granite complex (95 ± 2 Ma; Wang, Reference Wang2002) (see Fig. 1a) (Xu et al. Reference Xu, Dong, Li and Zhou1999; Griffin et al. Reference Griffin, Wang, Jackson, Pearson, O'Reilly, Xu and Zhou2002; Wang et al. Reference Wang, Griffin, O'Reilly, Zhou, Xu, Jackson and Pearson2002). Magma mixing is also indicated by field evidence, such as mingling structures and mafic enclaves in granites (Dong et al. Reference Dong, Li, Chen, Xu and Zhou1998; Xu et al. Reference Xu, Dong, Li and Zhou1999; Griffin et al. Reference Griffin, Wang, Jackson, Pearson, O'Reilly, Xu and Zhou2002).
However, it is difficult to decipher the petrogenesis of the QZ and HC complexes, especially the granitic rocks, solely in terms of magma mixing, as indicated by the following three points. First, any intermediate rocks that might represent mixed magmas are absent; second, there exists no field evidence for magma mixing/mingling, given the absence of mingling structures and mafic enclaves in granites of the QZ and HC complexes; and third, the zircon εHf(t) values of QZ granite (−1.9 to +1.8; Fig. 8) show little variation. These findings preclude the possibility of magma mixing during the generation of the QZ and HC granites.
In contrast, the partial melting of basaltic lower crust is thought to be a major process in the generation of silicic rocks, especially for those generated in subduction zones and arcs (e.g. Tulloch & Kimbrough, Reference Tulloch, Kimbrough, Johnson, Paterson, Fletcher, Girty, Kimbrough and Martín-Barajas2003; Leat, Larter & Millar, Reference Leat, Larter and Millar2007). On the basis of the geological, geochemical and geophysical data of Upper Mesozoic igneous rocks in SE China, Zhou & Li (Reference Li2000) advocated that voluminous felsic magmas in the SCB were generated by the partial melting of crust, and later proposed an improved model for the petrogenesis of Mesozoic granitoids and volcanic rocks in South China, further emphasizing deep crustal melting as a principal driving mechanism for the Yanshanian granitic magmatism in South China (Zhou et al. Reference Zhou, Sun, Shen, Shu and Niu2006b). Consequently, preference is given to the inference that the granites in the QZ and HC complexes were derived from partial melting of basaltic lower crust, as also reported for gabbro–granite complexes at Ota (Corsica–Sardinia batholith; Renna, Tribuzio & Tiepolo, Reference Renna, Tribuzio and Tiepolo2006) and Porto (Western Corsica; Renna, Tribuzio & Tiepolo, Reference Renna, Tribuzio and Tiepolo2007).
Considering their relatively high whole-rock εNd(t) values (−2.5 and −4.1 for the QZ and HC granites, respectively), and their homogeneous and neutral zircon εHf(t) values (−1.9 to +1.8 for the QZ granite), we further contend that the aforementioned basaltic lower crust should be a juvenile one, most probably from a depleted mantle reservoir, or a mixed lithology formed by pre-existing lower crust underplated by mantle-derived mafic magma. Such growth of juvenile crust related to a depleted mantle reservoir has been reported widely in Eastern China; e.g. NE China (mainly the eastern segment of the Xingmeng Orogenic Belt) (Wu et al. Reference Wu, Jahn, Wilde, Lo, Yui, Lin, Ge and Sun2003), the northern part of the Yangtze Block (Zhang et al. Reference Zhang, Zheng, Wu, Zhao, Gao and Wu2006), the eastern segment of the Jiangnan Orogen (Zheng et al. Reference Zheng, Wu, Wu, Zhang, Yuan and Wu2008) and southwestern Fujian (Li et al. Reference Li, Qiu, Jiang, Xu and Hu2009). Therefore, we invoke the mechanisms proposed for magmatism in the Cordilleran-type batholiths at a plate edge (Pitcher, Reference Pitcher1997, pp. 231–57) and for Phanerozoic crustal growth in Eastern China (Wu et al. Reference Wu, Jahn, Wilde, Lo, Yui, Lin, Ge and Sun2003), and summarize the steps involved in the generation of the QZ and HC granitoids as follows: (a) growth of juvenile basaltic lower crust, probably via underplating of depleted mantle-derived mafic melts; (b) re-melting of the underplated mafic crust via further underplating to generate more silicic magmas; (c) assimilation of pre-existing crust by mafic magmas to generate the range of zircon εHf(t) values; and (d) crystal fractionation and assimilation of pre-existing crust by the silicic partial melts to produce the observed granites.
7. Implications for the geological evolution of coastal areas in South China
As part of the Eurasia Plate, the SCB may have been affected by subduction of the Palaeo-Pacific Plate since Middle Jurassic time (Maruyama & Seno, Reference Maruyama and Seno1986; Maruyama et al. Reference Maruyama, Isozaki, Kimura and Terabayashi1997), which triggered the widespread magmatism in coastal areas of the SCB (e.g. Lapierre et al. Reference Lapierre, Jahn, Charvet and Yu1997; Xu et al. Reference Xu, Dong, Li and Zhou1999; Li, Reference Li2000; Zhou & Li, Reference Li2000; Zhou & Chen, Reference Zhou and Chen2001). The palaeo-suture zone is located approximately along the Median Tectonic Line (MTL) in Japan, extending southwest to the eastern flank of the Central Ranges in Taiwan (Fig. 10) (e.g. Zhou & Li, Reference Li2000; Shu & Xu, Reference Shu, Xu, Wang and Zhou2002). A series of Jurassic–Cretaceous accretionary prisms/complexes have been identified along the MTL; e.g. the Sambagawa metamorphic belt of central Shikoku in southwest Japan (Takasu & Dallmeyer, Reference Takasu and Dallmeyer1990; Takasu et al. Reference Takasu, Wallis, Banno and Dallmeyer1994), and a subduction–accretion complex in the Mino–Tanba belt of southwest Japan (Matsuda & Isozaki, Reference Matsuda and Isozaki1991). In addition, many Cretaceous fore-arc basins have been reported from northeast to southwest Japan (e.g. Okada & Sakai, Reference Okada and Sakai1993; Ando, Reference Ando2003; Takashima et al. Reference Takashima, Kawabe, Nishi, Moriya, Wani and Ando2004).
Schematic diagram showing the location of the palaeo-suture zone in Late Mesozoic subduction of the Palaeo-Pacific Plate beneath the Eurasian continent.

In contrast, coeval fore-arc or accretionary prism units are rarely found in Taiwan, perhaps because they have been eroded away or overprinted by Cenozoic arc–continent collision with the Philippine Sea Plate (Ho, Reference Ho1986; Fuh et al. Reference Fuh, Liu, Lundberg and Reed1997; Chang et al. Reference Chang, Angelier, Huang and Liu2001; Malavieille & Trullenque, Reference Malavieille and Trullenque2009) and by eastward subduction of oceanic crust of the South China Sea since Early Miocene time (e.g. Huang et al. Reference Huang, Wu, Chang, Tsao, Yuan, Lin and Kuan-Yuan1997). However, blueschists and ophiolite complexes are found in the Yuli belt of the Tananao Basement Complex on the eastern flank of the Central Ranges of Taiwan (Zhou & Li, Reference Zhou and Li2000). For these rocks, amphibole and omphacite separated from glaucophane schists and omphacite-bearing rocks yield 40Ar–39Ar ages of 110–100 Ma (Lo & Yui, Reference Lo and Yui1996). These low-grade metamorphic rocks and some 92–79 Ma granites (Jahn et al. Reference Jahn, Martineau, Peucat and Cornichet1986; Lan, Lee & Wang, Reference Lan, Lee and Wang1990; Lan et al. Reference Lan, Lee, Jahn and Yui1995) in the western part of the Yuli belt constitute a low-pressure, high-temperature metamorphic belt, namely the Tailuge belt (Zhou & Li, Reference Zhou and Li2000). Moreover, the sedimentary environment of the original rocks of the Yuli belt was mainly a trench setting (Biq, Reference Biq1971). Taken together, these subduction zone elements indicate Late Mesozoic subduction of the Palaeo-Pacific Plate beneath the Eurasian continent.
As mentioned in Section 2, plagioclases in the QZ and HC gabbros have high An contents, and may be nearly pure anorthite, which is generally regarded as an indicator of an active continental margin (Beard, Reference Beard1986; Zhou et al. Reference Zhou, Xu, Dong and Li1994). The most abundant mafic mineral in the gabbros is hornblende, and orthopyroxene is generally absent, similar to the ‘type III’ gabbros of Beard (Reference Beard1986), also implying an active continental margin. In addition, the QZ and HC gabbros are enriched in LILEs (e.g. Sr and K; Fig. 6c, d) and LREEs (Fig. 6a, b), and depleted in HFSEs (e.g. Nb and Ta; Fig. 6c, d), strongly suggesting a subduction zone origin/arc affinity (Pearce, Reference Pearce, Hawkesworth and Norry1983). Their high Al2O3 contents (Fig. 5) may also be indicative of subduction-modified magmas derived from mantle wedge peridotite (Hawkesworth et al. Reference Hawkesworth, Turner, Gallagher, Hunter, Bradshaw and Rogers1995). Furthermore, the hornblende-rich character of the QZ and HC gabbros is reminiscent of the high-level hornblende-rich mafic intrusions in the Mesozoic Sierra Nevada batholith (Sisson, Grove & Coleman, Reference Sisson, Grove and Coleman1996), indicating that the parental magma was rich in H2O and arguably derived from an arc-related source mantle (Wang, Reference Wang2002; Zhang et al. Reference Zhang, Zhang, Zhai, Wilde and Xie2009). Moreover, these gabbros coexist closely in space and time with granitoids and are typically bimodal, which is indicative of extensional magmatism.
On the other hand, the involvement of material from a depleted mantle source during the genesis of the QZ and HC intrusive rocks has been established. This gives cause to speculate about the upwelling of asthenospheric mantle in the coastal area of Fujian. Given the NNE–SSW-trending zone of magmatism in the study area (Fig. 1a), the zone of asthenospheric upwelling is expected to be linear. To gain further insight into the possible upwelling of the asthenospheric mantle, we plotted the data for the QZ and HC gabbros on a La/Yb v. Sm/Yb diagram (Fig. 11). The Sm/Yb ratio can be used to estimate the depth of melting, because it is insensitive to the effects of fractional crystallization (e.g. McKenzie & O'Nions, Reference McKenzie and O'Nions1991). On the La/Yb v. Sm/Yb diagram, our data mainly lie along the garnet-peridotite melting curve, but show a slight transitional trend towards the spinel-peridotite melting curve. This finding indicates that the primitive magma for these rocks originated in a garnet-bearing asthenospheric mantle source. The asthenosphere is unlikely to melt significantly on decompression unless it rises to depths of less than 50 km (Atherton & Ghani, Reference Atherton and Ghani2002). Geophysical data indicate that contours of lithospheric thickness beneath southeastern Fujian are characterized by oblate isolines with a NE–SW-trending long axis, parallel to the Mesozoic volcanic–plutonic belt in the Fujian coastal region, and the thinnest lithosphere is observed at a depth of ~ 45 km (Wang et al. Reference Wang, Chen, Cao, Pan and Wang1993). The geophysical data are consistent, therefore, with the idea of upwelling of the asthenosphere beneath the coastal area of Fujian.
Plot of La/Yb v. Sm/Yb for representative gabbroic samples from the QZ and HC gabbro–granite complexes on the southeast coast of Fujian. Also shown are batch melting curves for garnet-peridotite and spinel-peridotite, with partition coefficients from Johnson, Dick & Shimizu (Reference Johnson, Dick and Shimizu1990). The inverse modelling and detailed calculation procedures are given in Xu et al. (Reference Xu, Ma, Frey, Feigenson and Liu2005).

Zhou & Li (Reference Li2000) proposed a comprehensive model for the Mesozoic tectonomagmatic evolution of the SCB and reported a change in the subduction angle during Jurassic–Cretaceous magmatism (Fig. 12). If such a model is applicable, and taking the above-mentioned credible geological evidence into account, a plausible tectonomagmatic evolution for the study area might be summarized as follows: a low subduction angle was responsible for the development of a broad magmatic arc in SE China during the Middle Jurassic. Over time, the angle of subduction increased (from approximately 10° to 50°, or even steeper) (Fig. 12) (Zhou & Li, Reference Li2000); consequently, the subduction zone between the Palaeo-Pacific Plate and the SCB evolved from Chilean-type (low-angle) to Mariana-type (high-angle) (Uyeda, Reference Uyeda1983). Thus, a back-arc extensional regime, related to the Mariana-type subduction zone, began to prevail in the coastal area of Fujian during Cretaceous time, which in turn led to decompressive upwelling of the asthenospheric mantle, ultimately producing a linear NNE–SSW-trending belt of magmatism in the coastal area of Fujian (Fig. 1a).
Cartoon of previous tectonic model for Mesozoic tectonomagmatic evolution in the SCB showing changing subduction angles for Jurassic–Cretaceous magmatism (modified after Zhou & Li, Reference Li2000).
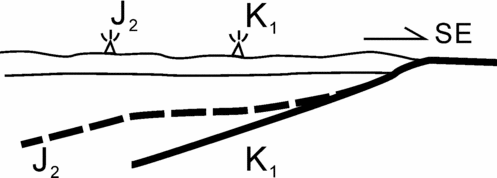
However, the proposal of a change in subduction angle as a contributing factor to Jurassic–Cretaceous magmatism in the coastal area of the SCB has recently been challenged (Li & Li, Reference Li and Li2007), as data indicate that the temporal–spatial distribution of magmatism in the SCB was not a simple coastward migration, as required by the model proposed by Zhou & Li (Reference Li2000).
A model of slab break-off and rollback is now preferred for the coastal area of Fujian, because a zone of asthenospheric upwelling would indeed be linear if it formed in association with and parallel to a subducting slab that rolled back to the east.
The slab break-off model was first proposed by Davies & von Blackenburgh (Reference Davies and Von Blanckenburg1995) to explain magmatism and deformation related to collisional orogens in the Alps, the Aegean and the Dabie Shan. The model was subsequently applied to various ancient and modern orogens, including the Himalayas (Maheo, Rolland & Guillot, Reference Maheo, Rolland and Guillot2001; Kohn & Parkinson, Reference Kohn and Parkinson2002), the Andes (Haschke & Scheuber, Reference Haschke and Scheuber2002), New Guinea (Cloos et al. Reference Cloos, Sapiie, Van Ufford, Weiland, Warren and McMahon2005) and Turkey (Altunkaynak, Reference Altunkaynak2007). Based on a flat-slab subduction model for the formation of an intracontinental orogen and a post-orogenic magmatic province in Mesozoic South China, Li & Li (Reference Li and Li2007) and Li et al. (Reference Li, Li, Li, Liu, Yuan, Wei and Qi2007) employed the slab break-off and rollback mechanism in explaining the development of Jurassic magmatism in the SCB. Tulloch et al. (Reference Tulloch, Ramezani, Kimbrough, Faure and Allibone2009, Reference Tulloch, Ireland, Kimbrough, Griffin and Ramezani2011) also considered that break-off or rollback in subduction systems enables the rapid rise of asthenospheric mantle, which in turn induces extension of the overlying continental lithosphere, enabling interaction between asthenospheric mantle magmas and the basaltic underplate.
Based on the above considerations, a preliminary model of the Late Mesozoic tectonomagmatic evolution of the SCB is proposed as follows. (a) Since Middle Jurassic time, the Palaeo-Pacific Plate was subducted beneath the Chinese Mainland, approximately along the MTL in Japan and extending southwest to the eastern flank of the Central Ranges in Taiwan. (b) Metamorphic phase changes resulted in an increase in the density of the subducted-slab, causing increased gravitational pull within the slab itself (Li & Li, Reference Li and Li2007; Li et al. Reference Li, Li, Li, Liu, Yuan, Wei and Qi2007). This force induced slab break-off, finally bringing about the foundering and rollback of the slab (subducted during Late Mesozoic time) in the SCB during Early Cretaceous time (Fig. 13). (c) The slab break-off and its rollback to the east caused a strong and rapid rise of asthenospheric mantle below the coastal area of the SCB, resulting in a linear zone of asthenospheric upwelling in the study area (Fig. 13b) (Tulloch et al. Reference Tulloch, Ramezani, Kimbrough, Faure and Allibone2009, Reference Tulloch, Ireland, Kimbrough, Griffin and Ramezani2011). (d) The decompressive melting of upwelling asthenospheric mantle provided a depleted mantle source for the primary magmas of the basic intrusives, and led to the growth of juvenile basaltic lower crust. The continued upwelling of asthenospheric mantle then afforded sufficient energy, through heat conduction, for partial melting of the basaltic lower crust, which finally generated the felsic rocks of the study area. (e) Dehydration and partial melting of the down-dragged oceanic crust yielded voluminous H2O-rich fluid (Fig. 13b) that played a significant role during magmatism by promoting the melting of upwelling asthenospheric mantle; it also resulted in the depletion of HFSE (Nb and to a lesser degree Ta; Figs 6c, d, 9) in the QZ and HC complexes. However, the influence of such fluids on metasomatism of the upwelling asthenospheric mantle may have been limited because of the extensive contribution from a depleted mantle source in the QZ and HC complexes. (f) Finally, the rapid rise of asthenospheric mantle, due to slab break-off and rollback, in turn invoked extension of the overlying continental lithosphere, which is consistent with the bimodal nature of Early Cretaceous magmatism along the coastal area of the SCB (Xu et al. Reference Xu, Dong, Li and Zhou1999), and with the subsequent production of A-type granites (e.g. Qiu, Wang & McInnes, Reference Qiu, Wang and McInnes1999) and the development of a series of fault-bounded basins (Zhou et al. Reference Zhou, Sun, Shen, Shu and Niu2006b) during Late Cretaceous time.
Cartoons showing the sequence of events for slab break-off and rollback during the Late Mesozoic subduction of the Palaeo-Pacific Plate beneath the Eurasian continent (modified after Li & Li, Reference Li and Li2007; Li et al. Reference Li, Li, Li, Liu, Yuan, Wei and Qi2007).

Several points remain obscure. For example, the timing of slab break-off, foundering and rollback are poorly constrained. We can only speculate that these events occurred during Early Cretaceous time, mainly with reference to the geochronology of coeval fore-arc and accretionary prism units in the MTL of Japan. Taking into account the oldest Cretaceous basic–acidic complex in Fujian (the Pingtan gabbro–granodiorite–granite complex; 115.2 ± 1.2 Ma; Dong et al. Reference Dong, Zhou, Li, Ren and Zhou1997), we consider that slab rollback may have been initiated no later than 115 Ma. Moreover, the exact location of slab break-off remains uncertain, although we speculate that it may lie somewhere along the Changle–Nan'ao Fault. Accordingly, further work is necessary to investigate in detail the Late Mesozoic tectonomagmatic evolution of the SCB and to further refine the preliminary model proposed in this study.
8. Conclusions
LA-ICP-MS zircon U–Pb dating and geochemical and isotopic analyses have allowed us to characterize two well-developed Early Cretaceous bimodal gabbro–granite complexes: the Quanzhou (QZ) complex (108–109 Ma) and the Huacuo (HC) complex (109–111 Ma). The gabbroic and granitic intrusions in these complexes are temporally and spatially related, indicating a close genetic relationship.
Geochemical and isotopic data for the QZ and HC complexes indicate that the source responsible for the large-scale Late Yanshanian magmatism along the coastal areas of Fujian was depleted mantle, and not enriched mantle as proposed previously. The elemental and isotopic compositions of the QZ and HC gabbros have been strongly modified and complicated by crustal contamination, mainly by felsic melts that gave rise to the associated granitoids, but possibly also by upper-crustal sedimentary or metamorphic rocks during ascent of the magma. The components from such a depleted mantle source led to the growth of juvenile basaltic lower crust, the partial melting of which generated the parental felsic magmas of the QZ and HC complexes.
Break-off and rollback of the Late Mesozoic subducted Palaeo-Pacific Plate led to the strong and rapid rise of asthenospheric mantle below the coastal area of the SCB, resulting in a linear zone of asthenospheric upwelling that in turn induced extension of the overlying continental lithosphere. These events along the coastal area of the SCB resulted in a series of gabbro–granite complexes, voluminous felsic magmas related to crust–mantle interactions in Early Cretaceous time, and subsequent A-type granites and fault-bounded basins in Late Cretaceous time.
Acknowledgements
This study was financially supported by NSF of China Grant (40730313) and research grant (2008-II-01) from the State Key Laboratory for Mineral Deposits Research. We appreciate the thoughtful reviews provided by Andy Tulloch and an anonymous reviewer, and the helpful editorial advice of Dr Phil Leat. Their constructive and stimulating comments helped to significantly improve the manuscript. The study benefited from discussion with Dr J. Hu, G. Zeng and Prof. J. H. Yu, and the assistance of the Western Geological Party of Fujian Province in the fieldwork and sample collection. We thank M. N. Dai and C. L. Zong for their assistance with zircon Hf isotopic analysis. Thanks are also due to Dr Z. C. Huang for his assistance with draughting.



