

I. INTRODUCTION
L12-ordered intermetallic γ′ precipitates embedded in a disordered fcc γ matrix impart excellent mechanical properties to nickel-base superalloys. Reference Reed1 However, γ′ precipitates undergo disordering and dissolution under irradiation, thereby degrading the mechanical properties of these alloys. A great deal of experimental Reference Nelson, Hudson and Mazey2–Reference Sun, Hatter, Pollock, Wang, Anderoglu, Valdez, Uberuaga, DIckson and Maloy11 and theoretical Reference Martin12–Reference Ye, Li, Averback, Zuo and Bellon18 effort has been devoted to study the stability of the γ/γ′ microstructure in these superalloys under irradiation. Moreover, several atomic-scale modeling studies have been carried out to elucidate the mechanisms of disordering in Ni3Al, Reference Diaz de la Rubia, Caro and Spaczér19–Reference Skirlo and Demkowicz30 which is a common γ′ precipitate composition in Ni-base alloys. These mechanisms operate over picosecond-scale times, making them difficult to investigate experimentally. Nevertheless, atomic-level simulations of the disordering and dissolution processes of a γ′ precipitate in a γ matrix under high-dose irradiation have not been conducted before. Such simulations are a means to connect the well-known microscopic-level mechanisms governing γ′ behavior under irradiation to macroscale disordering and dissolution rates.
The aim of this study is to present an atomistic model that provides an accurate prediction of radiation-induced disordering and dissolution of γ′ precipitates in a γ matrix. Following Zhang and Demkowicz, Reference Zhang and Demkowicz31 we use classical potential molecular dynamics (MD) to model high-dose irradiation by sequentially simulating multiple collision cascades at a coherent interface of a γ′ precipitate in a γ matrix. This approach models collision cascade-induced effects, but not thermally activated recovery. Thus, we compare our simulations to experiments carried out at room temperature, where the effect of thermally activated recovery processes is negligible. The evolution of the chemical order and dissolution of the γ′ precipitate are quantified in terms of the disordering efficiency and the Averback–Peak mixing parameter. Reference Averback, Peak and Thompson32 We validate the simulation by comparing these values with experimental data available in the literature. Reference Bourdeau, Camus, Abromeit and Wollenberger5–Reference Schmitz, Ewert, Harbsmeier, Uhrmacher and Haider8,Reference Sun, Hatter, Pollock, Wang, Anderoglu, Valdez, Uberuaga, DIckson and Maloy11,Reference Müller33,Reference de Almeida, Schäublin, Almazouzi, Victoria and Döbeli34 The disordering and dissolution rates predicted by atomistic simulations lie within the range of reported experimentally determined values.
II. SIMULATION METHOD
Several Ni-base superalloys contain cuboidal Ni3Al γ′ precipitates in a Ni-rich γ matrix. Reference Ardell and Nicholson35–Reference Ardell37 We investigate a flat, coherent (100) facet of such precipitates in a bilayer model containing pure Ni (γ) and the stoichiometric Ni3Al compound (γ′). The bilayer is constructed in a cubic simulation cell with edge length ∼107 Å containing 108,000 atoms (30 × 30 × 30 cubic unit cells). Periodic boundary conditions (PBCs) are applied in all directions. Initially, equal parts of the simulation cell are filled with fcc Ni atoms and the L12-Ni3Al intermetallic. Because of the PBCs, the model contains two Ni/Ni3Al interfaces. The size of the simulation cell is selected to be sufficiently large so that collision cascades initiated by primary knock-on atoms (PKAs) with the recoil energy chosen for this study (10 keV) do not interact with their periodic images.
We adopt an embedded atom method (EAM) Reference Daw and Baskes38,Reference Daw and Baskes39 interatomic potential developed by Mishin for the γ and γ′ phases of the Ni–Al system Reference Mishin40 and subsequently modified by Skirlo and Demkowicz Reference Skirlo and Demkowicz30 to include the repulsive short-range interaction due to Ziegler et al. Reference Ziegler, Biersack and Littmark41 Although there has been a more recent EAM potential developed for the Ni–Al system, Reference Purja Pun and Mishin42 it has been confirmed that this potential has nearly no miscibility gap between the γ and γ′ phases Reference Schwen and Caro43 and is therefore unsuitable for the present study. The structure of the model is equilibrated at 300 K and zero pressure using the Anderson barostat and the Nosé–Hoover thermostat Reference Allen and Tildesley44 prior to initiating collision cascade simulations.
In the present work, we adopt the computational strategy developed by Zhang and Demkowicz in their study on radiation-induced mixing between low-solubility metals. Reference Zhang and Demkowicz31 In this approach, we investigate high-dose microstructure evolution by modeling a sequence of many collision cascades. A single cascade is initiated by introducing a PKA with kinetic energy representative of subcascade energies that give rise to thermal spikes in Ni–Al alloys. For example, in Ni–Al alloys irradiated with 700 keV–6 MeV nickel ions, subcascade energies of ∼10 keV are generated. Reference de Almeida45 We therefore conduct our simulations using 10 keV PKAs. The PKA and its velocity direction are selected randomly. The model is then evolved in time under constant energy and fixed volume for ∼20 ps. Time steps are dynamically adjusted during the simulation based on the atomic velocity and forces to ensure numerical accuracy.
As in previous atomistic simulations of collision cascades in crystalline metals, Reference Averback46–Reference Malerba50 PKAs in our model dissipate their kinetic energy through collisions with nearby atoms within a few tenths of a picosecond, forming molten regions several nanometers in diameter called thermal spikes (TSs). The TS subsequently cools down to near-ambient temperature and recrystallizes within the following 20 ps, leaving behind point defects and point defect clusters. At this stage, the temperature of the model is brought back to the initial ambient temperature (300 K) through a constant temperature MD simulation carried out using atomic velocity rescaling for about 10 ps.
This process is iterated approximately 3000 times in each simulation, giving a maximum dose of ∼3 displacements per atom (dpa). The number of PKAs is converted to dpa by means of the modified Kinchin-Pease formula Reference Norgett, Robinson and Torrens51 with a displacement threshold energy of 40 eV. Reference Gao and Bacon26,Reference Caro, Victoria and Averback52,Reference Zhu, Averback and Nastasi53 Because this simulation approach corresponds to extremely high fluxes and displacement rates (∼1027 m−2 s−1 and 107 dpa s−1 compared to ∼1017 m−2 s−1 and 10−3 dpa s−1 in implantation experiments), it should be interpreted as modeling only non-thermally activated processes, such as ballistic mixing and TSs, rather than thermally activated ones such as Fickian diffusion, mimicking either low temperature or ultra-high flux irradiations. To obtain good statistics, each simulation is repeated 20 times with a different initial thermal equilibrium state and random number generator seed. Simulations are performed using LAMMPS Reference Plimpton54 and the results are visualized using OVITO. Reference Stukowski55
We measure local chemical order using the Warren–Cowley short-range order (SRO) parameter at the second-nearest neighbor shell,
 $\alpha _{{\rm{NiAl}}}^{(2)}$
.
Reference Cowley56
This parameter is defined for any given Al atom as
 $$\alpha _{{\rm{NiAl}}}^{\left( 2 \right)} = 1 - {{p_{{\rm{NiAl}}}^{\left( 2 \right)}} \over {{m_{{\rm{Ni}}}}}}\quad {\rm{.}}$$
Here,
 $p_{{\rm{NiAl}}}^{\left( 2 \right)}$
is the probability of finding Ni atoms in the shell and m
Ni is the concentration of Ni atoms of the ordered alloy. For the case of the L12-ordered Ni3Al compound,
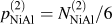 $p_{{\rm{NiAl}}}^{\left( 2 \right)} = {{N_{{\rm{NiAl}}}^{(2)} } /\mathord{\left {\vphantom {{N_{{\rm{NiAl}}}^{(2)} } 6}} \right. \kern-\nulldelimiterspace} 6}$
and m
Ni = 3/4, where
 $N_{{\rm{NiAl}}}^{(2)}$
is the number of Ni atoms in the shell. At this stoichiometry,
 $\alpha _{{\rm{NiAl}}}^{(2)}$
ranges from 0 to 1,with
 $\alpha _{{\rm{NiAl}}}^{(2)}$
= 0 denoting complete disorder (i.e., a random solid solution with
 $p_{{\rm{NiAl}}}^{\left( 2 \right)} = {m_{{\rm{Ni}}}}$
) while
 $\alpha _{{\rm{NiAl}}}^{(2)} = 1$
if all six second-nearest neighbors of the Al atom are other Al atoms (i.e.,
 $N_{{\rm{NiAl}}}^{(2)} = 0$
), as in the perfectly ordered L12-Ni3Al compound.
 $\alpha _{{\rm{NiAl}}}^{(2)}$
may also take on negative values if the Ni concentration is more than m
Ni = 3/4 in the second-nearest neighbor shell of the central Al atom.
To obtain a smooth profile of the SRO parameter as a function of position, z, perpendicular to the interfaces, we define a coarse-grained order parameter s(z) as
 $$s\left( z \right) = \mathop\sum\limits_{i = 1}^{{N_{{\rm{Al}}}}} {\alpha _{{\rm{NiAl}}}^{\left( 2 \right)i}} \exp {{\left( {{{ - {{\left( {z - {z_i}} \right)}^2}} \over {{B^2}}}} \right)} \mathord{\left/ {\vphantom {{\left( {{{ - {{\left( {z - {z_i}} \right)}^2}} \over {{B^2}}}} \right)} {\mathop \smallint \nolimits^ {\mathop{\rm d}\nolimits} z}}} \right. \kern-\nulldelimiterspace} {\mathop \smallint \nolimits \int{\mathop{\rm d}\nolimits} z}}\exp \left( { - {{{z^2}} \over {{B^2}}}} \right)\quad {\rm{.}}$$
Here, N
Al is the number of Al atoms in the system, z
i
is the z-coordinate of the i-th Al atom, and B is the characteristic coarse-graining length, which is chosen to be 3 Å in the present analysis. This approach is analogous to the way smoothed composition profiles were computed in Ref. Reference Zhang and Demkowicz31. We further define the average order parameter S by averaging
 $\alpha _{{\rm{NiAl}}}^{\left( 2 \right)}$
over all the Al atoms in the model.
We characterize the dissolution of the γ′ precipitates using the Averback–Peak mixing parameter. Reference Averback, Peak and Thompson32 The dependence of the mixing parameter on the incident ion energy is relatively weak, hence this parameter is a convenient measure for comparing intermixing efficiencies obtained from different experiments and simulations. Reference Bacon and Diaz de la Rubia57 The mixing parameter Q has dimensions of length5 times energy−1 and is defined as
 $$Q = {{{D^{{\rm{eff}}}}t} \over {\phi {F_D}}}\quad {\rm{,}}$$
where D eff is the effective interdiffusion coefficient, t is the irradiation time, φ is the incident particle fluence, and F D is the nuclear stopping power (energy lost per unit distance traveled due to collisions of the incident particle with target nuclei). In our analysis, we assume that D eff is independent of composition.
III. SIMULATION RESULTS
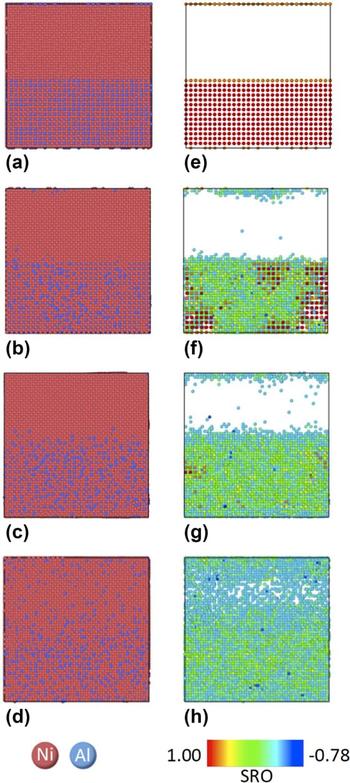
Figure 1 displays snapshots of the morphological evolution of the (100) Ni/Ni3Al bilayer at four selected doses: 0.0, 0.04, 0.2, and 2.0 dpa, corresponding to 0, 43, 216, and 2160 PKAs, respectively. Figures 1(a)–1(d) illustrate the dissolution process of the Ni3Al layer through intermixing of Ni (red) and Al (blue). Figures 1(e)–1(h) show only Al atoms colored by the SRO parameter [Eq. (1)]. Initially, the γ and γ′ layers form sharp interfaces [Fig. 1(a)], and the Al atoms inside the γ′ layer are characterized by perfect L12 order. The Al atoms at interfaces take on slightly lower values of the SRO parameter than in the bulk because of the lack of Al atoms in the γ layer [Fig. 1(e)].
Selected snapshots of the (100) Ni/Ni3Al bilayer as a function of dose obtained from the present study. (Left column) Atoms are colored by their type (red: Ni and blue: Al) at 0.0, 0.04, 0.2, and 2.0 dpa in (a), (b), (c), and (d), respectively. (Right column) Al atoms are colored according to their SRO parameter at 0.0, 0.04, 0.2, and 2.0 dpa in (e), (f), (g), and (h), respectively.

As the dose increases to 0.04 dpa, the γ′ phase accumulates copious antisite defects [Fig. 1(f)]. Meanwhile, the interfaces remain nearly atomically sharp due to the low levels of intermixing at this dose [Figs. 1(b) and 1(f)]. The L12 structure in the γ′ layer is in effect fully destroyed by 0.2 dpa [Fig. 1(g)]. However, the interfaces still maintain their relatively sharp profiles at this dose [Figs. 1(c) and 1(g)]. At doses of 2 dpa and above, the Ni and Al atoms undergo significant mixing and the interfaces become increasingly diffuse [Figs. 1(d) and 1(h)]. The composition of the entire model is completely homogenized at higher doses.
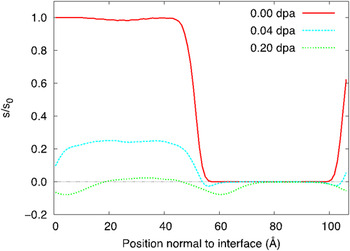
Figure 2 shows the coarse-grained order parameter s, as a function of distance perpendicular to the interface plane, normalized by its initial value in the γ′ layer, s 0. The horizontal axis in Fig. 2 corresponds to the vertical direction in the visualizations shown in Fig. 1. The normalized coarse-grained order parameter of the γ′ phase, which is initially perfectly ordered, is reduced to less than a quarter of its initial value by 0.04 dpa. The value of s/s 0 for Al atoms in the core of the γ′ layer approaches zero at 0.2 dpa while s/s 0 for atoms near interfaces becomes negative as the two layers interfuse.
Profile of the normalized coarse-grained order parameter s/s 0 plotted as a function of distance normal to Ni/Ni3Al interfaces obtained from the present study at 0.0, 0.04, and 0.2 dpa.

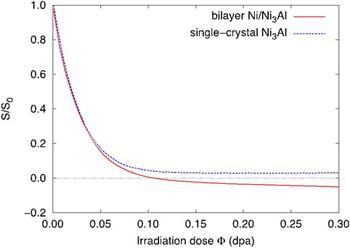
Figure 3 shows the average order parameter S normalized by its initial value S
0 plotted as a function of dose Φ up to 0.3 dpa for the Ni/Ni3Al bilayer. The value of S/S
0 decays to near zero at doses as low as ∼0.12 dpa. The negative asymptote of S/S
0 for the Ni/Ni3Al bilayer is attributed to the larger proportion of Ni atoms in the model, causing a greater number of Al atoms to have negative
 $\alpha _{{\rm{NiAl}}}^{\left( 2 \right)}$
values.
Normalized average order parameter S/S 0 plotted as a function of dose for Ni3Al single-crystal and the Ni/Ni3Al bilayer systems obtained from the present study.

Following Aronin, Reference Aronin58 the cascade-induced disordering at low doses may be described as a simple exponential decay
 $$S = {S_0}{{\rm{e}}^{ - \varepsilon \Phi }}\quad {\rm{,}}$$
where ε is the disordering efficiency and Φ is the irradiation dose. Fitting this equation to the data in Fig. 3 yields ε ∼ 29 dpa−1 for the bilayer model. This value fits within the 10–100 dpa−1 range reported by Russell for ion irradiation. Reference Russell59
For comparison, a plot obtained from similar calculations carried out for an initially perfectly ordered model of single-crystal Ni3Al (i.e., a simulation cell only containing the γ′ phase) is also shown in Fig. 3. The disordering efficiency for this system is estimated to be ε ∼ 31 dpa−1, showing essentially no difference from ε for the bilayer. This result indicates that the disordering of the γ′ phase is insensitive to the presence of interfaces.
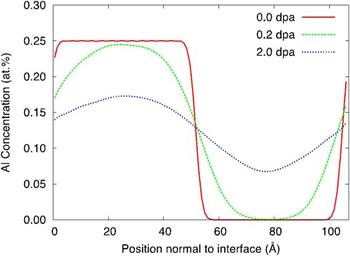
We analyze the dissolution of the γ′ layer by constructing Al concentration profiles as a function of distance perpendicular to Ni/Ni3Al interfaces. Such profiles are shown in Fig. 4 for four selected values of irradiation dose: 0.0, 0.2, 2.0, and 3.0 dpa. Initially, the γ′ layer contains exactly 25 at.% of Al. This composition profile exhibits little change by 0.2 dpa, even though the γ′ layer is nearly fully disordered (see Figs. 2 and 3). Thus, the dissolution of the γ′ layer proceeds much more slowly than its disordering.
Al concentration profiles as a function of distance normal to Ni/Ni3Al interfaces obtained from the present study at 0.0, 0.2, 2.0, and 3.0 dpa.

To quantify the rate of dissolution of the γ′ layer, we compute the mixing parameter Q on the basis of the concentration-position profiles discussed above. The square of the effective interdiffusion length,
 ${D^{{\rm{eff}}}}t$
, appearing in the numerator of the right-hand-side of Eq. (3) is obtained in accordance with the method developed by Zhang and Demkowicz
Reference Zhang and Demkowicz31
based on the Boltzmann-Matano analysis.
Reference Balluffi, Allen and Carter60
The value φF
D
in the denominator of Eq. (2) is evaluated as the number of PKAs multiplied by the PKA energy and divided by the volume of the simulation cell.
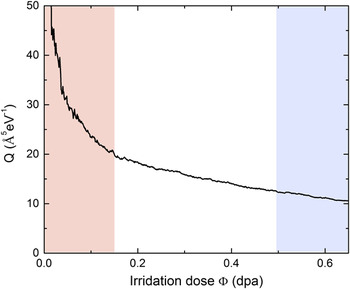
The calculated mixing parameter displays a rapid reduction at low dose followed by a gradual decrease with increasing number of cascade events, as shown in Fig. 5. At low doses below approximately 0.15 dpa, the square of the effective interdiffusion length, D eff t, grows nonlinearly with dose, which gives rise to large statistical errors in the mixing parameter. The average value of the mixing parameter is the highest, 220 Å5 ± 12.7 eV−1, and has the largest statistical error (standard deviation) at the first cascade. At the other extreme, the two layers in our model start to merge with one another around 0.5 dpa, causing the broadened concentration profiles from the two interfaces to overlap. The gradual decrease in mixing parameter at doses above 0.5 dpa is due to this overlap and may therefore be considered an artifact of the finite size of our simulation cell.
Mixing parameter Q plotted as a function of dose in a Ni/Ni3Al bilayer system obtained from the present study. Doses below ∼0.15 dpa, where the square of the interdiffusion length grows nonlinearly with dose, are shaded red. Doses above 0.5 dpa, where the two interfaces begin to overlap, are shaded blue. We obtain the value of the mixing parameter in the dose range 0.15–0.5 dpa.

As described in Sec. IV, the experimental mixing parameter is determined under conditions where the interdiffusion coefficient is approximately constant. To make a comparison with the experimental value, we therefore assess the value of the mixing parameter in the present simulations using only doses between 0.15 and 0.5 dpa, for which the interdiffusion coefficient is relatively steady with the two interfaces being well isolated from each other. Using this approach, we obtain Q = 12–20 Å5 eV−1. The standard deviation in Q is no larger than 0.65 Å5 eV−1 in this range of doses.
To determine whether disordering affects dissolution, we performed simulations for the bilayer model starting with an initially disordered Ni3Al layer with differing values of initial average order parameter. The mixing parameters obtained from these simulations are the same – to within statistical uncertainty – as those for the initially ordered Ni3Al layer. This result demonstrates that disordering and mixing are decoupled processes in the absence of thermally activated diffusion. Reference Ewert and Schmitz17 We also assessed mixing and disordering in a bilayer model with a room temperature thermal equilibrium Al distribution, determined using the variance-constrained semi-grand-canonical Monte Carlo method. Reference Sadigh, Erhart, Stukowski, Caro, Martinez and Zepeda-Ruiz61 In such a model, the whole system contains approximately 6.5 at.% more Al atoms than the idealized model shown in Fig. 1 and the Ni/Ni3Al interface is not atomically sharp, even before irradiation. The values of the disordering efficiency and mixing parameter for this model are also within the statistical error of those obtained from the idealized model shown in Fig. 1.
IV. DISCUSSION
Several experimental studies provide quantitative measurements of the disordering efficiency and disordering rate of ordered γ′ precipitates in Ni-base superalloys and model Ni–Al systems under ion irradiation. Reference Bourdeau, Camus, Abromeit and Wollenberger5–Reference Schmitz, Ewert, Harbsmeier, Uhrmacher and Haider8,Reference Sun, Hatter, Pollock, Wang, Anderoglu, Valdez, Uberuaga, DIckson and Maloy11,Reference Müller33,Reference de Almeida, Schäublin, Almazouzi, Victoria and Döbeli34 Since our simulations do not model thermally activated diffusion, we compare them with room temperature experiments.
The stability of spherical γ′ precipitates in Nimonic PE16 under irradiation with 300 keV Ni+ ions was investigated by means of transmission electron microscopy (TEM) and atom probe tomography in Refs. Reference Bourdeau, Camus, Abromeit and Wollenberger5 and Reference Camus, Abromeit, Bourdeau, Wanderka and Wollenberger6. Nimonic PE 16 is a Ni-base superalloy containing Fe (34 at.%), Cr (16 at.%), Al (2.7 at.%), Ti (1.5 at.%), and Mo (2 at.%). Sun et al. recently studied the stability of γ′ cuboidal precipitates in René N4 under irradiation with 3 MeV Ni3+ ions. Reference Sun, Hatter, Pollock, Wang, Anderoglu, Valdez, Uberuaga, DIckson and Maloy11 René N4 is a Ni-base superalloy whose composition is Cr (15 at.%), Co (10 at.%), W (2.6 at.%), Ta (2.1 at.%), Al (12.4 at.%), Ti (5.8 at.%), Mo (1.2 at.%), and Hf (0.67 at.%). The primary constituent elements of γ′ precipitates in Nimonic PE16 and René N4 are Ni, Al, and Ti, which form nearly stoichiometric Ni3(Al or Ti) intermetallic compounds in the L12 structure in both cases.
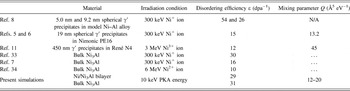
Müller Reference Müller33 and Ewert et al. Reference Ewert, Schmitz, Harbsmeier, Uhrmacher and Haider7 independently reported the values of the disordering efficiency of pure, homogeneous Ni3Al under 300 keV Ni+ ion irradiation. Subsequently, de Almeida et al. also measured the disordering efficiency for pure, homogeneous Ni3Al under irradiation with 6 MeV Ni2+ ions using TEM. Reference de Almeida, Schäublin, Almazouzi, Victoria and Döbeli34 Schmitz et al. further measured the disordering efficiencies of spherical γ′ precipitates in a Ni–Al binary alloy under 300 keV Ni+ ion irradiation. Reference Schmitz, Ewert, Harbsmeier, Uhrmacher and Haider8 The disordering efficiencies and mixing parameters reported in the above references are summarized in Table I.
Comparison of the results of the present study with experimentally measured room temperature disordering efficiencies and mixing parameters.

Experimental studies in Refs. Reference Bourdeau, Camus, Abromeit and Wollenberger5–Reference Schmitz, Ewert, Harbsmeier, Uhrmacher and Haider8, Reference Sun, Hatter, Pollock, Wang, Anderoglu, Valdez, Uberuaga, DIckson and Maloy11 report that γ′ precipitates disorder at a comparably low dose within 0.1–0.2 dpa and then dissolve into the γ matrix at higher doses, which is in line with the findings of the present study (Fig. 3). The rapid reduction in chemical order reflects the narrow composition range of Ni3(Al or Ti) compounds, which is readily destroyed by short-range atomic transport due to interdiffusion within TSs in the absence of thermal reordering.
The disordering efficiency of homogeneous Ni3Al under 300 keV Ni+ ion irradiation was independently reported by Müller Reference Müller33 and Ewert et al. Reference Ewert, Schmitz, Harbsmeier, Uhrmacher and Haider7 to be ε ≈ 30 dpa−1 and 16 dpa−1, respectively. de Almeida et al. Reference de Almeida, Schäublin, Almazouzi, Victoria and Döbeli34 pointed out that the difference in these values may arise from the fact that the authors of Refs. Reference Müller33 and Reference Ewert, Schmitz, Harbsmeier, Uhrmacher and Haider7 used different displacement threshold energies in their fluence-to-dpa conversion. However, neither of these authors actually report the displacement threshold energies they used. The disordering efficiency subsequently reported by de Almeida et al. for homogeneous Ni3Al is even lower, at ε ≈ 10 dpa−1. Reference de Almeida, Schäublin, Almazouzi, Victoria and Döbeli34 These authors claim that the lower disordering rates they reported may be attributed to the larger incident ion energies they used: 6 MeV. Reference de Almeida, Schäublin, Almazouzi, Victoria and Döbeli34 In irradiations using 3 MeV Ni3+ ions, Sun et al. estimated the disordering efficiency of cuboidal precipitates in René N4 to be 12 dpa−1. Reference Sun, Hatter, Pollock, Wang, Anderoglu, Valdez, Uberuaga, DIckson and Maloy11 This value is close to that reported by de Almeida et al. Reference de Almeida, Schäublin, Almazouzi, Victoria and Döbeli34 lending support to the view that higher incident ion energies may lead to lower disordering efficiencies. Reference Komarov62
Our simulations gave disordering efficiencies of ∼29 dpa−1 and ∼31 dpa−1 for the Ni/Ni3Al bilayer and for single-crystal Ni3Al, respectively. These values are in quantitative agreement with the work of Müller, Reference Müller33 but a factor of 2–3 higher than the other experiments mentioned above. Because the above studies did not report the displacement threshold energies they used, it is not clear whether this discrepancy is due to differences in fluence-to-dpa conversions. However, it is to be expected that MD simulations will yield higher disordering efficiencies than experiments, even when identical threshold energies are used for at least two reasons. First, MD simulations only account for mixing induced by collision cascades and do not incorporate the effect of thermally assisted reordering, which decreases the apparent disordering rate. Although thermal diffusion in Ni3Al is insignificant at room temperature, Reference Ewert and Schmitz17 a minor effect of re-ordering should be expected at any finite temperature. Second, MD simulations that use classical potentials do not take into account electronic processes. Therefore, these simulations may significantly underestimate thermal conductivities in metals, since they only model the lattice contribution to thermal conductivity and not the electronic contribution. Higher thermal conductivities give rise to more rapid quenching of thermal spike cores, Reference Flynn and Averback63 which in turn reduces the disordering rate. Reference Skirlo and Demkowicz30
Schmitz et al. Reference Schmitz, Ewert, Harbsmeier, Uhrmacher and Haider8 measured disordering efficiency for bulk single-crystal Ni3Al, spherical γ′ precipitates 9.2 nm in diameter, and ones with 5.0 nm diameter to be ε ∼ 16 dpa−1, 26 dpa−1, and 54 dpa−1, respectively. Their study appears to indicate that disordering efficiency systematically increases with increasing precipitate interface-to-volume ratio. However, the present study gives nearly identical disordering efficiencies for the Ni/Ni3Al bilayer and for single-crystal Ni3Al: ∼29 dpa−1 and ∼31 dpa−1, respectively. Therefore, our results do not show any effect of interface-to-volume ratio on disordering efficiency.
The radiation-induced interdiffusion coefficient was determined to be Q ≈ 7.5 × 10⁻¹⁴ Å2 ps−1 for γ′ precipitates in Nimonic PE16 in Refs. Reference Bourdeau, Camus, Abromeit and Wollenberger5 and Reference Camus, Abromeit, Bourdeau, Wanderka and Wollenberger6. To deduce an experimental mixing parameter from this value, we used TRIM simulations Reference Ziegler, Ziegler and Biersack64 to compute the stopping power due to internuclear collisions for 300 keV Ni+ ions impinging on Nimonic PE16. By averaging the nuclear stopping power over the penetration depth and using the reported ion flux of 0.8 mA m−2, we assessed the experimental mixing parameter for this alloy to be 13.2 Å5 eV−1. This value lies at the lower end of the range of mixing parameters found in the present simulations: 12–20 Å5 eV−1. As in the case of disordering, the higher mixing parameters found in our simulations may be attributed to the minor amounts of thermally activated de-mixing in experiments and – more likely – to the longer lifetime of TSs due to the absence of electronic thermal conductivity in the MD simulations.
Sun et al. obtained a mixing parameter of 45 Å5 eV−1 from measurements of the interdiffusion length at γ/γ′ interfaces in René N4 irradiated by 3 MeV Ni3+ ions, Reference Sun, Hatter, Pollock, Wang, Anderoglu, Valdez, Uberuaga, DIckson and Maloy11 i.e., much larger than that deduced from Refs. Reference Bourdeau, Camus, Abromeit and Wollenberger5 and Reference Camus, Abromeit, Bourdeau, Wanderka and Wollenberger6. This discrepancy may be due to a dependence of mixing parameters on the PKA energy. According to Bacon and Diaz de la Rubia, Reference Bacon and Diaz de la Rubia57 mixing parameters increase approximately in proportion to the square root of the PKA energy. Therefore, in agreement with experimental results, a factor of ∼3 difference in mixing parameters may be expected between the 3 MeV Ni3+ ion experiments of Sun et al. and the 300 keV Ni+ ion experiments in Refs. Reference Bourdeau, Camus, Abromeit and Wollenberger5 and Reference Camus, Abromeit, Bourdeau, Wanderka and Wollenberger6. However, more work is required to confirm this deduction, since Bacon and Diaz de la Rubia only studied mixing for PKA energies up to 30 keV. Reference Bacon and Diaz de la Rubia57
Ni-base alloys such as René N4 and Nimonic PE16 contain solutes, defects, and microstructural features that are not represented in our simulations. Thus, the comparisons with the experimental data provided above should be viewed as qualitative. Nevertheless, the overall agreement between experiments and modeling predictions of disordering efficiency and mixing parameter at room temperature is remarkably good, lending credibility to the use of simple atomistic models to study complex mixing phenomena.
The assumption that thermally activated recovery processes may be neglected holds well for room temperature experiments in the Ni–Al system. At higher temperatures, however, thermally assisted reordering and de-mixing cannot be ignored. Reference Camus, Abromeit, Bourdeau, Wanderka and Wollenberger6,Reference Schmitz, Ewert, Harbsmeier, Uhrmacher and Haider8,Reference Ewert and Schmitz17 In contrast to room temperature behavior, the disordering and dissolution of γ′ precipitates at elevated temperatures appear no longer to be independent, but correlated. Reference Camus, Abromeit, Bourdeau, Wanderka and Wollenberger6,Reference Schmitz, Ewert, Harbsmeier, Uhrmacher and Haider8 The time scale required to model such processes exceeds that accessible in conventional MD. However, given that the crystal structure is preserved during disordering and dissolution, lattice kinetic Monte Carlo Reference Ye, Li, Averback, Zuo and Bellon18,Reference Voter65,Reference Martínez, Marian, Kalos and Perlado66 or accelerated MD methods Reference Voter, Montalenti, Germann, Uberuaga and Sprague67,Reference Bai, Voter, Hoagland, Nastasi and Uberuaga68 may be useful to simulate these phenomena at higher temperatures.
ACKNOWLEDGMENTS
The authors are grateful to Daniel Schwen, Scott A. Skirlo, Cheng Sun, Wenshan Yu, and Liang Zhang for helpful discussions. This work was supported by the Laboratory Directed Research and Development program at Los Alamos National Laboratory under Project No. 20130118DR, under DOE Contract DE-AC52-06NA253.