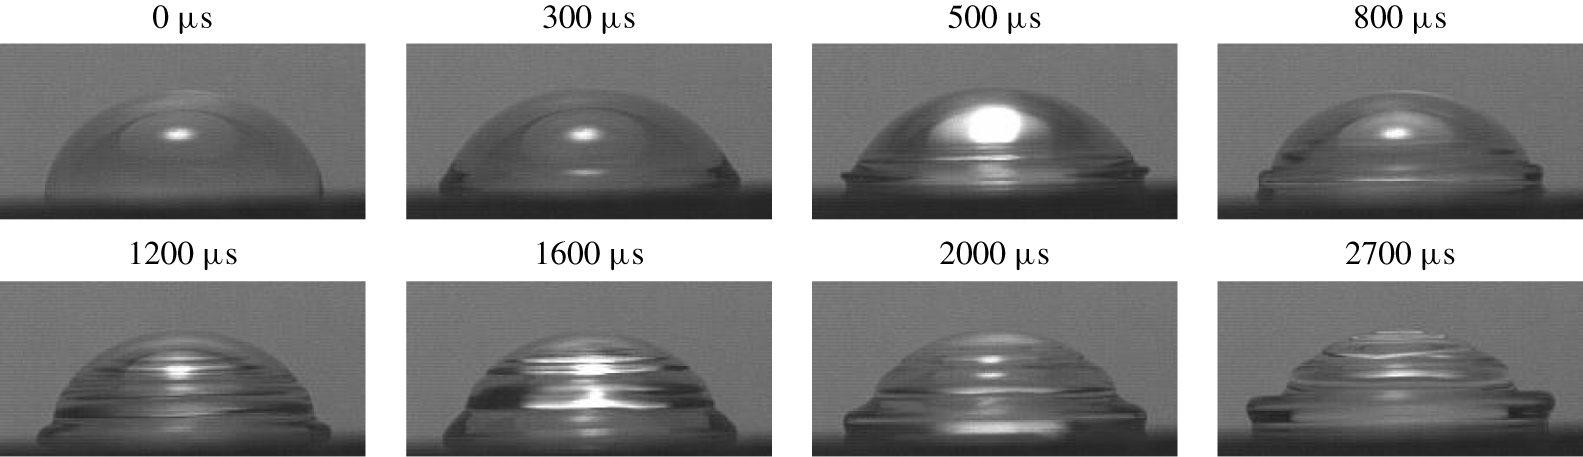
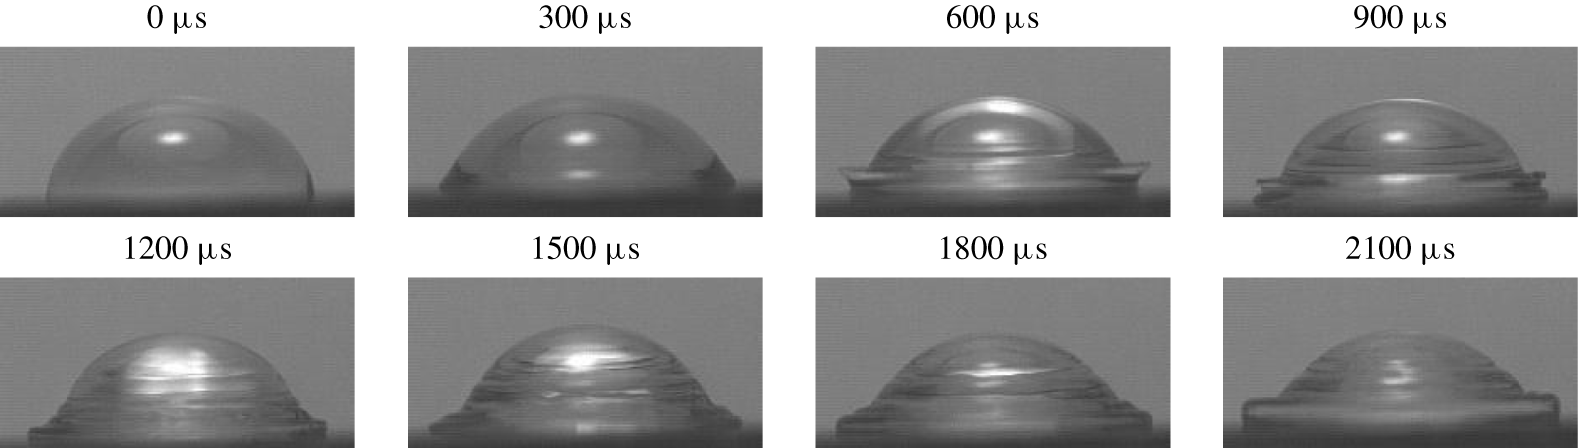
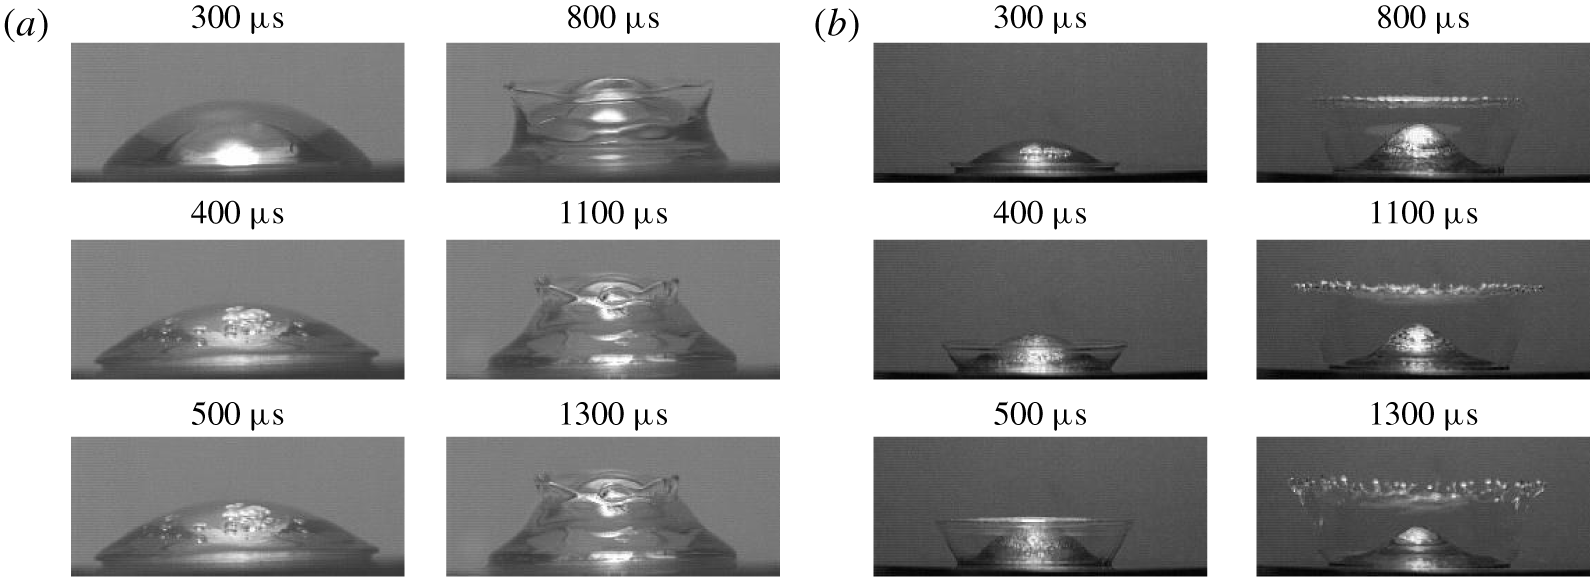
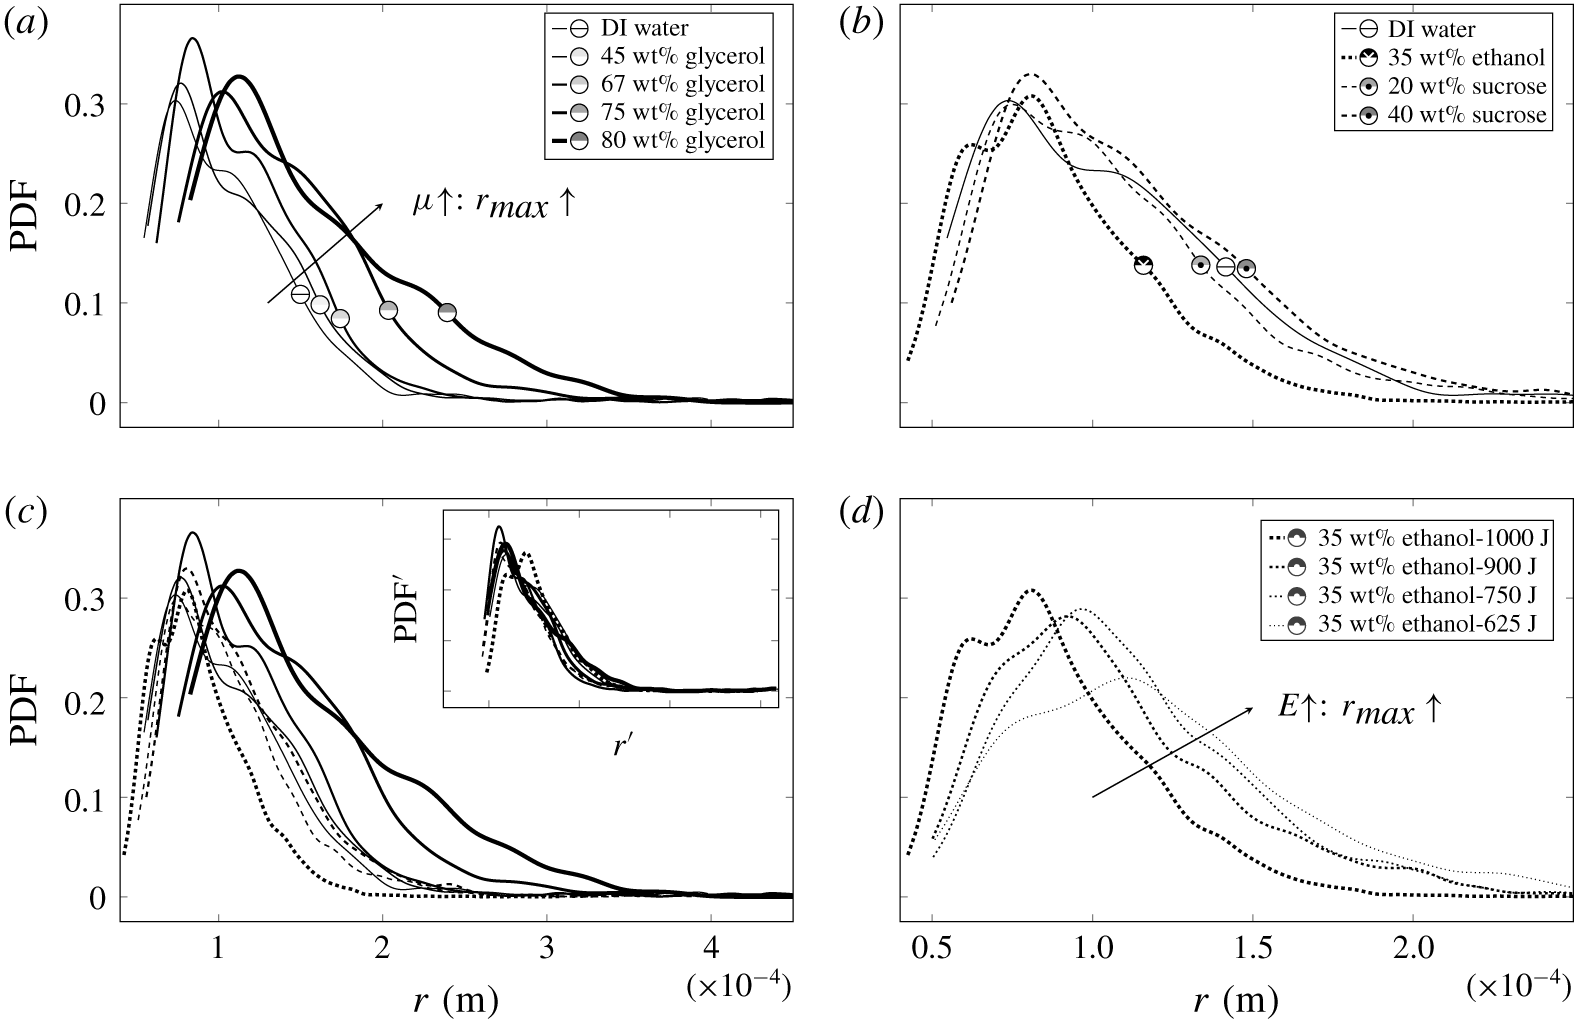
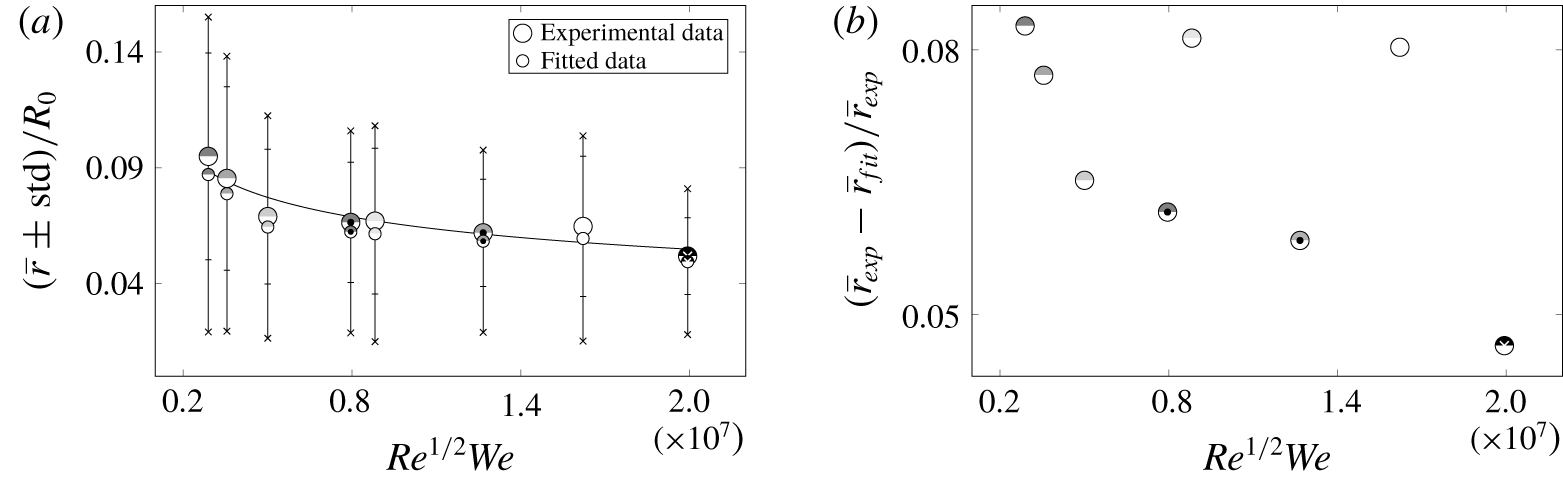
1 Introduction
The breakup of drops into secondary ones is a fundamental multiphase process encountered in plethora of applications including atomization, dispersed flows, combustion instability of sprays, heterogeneous detonations of gas/liquid mixtures, agricultural and environmental spraying, aerosol formation, steam turbine blade erosion, ablation in space technology and interactions between high-speed aircraft and raindrops, to name a few. Among the key objectives in this secondary atomization of liquid drops is the increase of surface area and the enhancement of heat and mass transfer, for example between the fuel and the ambient gas.
There are three basic situations in which a drop may experience the secondary breakup – shock wave (SW) passing through a suspended drop known as aerobreakup, a drop impinging on a solid or liquid surface and a solid surface impulsively accelerating into the drop sitting on it – all necessarily involving a sudden impact, which provides enough energy to overcome surface tension forces holding the drop together and the viscous resistance opposing the stresses required to break up the drop. The latter configuration, while ubiquitous in a number of aforementioned applications, is also fundamental to diesel engine technology, sensor resonators, condensation on resonators in thermoacoustic engines and heat exchangers.
While aerobreakup is characterized by a non-uniform pressure distribution due to aerodynamic forces and contribution of thermodynamic effects (Joseph, Huang & Candler Reference Joseph, Huang and Candler1996), because at the earliest stages of drop fragmentation copious amounts of mist are formed in the course of flash evaporation of the hot and low-pressure liquid on the leeside of the drop, none of these ramifications occur in the case of impulsively accelerated drops sitting on a solid substrate. As for distinctions from the drop impact on a solid, besides the obvious fact that in the latter situation the drop is an oblate spheroid before the impact while in our case the sessile drop shape is dictated by the wetting properties of the solid substrate, they amount to two key factors drastically differentiating the system under consideration. First, we naturally do not need to deal with air entrapment effects, which occur in the drop impact problem (Josserand & Thoroddsen Reference Josserand and Thoroddsen2016). Second, the coordinate transformation from a drop impinging a solid to a drop driven by a nearly impulsive acceleration  $a$ of the substrate requires a transition to a non-inertial frame of reference and therefore lacks a Galilean invariance: hence one cannot necessarily infer the behaviour of one phenomenon from the other (§ 4.3) as evidenced by the different metamorphoses a drop experiences (§§ 3, 6.1). In this regard, to our knowledge, the effect of a finite acceleration
 $a$ on the response of a liquid drop of radius
 $R_{0}$, density
 $\unicode[STIX]{x1D70C}$ and dynamic viscosity
 $\unicode[STIX]{x1D707}$ has not been studied, which is apparent even from the governing velocity
 $V_{max}$-based non-dimensional parameters – Reynolds
 $Re=\unicode[STIX]{x1D70C}V_{max}R_{0}/\unicode[STIX]{x1D707}$ and Weber
 $We=\unicode[STIX]{x1D70C}V_{max}^{2}R_{0}/\unicode[STIX]{x1D70E}$ numbers – invoked to characterize the aerobreakup (Pilch & Erdman Reference Pilch and Erdman1987) and drop impact on solid phenomena (Yarin Reference Yarin2006). However, as we will show, despite substantial magnitudes of acceleration, its variation (along with the associated intensity of the SW induced in the drop by a sudden displacement of the substrate) proves to be responsible for the diversity of drop responses.
Similar to the above mentioned sister problems, analytical progress on understanding the impulse-driven drop phenomena is impeded by the fact that the drop distortion is comparable to its initial size, thereby requiring a fully nonlinear analysis. Reliable numerical progress is hindered as well in view of severe changes in the drop topology due to cavitation, detachment from the substrate and eventual disintegration – all amounting to the multiscale nature of the phenomena. For that reason we approach the problem with experimental tools here (§ 2) in order to unveil the key morphologies (§ 3), which turn out to be strikingly different from those in aerobreakup and drop impact on solid (§ 6.1). As will be shown, our experiments revealed two primary regimes of drop response labelled as deformation and disintegration, respectively, within which there is a great variety of sub-regimes overviewed in § 3. In the subsequent sections we highlight the underlying physical mechanisms either qualitatively or with appropriate scalings and estimates in the detailed studies of both the drop deformation (§ 4) and disintegration (§ 5) morphologies organized in the order of increasing impact intensity. Starting with quantifying the crown precursors and the physics behind them (§ 4.1), we explore the different crown regimes (§ 4.2), the governing mechanisms of impulse-driven drop deformations (§ 4.3) and then the crown dynamics along with the viscosity and surface tension effects on it (§ 4.4). Pertaining to the drop disintegration regimes (§ 5.1), we explore the fluid dynamics behind them (§ 5.2), drop detachment and disintegration times (§ 5.3) as well as the effects of viscosity, surface tension and compressibility on the secondary droplet size distributions (§ 5.4). Throughout the paper, we identify proper time scales and non-dimensional parameters which help one to dissect the nature of various observed drop deformations (§ 4.2) and disintegrations (§ 5.1) along with the transitions between them.
2 Experimental set-up and procedure
2.1 Apparatus
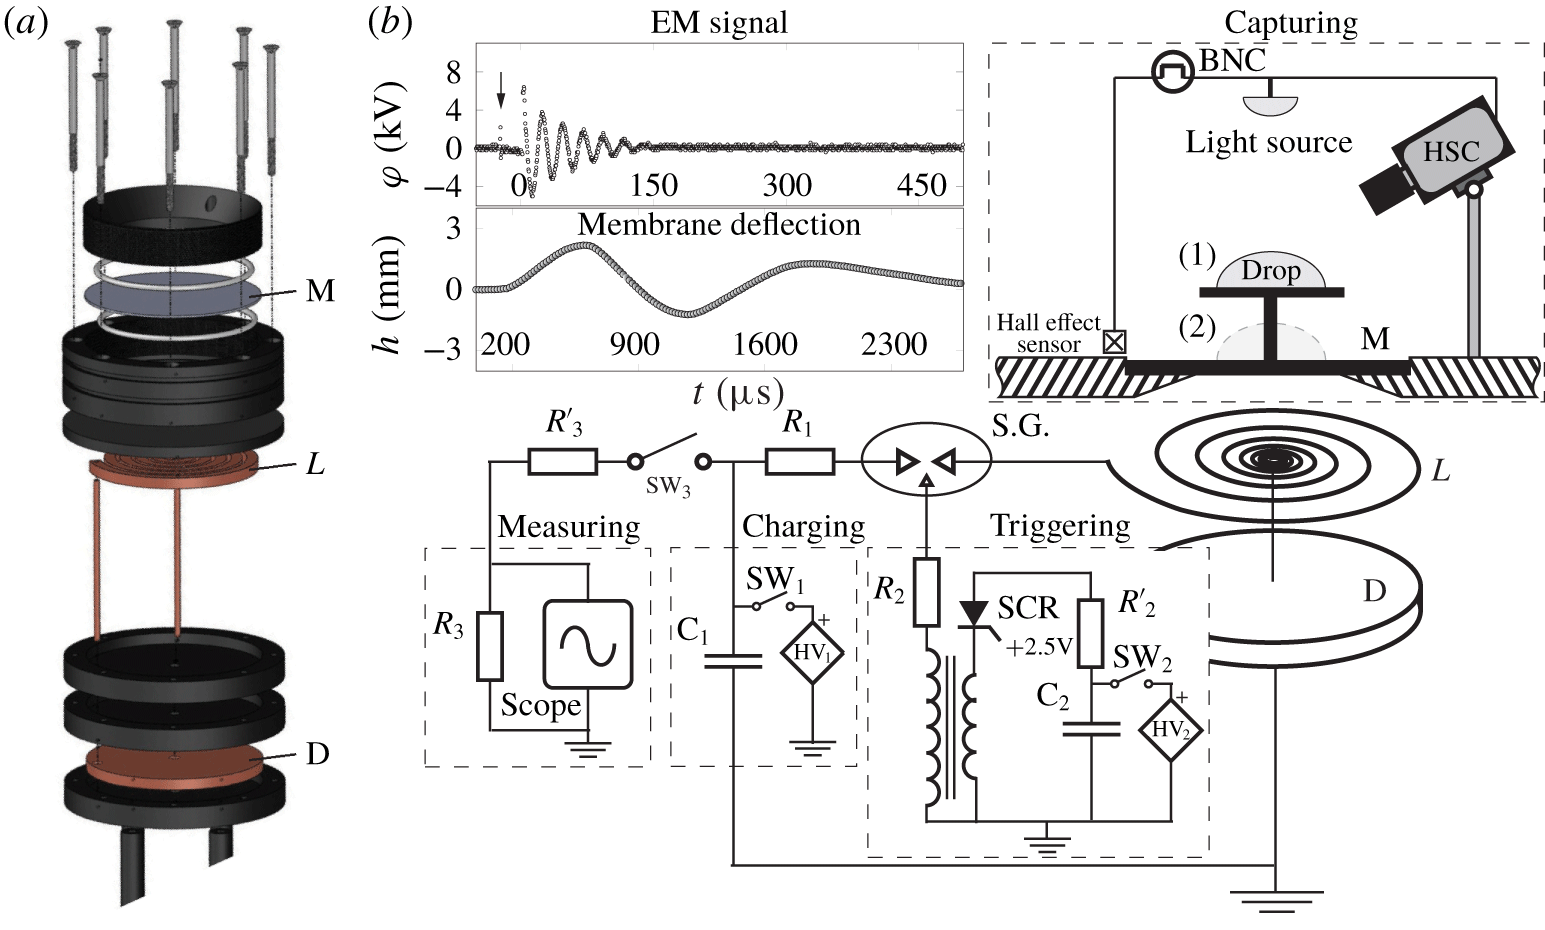
Methods for generating shock waves in liquids – explosive, electromagnetic, piezoelectric and piezodispersive – were recently reviewed and compared by Dion, Hebert & Brouillette (Reference Dion, Hebert, Brouillette, Hannemann and Seiler2009). Despite the key disadvantage of the electromagnetic piston method – namely, high voltage components – we have chosen it over other approaches due to easy adjustability, in particular the ability to control the signal shape by varying resistance and inductance and to produce shocks of large amplitudes compared to, say, the piezoelectric method. To study shock wave–drop interaction phenomena, we built an electromagnetic shock wave generator (EMSWG) originally invented by Eisenmenger (Reference Eisenmenger1962) for the production of plane shock waves in water and used in subsequent works, e.g. by Mortimer & Skews (Reference Mortimer and Skews1996) and Kedrinskii et al. (Reference Kedrinskii, Makarov, van Doorn and Borel2005). The physics of EMSWG and its electroacoustic efficiency are now reasonably well understood (Roi Reference Roi1970).
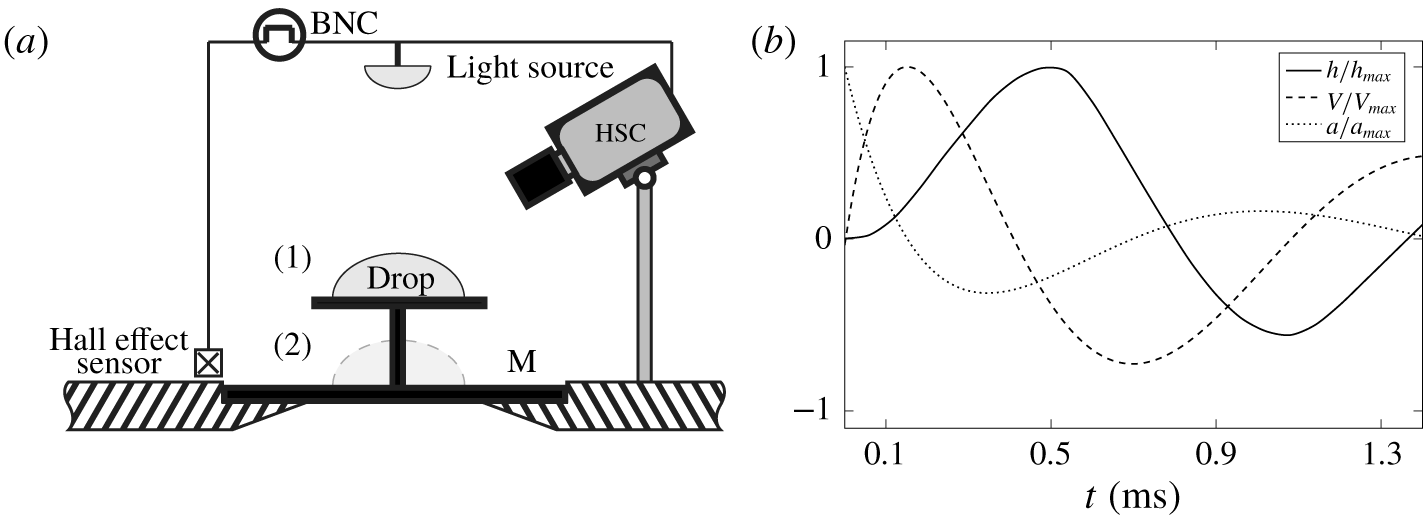
While the mechanical and electric components of the set-up – an electromagnetic shock tube assembly as well as charging, triggering and measuring units – are detailed in appendix C, the capturing part, schematized in figure 1(a), resorts to conventional high-speed photography visualization techniques. A pulse required to start/stop recording the phenomena with a camera is provided by a linear Hall effect sensor (TT Electronics, OHS3150U). Once this sensor detects the electromagnetic (EM) field, it sends a signal to a pulse/delay generator BNC (Berkeley Nucleonics Corp, Model 575). After some delay precisely set by the BNC, a pulse is provided to a camera and a strobe to start or stop recording. Two cameras were used in these experiments: high resolution (Vieworks VA-8MC-C16A0) and high-speed (Phantom V5.2) ones. In the case of a high resolution camera a light strobe (IDT-19LED-2nd Gen) was employed and synchronized with it. In the case of the high-speed camera a custom made LED source ( ${\sim}14\,000$ lumens) provided a continuous lighting during the recording. Exposure time of recording with the Phantom was set at
 ${\leqslant}10~~\unicode[STIX]{x03BC}\text{s}$ and with the Vieworks down to
 $1~\unicode[STIX]{x03BC}\text{s}$. Frame size of the Vieworks camera was set at
 $1920\times 1080$ pixels and in the case of the Phantom camera it was adjusted depending on the frame rate.
(a) Schematics of the capturing part of the experimental set-up indicating two studied configurations: drop sitting on (1) a pedestal circular ( $\varnothing \,20~\text{mm}$ and 0.5 mm thick) plate mounted on membrane M and (2) the membrane directly. (b) Typical membrane kinematics shown for the initial energy 390 J and membrane thickness 0.1 mm: scaled by maximum values are the membrane deflection
 $h/h_{max}$ (solid), velocity
 $V/V_{max}$ (dashed) and acceleration
 $a/a_{max}$ (dotted).

Impulse energy of the EMSWG varied between 250 and 1000 J. In the low impulse intensities a drop was placed on a pedestal – a circular plate mounted on the post (configuration 1 in figure 1a), which is fixed at the centre of the 0.5 mm copper membrane clamped along its periphery and agitated by the EMSWG. In the high impulse intensities a drop is positioned directly on thinner copper membranes of thicknesses  $h_{0}=0.17$,
 $0.1$ and 0.034 mm (configuration 2). A slight difference between these two configurations is that the pedestal top plate remains perfectly flat, while the membrane deforms (cf. figure 2a), although it stays essentially flat near its centre where the drop is placed since the deformations are much smaller than the membrane radius. Note that we refer to the load-bearing element as a membrane following the convention in the literature with the caveat that in elasticity theory (Landau & Lifshitz Reference Landau and Lifshitz1986) it should be referred to as a plate since a membrane is subject to large external stretching forces applied at its circumference, which is not the case here.
2.2 Fluid properties and membrane kinematics
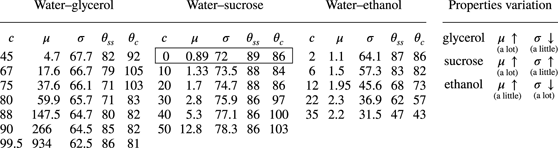
To investigate the effect of surface tension and viscosity on SW–drop interaction, we prepared 7 water–glycerol, 5 water–sucrose, 5 water–ethanol solutions of various concentrations and also deionized (DI) water: their thermophysical properties and contact angles  $\unicode[STIX]{x1D703}$ on both stainless steel and copper substrates are summarized in table 1. These three types of mixtures were deliberately chosen in order to achieve a wide range of viscosities, surface tensions and contact angle variations between wetting and non-wetting across
 $\unicode[STIX]{x1D703}=90^{\circ }$. This enables us to work in the range in which viscous and interfacial forces are the dominant factors controlling the physical system. Contact angles were measured in our laboratory, as actual values often vary from those reported in the literature. The speeds of sound at
 $20\,^{\circ }\text{C}$ for pure ethanol, pure glycerol and DI water are 1170, 1923 and
 $1479~\text{m}~\text{s}^{-1}$, respectively (Giacomini Reference Giacomini1947; Pryor & Roscoe Reference Pryor and Roscoe1954; Association 1963). In the case of sucrose, a 50 wt% solution is taken as a reference for the speed of sound, which is
 $1720~\text{m}~\text{s}^{-1}$ (Pryor & Roscoe Reference Pryor and Roscoe1954). Sound speeds for all other solutions, for which data are not available, were found by interpolation as appropriate for liquid mixtures (Matheson Reference Matheson1971). Liquid drop volumes were changed between 25, 50, 75 and
 $100~\unicode[STIX]{x03BC}\text{l}$.
Working fluids: each of the five columns for the glycerol–, sucrose– and ethanol–water mixtures represents concentration  $c$ (wt%), dynamic viscosity
 $\unicode[STIX]{x03BC}~(\text{mPa}~\text{s})$, surface tension
 $\unicode[STIX]{x1D70E}$ (
 $\text{mN}~\text{m}^{-1}$) as well as contact angles with stainless steel
 $\unicode[STIX]{x1D703}_{ss}$ and copper
 $\unicode[STIX]{x1D703}_{c}$ substrates, accordingly. Encircled are the properties of water.

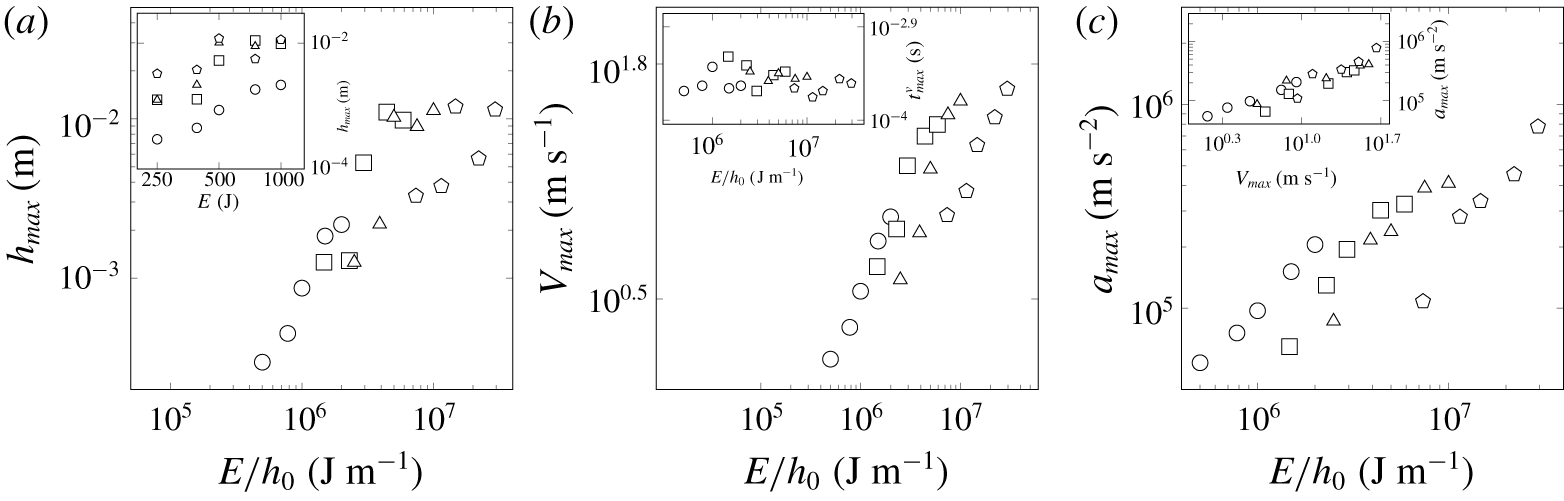
Maximum deflection  $h_{max}$ (a), velocity
 $V_{max}$ (b), acceleration
 $a_{max}$ (c) for each membrane thickness
 $h_{0}=0.5$, 0.17, 0.1 and 0.034 mm (denoted by ○, ▫, ▵ and
 $\unicode[STIX]{x2B20}$, respectively) for five different initial energies
 $E=250,390,500,750$ and 1000 J. Insets: (a) uncollapsed data of
 $h_{max}$ versus the discharged energy
 $E$, (b) the time
 $t_{max}^{V}$ when
 $V_{max}$ is registered, (c) correlation between
 $a_{max}$ and
 $V_{max}$.

To measure the membrane kinematics, cf. figure 1(b), a needle was fixed at the membrane centre, where maximum values of deflection are experienced; the displacement of the needle tip was recorded at 60 000 f.p.s. and frame size of  $256\times 32$ pixels. Maximum deflection
 $h_{max}$, velocity
 $V_{max}$ and acceleration
 $a_{max}$ for all studied cases are reported in figure 2 with the latter two variables corresponding to the early times of the displacement curve, cf. figure 1(b). While raw data, e.g.
 $h_{max}$ versus
 $E$ in the inset of figure 2(a), are quite scattered, plotting the kinematics variables versus impact intensity
 $E/h_{0}$ shows reasonable collapse since the membrane response to EM agitation is dictated not only by the released energy
 $E$, but also by the membrane thickness
 $h_{0}$. The choice of
 $E/h_{0}$ follows from the fact that it is the pressure
 $p\sim E/(h_{0}D^{2})$ induced on the membrane surface that is important for the phenomena at hand (Roi Reference Roi1970). Since the membrane diameter
 $D$ is fixed, then
 $E/h_{0}$ accounts for the variation of pressure and also encodes the natural membrane frequency
 $\unicode[STIX]{x1D714}_{M}$.
Lastly, the magnitudes of acceleration  $a_{max}$ in figure 2(c) are comparable with
 $O(10^{5}{-}10^{6})\,\text{m}~\text{s}^{-2}$ in the SW–drop interaction experiments by Joseph, Belanger & Beavers (Reference Joseph, Belanger and Beavers1999), but much lower than
 $O(10^{7}{-}10^{8})\,\text{m}~\text{s}^{-2}$ in Simpkins & Bales (Reference Simpkins and Bales1972) for incident-shock Mach numbers 6–10. On the other hand, accelerations in our experiments are several orders of magnitude higher than in the recent studies of drop trampoline by Chantelot et al. (Reference Chantelot, Clanet, Coux and Quéré2018a,Reference Chantelot, Coux, Domino, Pype, Clanet, Eddi and Quéréb), who looked at the drop–membrane interaction in the relatively low acceleration regime of
 $O(10^{2})\,\text{m}~\text{s}^{-2}$. The patterns found by Chantelot et al. (Reference Chantelot, Coux, Domino, Pype, Clanet, Eddi and Quéré2018b) are analogous to ours reported earlier (Habibi & Krechetnikov Reference Habibi and Krechetnikov2015).
3 Results: overview of key morphologies
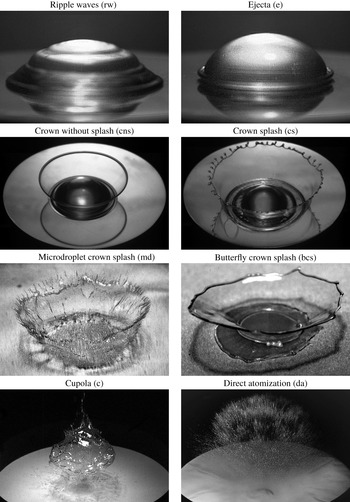
High resolution images of the key observed morphologies. Test conditions – liquid, drop volume, capacitor energy, exposure time, delay, physical image size, viewing angle – were as follows: (rw) DI water,  $50~\unicode[STIX]{x03BC}\text{l}$, 250 J, 0.5 mm,
 $10~\unicode[STIX]{x03BC}\text{s}$,
 $3000~\unicode[STIX]{x03BC}\text{s}$,
 $10.9\times 7.3~\text{mm}^{2}$,
 $5^{\circ }$; (e) DI water,
 $50~\unicode[STIX]{x03BC}\text{l}$, 390 J, 0.5 mm,
 $10~\unicode[STIX]{x03BC}\text{s}$,
 $700~\unicode[STIX]{x03BC}\text{s}$,
 $10.9\times 7.3~\text{mm}^{2}$,
 $5^{\circ }$; (cns) 75 wt% glycerol,
 $50~\unicode[STIX]{x03BC}\text{l}$, 1000 J, 0.5 mm,
 $10~\unicode[STIX]{x03BC}\text{s}$,
 $1000~\unicode[STIX]{x03BC}\text{s}$,
 $20.7\times 13.8~\text{mm}^{2}$,
 $40^{\circ }$; (cs) DI water,
 $50~\unicode[STIX]{x03BC}\text{l}$, 1000 J, 0.5 mm,
 $10~\unicode[STIX]{x03BC}\text{s}$,
 $1200~\unicode[STIX]{x03BC}\text{s}$,
 $20.7\times 13.8~\text{mm}^{2}$,
 $40^{\circ }$; (md) 35 wt% ethanol,
 $50~\unicode[STIX]{x03BC}\text{l}$, 500 J, 0.034 mm,
 $1~\unicode[STIX]{x03BC}\text{s}$,
 $632~\unicode[STIX]{x03BC}\text{s}$,
 $13.8\times 9.2~\text{mm}^{2}$,
 $30^{\circ }$; (bcs) 67 wt% glycerol,
 $50~\unicode[STIX]{x03BC}\text{l}$, 390 J, 0.17 mm,
 $10~\unicode[STIX]{x03BC}\text{s}$,
 $1800~\unicode[STIX]{x03BC}\text{s}$,
 $18.2\times 12.2~\text{mm}^{2}$,
 $30^{\circ }$; (c) 50 wt% sucrose,
 $50~\unicode[STIX]{x03BC}\text{l}$, 500 J, 0.1 mm,
 $5~\unicode[STIX]{x03BC}\text{s}$,
 $1700~\unicode[STIX]{x03BC}\text{s}$,
 $71.7\times 47.9~\text{mm}^{2}$,
 $30^{\circ }$; (da) DI water,
 $50~\unicode[STIX]{x03BC}\text{l}$, 1000 J, 0.034 mm,
 $3~\unicode[STIX]{x03BC}\text{s}$,
 $800~\unicode[STIX]{x03BC}\text{s}$,
 $71.7\times 47.9~\text{mm}^{2}$,
 $30^{\circ }$.

First, experiments were carried out to identify the key morphologies, illustrated and defined in figure 3, as well as to map out the regimes and the corresponding transition boundaries between them discussed below in §§ 4.2 and 5.1. In the ripple wave regime ( $\text{rw}$), apparently, the driving velocity of the substrate
 $V_{max}$ is below the interfacial wave (phase) velocity
 $c_{p}$: as a result, the capillary waves induced by membrane deflection overrun it and propagate along the drop surface, forming a staircase structure. Once the ‘supersonic’ regime is achieved
 $V_{max}>c_{p}$ upon increasing the membrane driving intensity, one observes hydraulic jump type phenomena leading to ejecta formation (
 $\text{e}$). This is confirmed by comparing the phase velocity of capillary waves
 $c_{p}$ with
 $V_{max}$ in § 4.1. In the ejecta regime the rim stays flat, i.e. does not develop an along-the-rim instability. In the crown regimes (
 $\text{cns}$,
 $\text{cs}$,
 $\text{md}$) the drop initially flattens into a pancake and the same mechanism as that responsible for the ejecta formation is intensified thus feeding more fluid into the ejecta. In the crown without splash (
 $\text{cns}$) regime the rim mostly stays flat, but may experience an instability at a later stage of development although without secondary droplet detachment. Upon increasing the impulse intensity and reaching the crown with splash regime (
 $\text{cs}$), a Rayleigh–Taylor (RT) instability of accelerating interface overcomes the stabilizing role of surface tension: acceleration becomes significant enough to produce fingers, which eventually break up via a Rayleigh–Plateau (RP) instability, i.e. drops pinch off from the end of each jet and the rim develops cusps similar to crown formation in other drop impact phenomena (Yarin & Weiss Reference Yarin and Weiss1995). We refer to this regime as a crown with splash irrespective of its regularity (Krechetnikov & Homsy Reference Krechetnikov and Homsy2009). In the microdroplet crown regime (
 $\text{md}$) the ejecta becomes thinner, which is essentially due to enhanced flattening of the drop. As a consequence, the thinner ejecta breaks initially into smaller droplets (see also the right column in figure 28 of appendix B), but as the ejecta thickens the emitted drop size increases. Once the ejecta becomes too thin with increasing impact intensity, there emerges the butterfly crown (
 $\text{bcs}$) regime characterized by larger crowns and more substantial sidewise deflection of the crown liquid sheet, which we believe is due to the resistance of the surrounding air and membrane deformations much larger compared to that in the previous regimes (regimes, starting with the butterfly crowns, were observed on thin membranes only, which deform substantially more compared to the experiments on thick membranes, cf. figure 2a). Such crowns have a Hatazori-gata (curving lip) cup shape, which experiences an instability along its wall (sheet) perimeter leading to a butterfly pattern. In the cupola regime (
 $\text{c}$) a new phenomenon appears, which is due to above-critical cavitation bubble density leading to a fast formation of a void comparable to the drop size and responsible for the drop detachment from the membrane and eventual disintegration. At even higher impulse intensities the drop experiences a comparatively immediate break-up – the direct atomization regime (
 $\text{da}$). In what follows we disentangle these observations by considering drop deformation (§ 4) and disintegration (§ 5) morphologies separately.
4 Results: drop deformation regimes
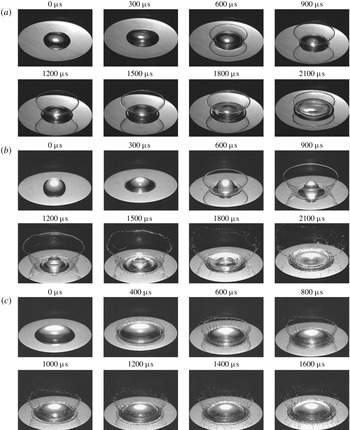
For drops of all liquid types on the 0.5 mm thick membrane (pedestal configuration), by increasing impulse energy, and hence intensity, the patterns change from ripple waves to a monotonic crown, as per figure 4. The ripple wave pattern is observed when the initial energy is 250 J. Upon increasing it to 390 J, the pattern transitions to ejecta. By further increase of the initial energy to 500 J the non-monotonic crown is formed, meaning that radius of the crown first increases to a maximum value and then decreases with time (figure 4c); this non-monotonic pattern is also observed for the 35 wt% ethanol–water solution when the initial energy is set to 750 J. For the other liquid types at 750 J and for all liquids at 1000 J initial energy the crown radius increases monotonically with time (figure 4d). The interplay of monotonic versus non-monotonic crowns is discussed further in § 4.4.
Regime transitions for different impact intensities: (a) ripple waves, (b) ejecta characterized by velocity  $v_{e}$. thickness
 $h_{e}$ and the root radius
 $r_{e}$, (c) non-monotonic crown, (d) monotonic crown.

4.1 Crown precursors
Ripple wave pattern in DI water. The drop volume, initial energy, maximum velocity and deflection of the stainless steel membrane, and membrane thickness were  $50~\unicode[STIX]{x03BC}\text{l}$, 250 J,
 $1.47~\text{m}~\text{s}^{-1}$, 0.3 mm and 0.5 mm, respectively. Physical image size is
 $11.0\times 5.3~\text{mm}^{2}$.

As mentioned above, at the lower impulse intensities we first observe ripple waves and ejecta, cf. figures 5 and 6. By running experiments with all the liquids reported in table 1, we noticed that increasing the viscosity from water to glycerol and sucrose solutions decreases the number of observed ripple waves on the liquid drop surface at an earlier stage, indicating that the speed of their propagation is reduced. The same effect occurs if we decrease surface tension by going from a water to an ethanol solution. These two effects can be understood from the consideration of linear dissipative deep water waves (Lamb Reference Lamb1932; Plesset & Whipple Reference Plesset and Whipple1974). Namely, given the evolution equation for small free surface deformation  $\unicode[STIX]{x1D701}(t,\boldsymbol{x})$ in the wavenumber
 $k$ space
 $\widehat{\unicode[STIX]{x1D701}}_{tt}+4\unicode[STIX]{x1D708}k^{2}\widehat{\unicode[STIX]{x1D701}}_{t}+\unicode[STIX]{x1D714}_{0}^{2}\widehat{\unicode[STIX]{x1D701}}=0$, where
 $\widehat{\unicode[STIX]{x1D701}}$ is the Fourier transform of
 $\unicode[STIX]{x1D701}$,
 $\unicode[STIX]{x1D714}_{0}^{2}=ak+\unicode[STIX]{x1D70E}k^{3}/\unicode[STIX]{x1D70C}$ and
 $\unicode[STIX]{x1D708}\equiv \unicode[STIX]{x1D707}/\unicode[STIX]{x1D70C}$ is the kinematic viscosity, we find the frequency of the ripple waves in the limits of the capillary waves and low viscosity
 $$\begin{eqnarray}\displaystyle \unicode[STIX]{x1D714}(k)\approx (\unicode[STIX]{x1D70E}k^{3}/\unicode[STIX]{x1D70C})^{1/2}[1-2\unicode[STIX]{x1D70C}\unicode[STIX]{x1D708}^{2}k/\unicode[STIX]{x1D70E}]+2\text{i}\unicode[STIX]{x1D708}k^{2}+\cdots \,. & & \displaystyle\end{eqnarray}$$
Since the dominant wavenumber  $k$ is dictated by the form of the initial perturbation
 $\unicode[STIX]{x1D701}(0,\boldsymbol{x})$ – the maximum displacement of the membrane – we can perform a further analysis in terms of the phase speed
 $c_{p}=\unicode[STIX]{x1D714}(k)/k$ for this concrete wavenumber as we implicitly did in § 3. As follows from (4.1),
 $c_{p}$ decreases with increasing viscosity
 $\unicode[STIX]{x1D708}$ and with decreasing surface tension
 $\unicode[STIX]{x1D70E}$ (as long as the viscosity is small).
Ripple wave patterns in figure 5 are analogous to the staircase structure observed by Renardy et al. (Reference Renardy, Popinet, Duchemin, Renardy, Zaleski, Josserand, Drumright-Clarke, Richard, Clanet and Quéré2003) and Roux & Cooper-White (Reference Roux and Cooper-White2004) in drop impacts on a solid surface. To explain the existence of the staircase phenomenon, one must appeal to capillary waves. Since initially the dominant capillary wave induced by an impulse has a phase speed  $c_{p}$ equal to the impulse speed
 $V_{max}$, from (4.1) we find that its wavelength is
 $\unicode[STIX]{x1D706}\sim \unicode[STIX]{x1D70E}/\unicode[STIX]{x1D70C}V_{max}^{2}$. Clearly, waves are observed if
 $\unicode[STIX]{x1D706}<R_{0}$, i.e.
 $We>1$. Also, in order to observe the staircase structures the distance of decay
 $l$ of a wave of length
 $\unicode[STIX]{x1D706}$ propagating with speed
 $V_{max}$ must be
 $l\sim \unicode[STIX]{x1D70C}\unicode[STIX]{x1D706}^{2}V_{max}\unicode[STIX]{x1D707}>R_{0}$, thus implying
 $We\,Ca<1$, where
 $Ca=\unicode[STIX]{x1D707}V_{max}/\unicode[STIX]{x1D70E}$ is the capillary number. Altogether, the range of speeds in which the staircase structures are observable is
 $$\begin{eqnarray}\displaystyle (\unicode[STIX]{x1D70E}/\unicode[STIX]{x1D70C}R_{0})^{1/2}<V_{max}<(\unicode[STIX]{x1D70E}^{2}/\unicode[STIX]{x1D70C}\unicode[STIX]{x1D707}R_{0})^{1/3}, & & \displaystyle\end{eqnarray}$$
where each of the (lower and upper) limits would correspond in the drop impact on solid experiments to the transition to spreading (figure 26a) and ‘fried egg’ (figure 26c) regimes, respectively. In our case, equation (4.2) furnishes  $O(0.1)~\text{m}~\text{s}^{-1}<V_{max}<O(1.0)~\text{m}~\text{s}^{-1}$, which indeed explains the existence of the patterns in figure 5 at the measured
 $V_{max}=1.47~\text{m}~\text{s}^{-1}$.
Ejecta pattern in DI water. The drop volume, initial energy, maximum velocity and deflection of the stainless steel membrane and membrane thickness were  $50~\unicode[STIX]{x03BC}\text{l}$, 390 J,
 $2.21~\text{m}~\text{s}^{-1}$, 0.45 mm and 0.5 mm, respectively. Physical image size is
 $11.0\times 5.3~\text{mm}^{2}$.

To understand the transition from the ripple waves in figure 5 to ejecta in figure 6, note that the capillary waves generated on the drop surface have a wavelength comparable to the respective membrane deflection. Since the wavenumber corresponding to the minimum wave speed in our case is  $k_{m}=(\unicode[STIX]{x1D70C}g/\unicode[STIX]{x1D70E})^{1/2}\approx 400~\text{m}^{-1}$, so that the wavelength
 $\unicode[STIX]{x1D706}_{m}=2\unicode[STIX]{x03C0}/k_{m}\sim 1~\text{cm}$, and we therefore operate in the limit
 $k/k_{m}\gg 1$, then the phase speed is
 $c_{p}\sim (\unicode[STIX]{x1D70E}k/\unicode[STIX]{x1D70C})^{1/2}\approx 0.6{-}1.8~\text{m}~\text{s}^{-1}$ for the impulse intensities in figures 5 and 6, which is in the range of
 $V_{max}=1.47{-}2.21~\text{m}~\text{s}^{-1}$ reported in these figures based on direct measurements. Hence it is the hydraulic jump which is responsible for the ripple wave to ejecta transition in the same way as SWs are formed in the medium when the flow velocity exceeds the speed at which perturbations can propagate – acoustic as opposed to capillary waves in our case – so that faster fluid particles push the slower ones leading to wave steepening and eventually to ejecta.
4.2 Key crown regimes and transitions
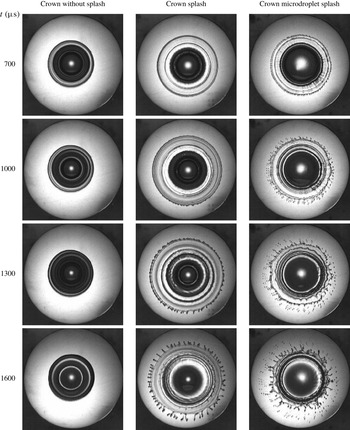
(a) Crown without splash of 80 wt% water–glycerol solution. (b) Crown with splash of 10 wt% water–sucrose solution. (c) Microdroplet crown splash of 35 wt% water–ethanol solution. In all cases the initial energy and membrane thickness were 1000 J and 0.5 mm, respectively; drop volume in (a,b) was  $50~\unicode[STIX]{x03BC}\text{l}$ and in (c)
 $100~\unicode[STIX]{x03BC}\text{l}$. Frame size and rate were
 $256\times 256$ pixels and 10 000 f.p.s., respectively; physical image size is
 $20.6\times 16.1~\text{mm}^{2}$. Since the interrogation window was fixed in space, the images show the actual motion of the pedestal.

Upon increasing the impulse intensity  $E/h_{0}$ beyond that required for the ejecta regime, there were observed three types of crowns – no splash, splash and microdroplet splash – as illustrated by figures 7 and 28 in appendix B. While the no splash regime is characterized by an absence of secondary emitted droplets, the splash and microdroplet splash are demarked by the size of emitted droplets: in the latter case they are much smaller, of the order of tens of microns in diameter. It is also remarkable that the microdroplet crown regime exhibits an instability of the thin crown sheet, cf. figure 7(c). To study the crown rim radius
 $R$ change in the evolution process, the phenomena were recorded from top view using a semitransparent mirror placed at
 $45^{\circ }$ in between the target and the light source positioned vertically above the target. Also, to investigate the crown height
 $H$ variation, a set of recordings was performed from a side view.
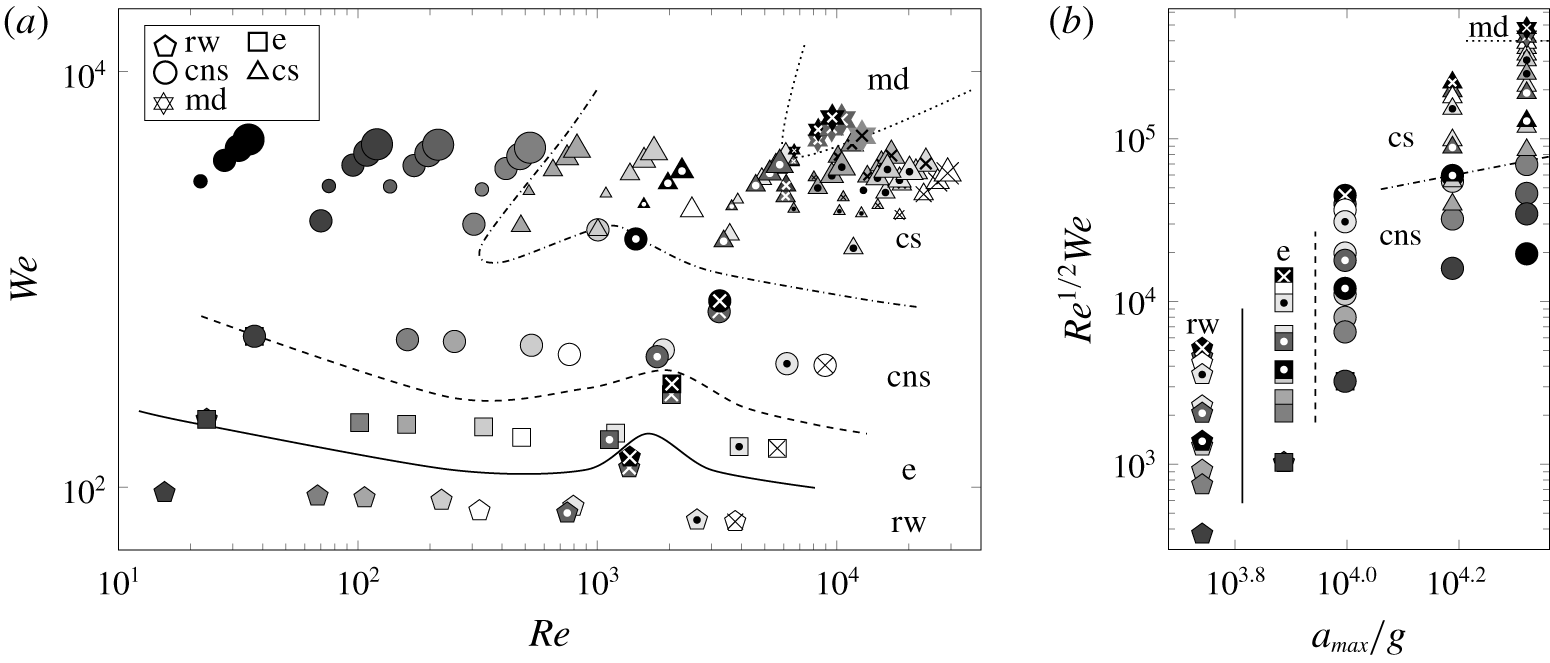
To study the effect of impact intensity and drop liquid properties, in the experiments presented in figure 8 various solutions were employed and the initial energy adjusted. The complete map of all the drop deformation regimes observed in our experiments is summarized in figure 8(a). While the energy and membrane thickness were varied in collecting all these data points, they are not exploited directly in plotting as both the  $We$ and
 $Re$ numbers are built from the associated membrane kinematics data controlled by the impulse intensity
 $E/h_{0}$, cf. figure 2. A map of the observed regimes in these experiments provided in figure 8(a) is replotted in figure 8(b) in terms of the splashing parameter
 $K\equiv Re^{1/2}We$, which puts the data in monotonic order with the microdroplet crown splash on the extreme side of the parameter
 $K$ value. Figure 8(b) also highlights the role of acceleration
 $a_{max}$ in organizing the transitions in a monotonic order: for the lowest magnitudes the regime is ripple waves, while for the largest magnitudes the regimes progress from crown without splash to microdroplet splash as
 $K$ increases for
 $a_{max}$ fixed. The complexity of the curves separating the regimes in figure 8(a) suggests that the
 $(We,Re)$-plane does not form appropriate coordinates as the transitions should be scalable, whereas the
 $(a_{max}/g,K)$ coordinates make the transition curves monotonic.
(a) Map of the impact intensity effect with dashed lines denoting transitions between regimes (to guide the eye); for the regime definitions refer to figure 3. The substrate was manufactured out of stainless steel of 0.5 mm thickness. Six liquids (67 wt% glycerol, 80 wt% glycerol, 90 wt% glycerol, 50 wt% sucrose, 22 wt% ethanol and DI water) in four different volumes were chosen for tests at five initial energies (250, 390, 500, 750 and 1000 J). Liquid drop volumes are denoted by relative symbol sizes: 
 $25~\unicode[STIX]{x03BC}\text{l}$,

 $50~\unicode[STIX]{x03BC}\text{l}$,

 $75~\unicode[STIX]{x03BC}\text{l}$,

 $100~\unicode[STIX]{x03BC}\text{l}$; concentrations by different shadings:
 45 wt% glycerol, 10 wt% sucrose, 2 wt% ethanol;
 67 wt% glycerol, 20 wt% sucrose, 6 wt% ethanol;
 75 wt% glycerol, 30 wt% sucrose, 12 wt% ethanol;
 80 wt% glycerol;
 88 wt% glycerol, 40 wt% sucrose, 22 wt% ethanol;
 90 wt% glycerol; ⚫ 99.5 wt% glycerol, 50 wt% sucrose, 35 wt% ethanol; type of solutions by different symbols: white ◯ – water, symbols with a black dot inside light shading
 and a white dot inside dark shading
 – sucrose solutions, simple symbols
 – glycerol solutions, symbols with a black cross inside light shading
 and a white cross inside dark shading
 – ethanol solutions. (b) Map of the impact intensity effect shown for the
 $50~\unicode[STIX]{x03BC}\text{l}$ liquid drop only (to avoid data cluttering) in terms of the splashing parameter
 $K$ and acceleration
 $a_{max}$ scaled by gravity
 $g$.

To conceive the origin and relevance of the splashing parameter  $K$ to our phenomena, let us consider an impulsively driven drop on a membrane in the large
 $We$ and
 $Re$ number regime neglecting the effects of compressibility, in analogy with the considerations by Josserand & Zaleski (Reference Josserand and Zaleski2003) for the impact of a drop on a liquid surface. We know that, depending upon physical conditions, two types of patterns may exist, with and without ejecta, as illustrated in figures 4(a) and 4(b). Since the viscous length scale
 $l_{\unicode[STIX]{x1D708}}=(\unicode[STIX]{x1D708}t)^{1/2}$, dictated by the solution of the first Stokes problem, exceeds the vertical one
 $V_{max}t$ for
 $t<t_{\unicode[STIX]{x1D708}}=\unicode[STIX]{x1D70F}_{0}Re^{-1}$ with
 $\unicode[STIX]{x1D70F}_{0}=R_{0}/V_{max}$, this defines a region of size
 $l_{\unicode[STIX]{x1D708}}$ near the jet neck, where the vorticity is concentrated. Hence, the jet thickness
 $h_{e}$, cf. figure 4(b), in the viscous stage must match the viscous length scale
 $h_{e}\simeq l_{\unicode[STIX]{x1D708}}$. Estimate of the jet velocity
 $v_{e}$ is amenable to a mass conservation analysis: mass coming from the deformed part of the drop due to impulsive motion of the membrane per unit time
 $\unicode[STIX]{x1D70C}V_{max}\unicode[STIX]{x03C0}r_{e}^{2}$ must be equal to the mass flux through the jet
 $2\unicode[STIX]{x03C0}\unicode[STIX]{x1D70C}r_{e}h_{e}v_{e}$, thus producing
 $v_{e}\simeq (t/\unicode[STIX]{x1D70F}_{0})^{-1/2}V_{max}Re^{1/2}$, which obviously diverges as
 $t\rightarrow 0$ in this incompressible flow analysis. When the jet forms, its rim recedes due to surface tension with the velocity (Taylor Reference Taylor1959; Culick Reference Culick1960)
 $$\begin{eqnarray}\displaystyle v_{TC}\simeq (2\unicode[STIX]{x1D70E}/\unicode[STIX]{x1D70C}h_{e})^{1/2}=(t/\unicode[STIX]{x1D70F}_{0})^{-1/2}V_{max}We^{-1/2}Re^{1/4}. & & \displaystyle\end{eqnarray}$$
If  $v_{TC}<v_{e}$, the jet length increases; if, on the other hand,
 $v_{TC}>v_{e}$, the jet cannot form. Therefore, a necessary condition for the jet formation is operating at large enough Weber numbers, which translates into
 $t/\unicode[STIX]{x1D70F}_{0}<K^{2}$, where
 $K=Re^{1/2}We$ is the splashing parameter originally identified experimentally by Stow & Hadfield (Reference Stow and Hadfield1981).
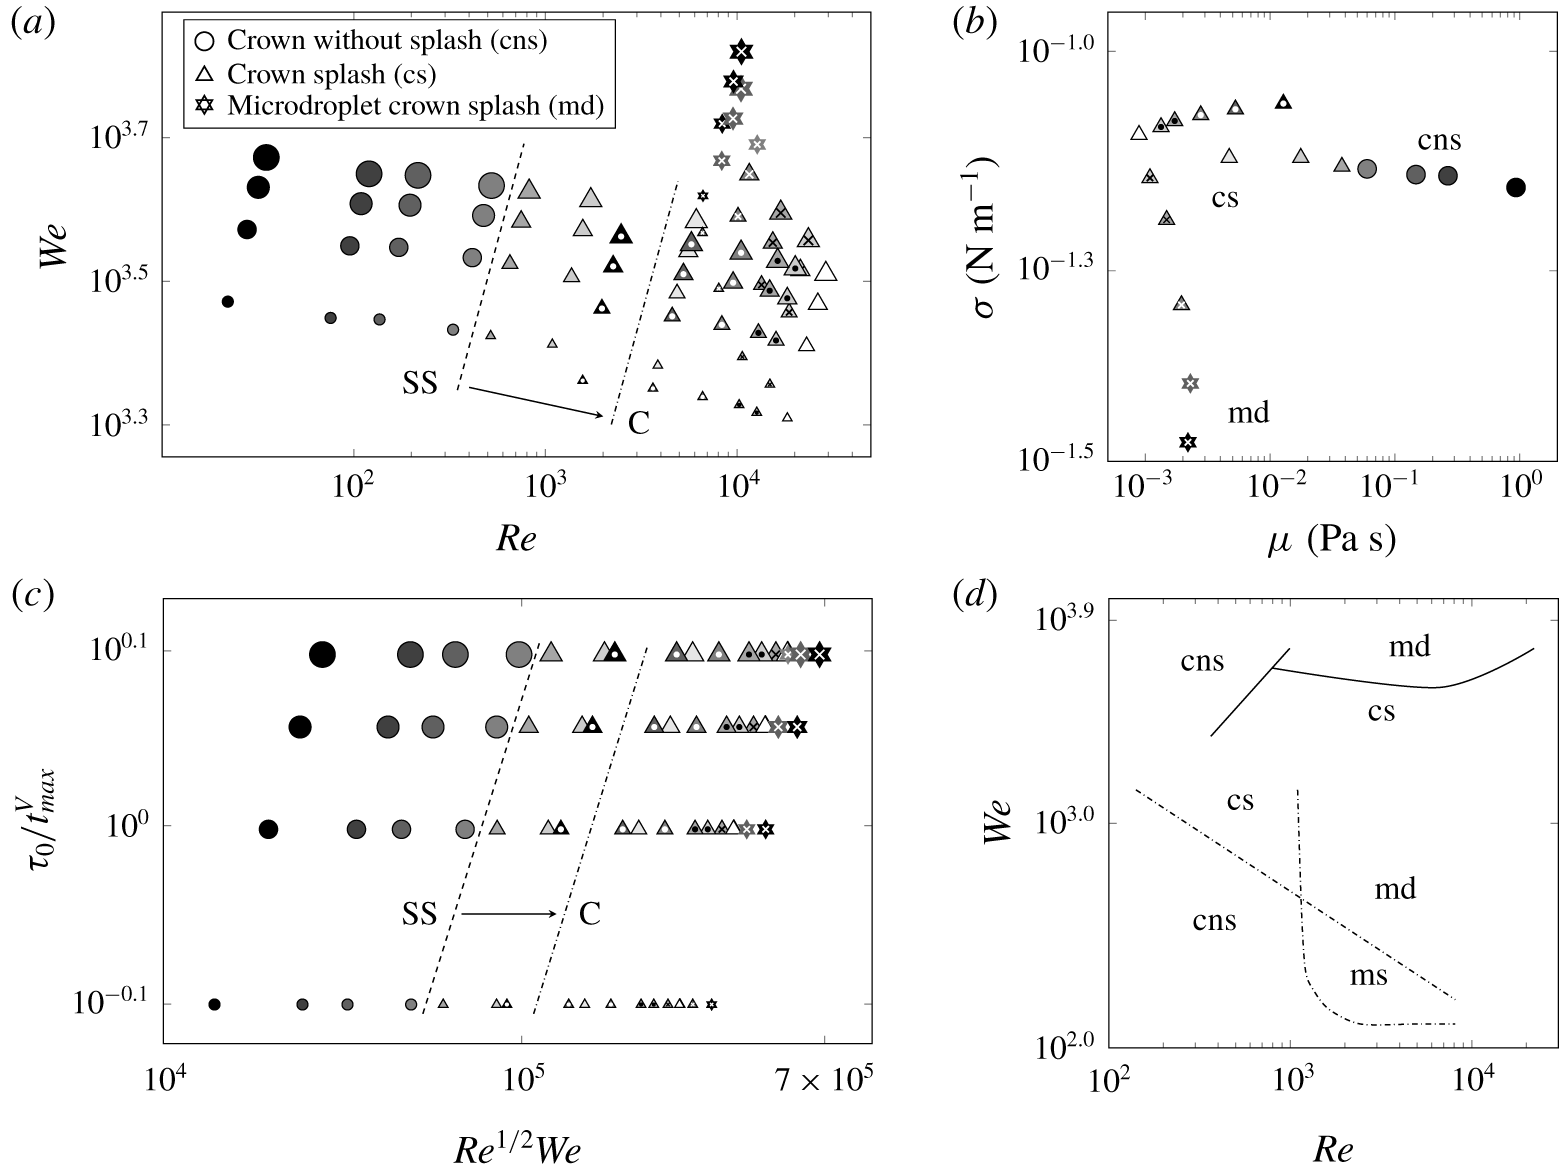
The compiled crown regime map is presented in figure 9(a). Effects of viscosity and surface tension are exemplified in figure 9(b), indicating that decreasing surface tension while keeping viscosity invariable brings us to the microdroplet splash regime, while increasing surface tension leads to the crown splash. Conversely, increasing viscosity while maintaining surface tension constant suppresses the splash leading to the crown without splash. Replotting figure 9(a) in terms of the splashing parameter  $K$ again organizes the data in a monotonic order, cf. figure 9(c). Comparison between the observed regimes and those in the drop impact on a thin liquid layer is presented in figure 9(d), demonstrating substantial qualitative and quantitative differences. While in the drop splash on a thin film (Deegan, Brunet & Eggers Reference Deegan, Brunet and Eggers2008) the transition from crown with splash to without splash happens at the boundary, which scales as
 $We\sim Re^{-1/2}$ similar to the splashing parameter criterion
 $K\gtrsim 3330$ in the drop splash on solid surface (Mundo, Sommerfeld & Tropea Reference Mundo, Sommerfeld and Tropea1995), in our case not only the value
 $K=3330$ is far exceeded, but this transition boundary also scales as
 $We\sim Re$ as per figure 9(a). That is, apparently, the splashing parameter
 $K=Re^{1/2}We$ varies along the transition boundary, cf. figure 9(c), which again indicates that not the velocity
 $V_{max}$, but the acceleration
 $a_{max}$ must be a governing parameter consistent with the earlier observation in figure 8(b). Also, considerably elevated values of
 $Re$ and
 $We$ required for crowns with splash to form in the impulsively driven drop experiments compared to those in drop impact on thin films, cf. figure 9(d), suggest that splashing is made more difficult in the case of an accelerating substrate – the effect seemingly analogous to the observation that it is harder to splash on soft substrates (Howland et al. Reference Howland, Antkowiak, Rafael Castrejón-Pita, Howison, Oliver, Style and Castrejón-Pita2016). However, the underlying physics is different: while in the latter case splashing is reduced due to energy losses in the deformed soft substrate, in our situation the splashing is affected, in particular, by the adhesion forces and the reduced drop inertia as not all the liquid is necessarily and immediately brought to motion with velocity
 $V_{max}$.
(a) Map of the observed crown regimes. Thickness of the stainless steel membrane and initial energy were fixed at 0.5 mm and 1000 J, respectively. The shift in the transition boundary between crown without splash and crown splash when the stainless steel (SS) substrate is replaced by copper (C) is indicated by the arrow and the location of a new transition. The liquid drop thermophysical properties were varied as per table 1 and volumes were 25, 50, 75 and  $100~\unicode[STIX]{x03BC}\text{l}$. The left-most set of data points scales as
 $We\approx 134.5Re$. (b) The transformation in the regimes due to viscosity and surface tension of the used liquids. (c) Map of the observed regimes in the non-dimensional time versus the splashing parameter
 $Re^{1/2}We$. (d) Regime boundary map. Solid lines correspond to the boundaries of regimes in the present study. Dashed lines correspond to the boundary of regimes reported by Deegan et al. (Reference Deegan, Brunet and Eggers2008) for drop impact on a thin film.

Next, using the time scales identified from a dimensional analysis (summarized in table 2 of appendix A), first note that the crown without splash in figure 3(cns) is characterized by the time scale  $\unicode[STIX]{x1D70F}_{a}^{\unicode[STIX]{x1D708}}=(\unicode[STIX]{x1D708}/a^{2})^{1/3}=O(10^{-5})\,\text{s}$ dictated by full dissipation of hydrostatic energy due to acceleration
 $a$ into heat, i.e.
 $\unicode[STIX]{x1D70C}al^{4}\sim \unicode[STIX]{x1D70F}\unicode[STIX]{x1D707}(V/l)^{2}l^{3}$ with
 $V\sim V_{\unicode[STIX]{x1D708}}^{l}\sim \unicode[STIX]{x1D708}/l$ and
 $\unicode[STIX]{x1D70F}\sim l/V_{\unicode[STIX]{x1D708}}^{l}$. These values of
 $\unicode[STIX]{x1D70F}_{a}^{\unicode[STIX]{x1D708}}$ imply that undulations driven, for example, by acceleration-induced instabilities (including those due to SW–free interface interactions leading to a Richtmyer–Meshkov instability) are suppressed by viscous dissipation because
 $\unicode[STIX]{x1D70F}_{a}^{\unicode[STIX]{x1D708}}\ll \unicode[STIX]{x1D70F}_{a}^{d}$, where
 $\unicode[STIX]{x1D70F}_{a}^{d}=(R_{0}/a)^{1/2}$ is the loading time scale it would take for a drop to be smashed by the membrane provided all other forces are negligible. Second, the time scale of full dissipation of the surface energy into heat is
 $\unicode[STIX]{x1D70F}_{\unicode[STIX]{x1D70E}}^{\unicode[STIX]{x1D708}}=\unicode[STIX]{x1D708}^{3}/\unicode[STIX]{x1D6FE}^{2}=O(10^{-5})\,\text{s}$, i.e. short-wave capillary undulations are quickly suppressed by viscous dissipation; here,
 $\unicode[STIX]{x1D6FE}\equiv \unicode[STIX]{x1D70E}/\unicode[STIX]{x1D70C}$. To find
 $\unicode[STIX]{x1D70F}_{\unicode[STIX]{x1D70E}}^{\unicode[STIX]{x1D708}}$ note that from the normal dynamic boundary condition at the free interface we find
 $\unicode[STIX]{x1D70E}/l\sim \unicode[STIX]{x1D707}V/l$, which for the velocity change due to viscosity
 $V\sim V_{\unicode[STIX]{x1D708}}^{l}\sim \unicode[STIX]{x1D708}/l$ over some distance
 $l$ yields the length scale
 $l_{\unicode[STIX]{x1D70E}}^{\unicode[STIX]{x1D708}}$ which can be interpreted as follows. If surface energy equilibrates with the viscous dissipation
 $\unicode[STIX]{x1D70E}l^{2}\sim \unicode[STIX]{x1D70F}\unicode[STIX]{x1D707}(V/l)^{2}l^{3}$, where we estimated the viscous dissipation rate as
 $\text{d}E/\text{d}t\sim \unicode[STIX]{x1D707}|\unicode[STIX]{x1D735}\boldsymbol{v}|^{2}\times \text{Volume}$ and took
 $V\sim V_{\unicode[STIX]{x1D708}}^{l}\sim \unicode[STIX]{x1D708}/l$ along with
 $\unicode[STIX]{x1D70F}\sim l/V_{\unicode[STIX]{x1D708}}^{l}$, then
 $l=l_{\unicode[STIX]{x1D70E}}^{\unicode[STIX]{x1D708}}$ is the length scale at which surface energy completely dissipates into heat (namely, we take the initial state at rest,
 $V=0$, deform the liquid body of size
 $l_{\unicode[STIX]{x1D70E}}^{\unicode[STIX]{x1D708}}$ and then surface tension returns the liquid body into an equilibrium shape dissipating energy into heat). Also
 $l_{\unicode[STIX]{x1D70E}}^{\unicode[STIX]{x1D708}}$ shows the thickness of the layer where the velocity defect
 $V_{\unicode[STIX]{x1D70E}}^{\unicode[STIX]{x1D708}}=l_{\unicode[STIX]{x1D70E}}^{\unicode[STIX]{x1D708}}/\unicode[STIX]{x1D70F}_{\unicode[STIX]{x1D70E}}^{\unicode[STIX]{x1D708}}=\unicode[STIX]{x1D6FE}/\unicode[STIX]{x1D708}$, i.e. when the velocity changes from that in the bulk to the interface, is observed. The associated time scale
 $\unicode[STIX]{x1D70F}_{\unicode[STIX]{x1D70E}}^{\unicode[STIX]{x1D708}}=l_{\unicode[STIX]{x1D70E}}^{\unicode[STIX]{x1D708}}/V_{\unicode[STIX]{x1D70E}}^{\unicode[STIX]{x1D708}}$ is the time required for the surface energy to fully dissipate into heat. In the crown without splash regime viscous dissipation effects on the capillary-induced undulations and velocity defects persist to later times as suggested by the time scale
 $\unicode[STIX]{x1D70F}_{\unicode[STIX]{x1D70E}}^{\unicode[STIX]{x1D708},d}=\unicode[STIX]{x1D708}R_{0}/\unicode[STIX]{x1D6FE}=O(10^{-3})\,\text{s}$ it takes for the velocity defect
 $\unicode[STIX]{x1D6FE}/\unicode[STIX]{x1D708}$ to propagate through the drop of size
 $R_{0}$ compared to that of
 $\unicode[STIX]{x1D70F}_{\unicode[STIX]{x1D70E}}^{\unicode[STIX]{x1D708}}$ required to propagate through a boundary layer
 $l_{\unicode[STIX]{x1D70E}}^{\unicode[STIX]{x1D708}}$. This explains why the crown stays smooth, despite that dissipation of inertia into heat on the drop length scale
 $R_{0}$ is still too slow since
 $\unicode[STIX]{x1D70F}_{\unicode[STIX]{x1D708}}^{d}=R_{0}^{2}/\unicode[STIX]{x1D708}\sim O(10^{-1})\,\text{s}$.
4.3 On the crown formation: basic physical processes
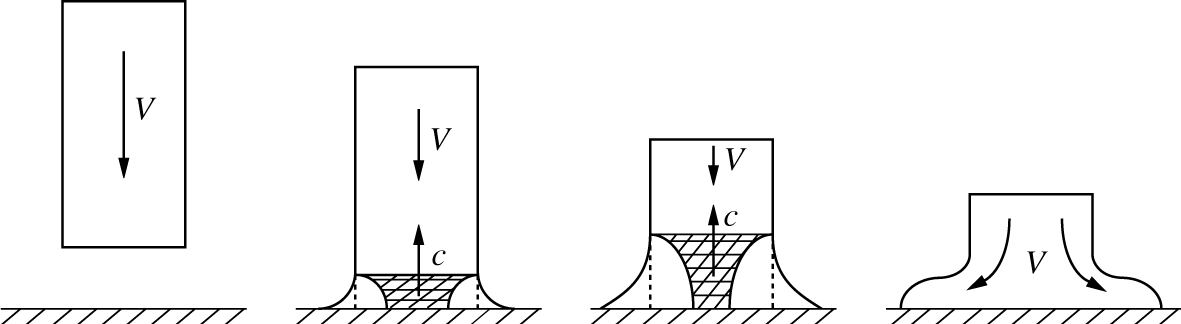
In addition to the hydraulic jump phenomena leading to ejecta as a precursor of the crown formation discussed in § 4.1, to elucidate further the origin of the various observed drop deformation regimes, let us start with the simpler, seemingly naive, question as to why a drop spreads out in sidewise motion, cf. figure 4(b). To that end we consider first a simpler situation when a liquid cylinder of radius  $r$ strikes a rigid solid as in figure 10. First, using Newton’s second law the characteristic pressure experienced in the course of collision is determined from the fact that the mass
 $\unicode[STIX]{x1D70C}\unicode[STIX]{x03C0}r^{2}c\,\text{d}t$ accelerates in time
 $\text{d}t$, and thus the force acting during time
 $\text{d}t$ (momentum change) is
 $\unicode[STIX]{x1D70C}\unicode[STIX]{x03C0}r^{2}cV\,\text{d}t$, producing an initial water hammer pressure of the order of
 $\unicode[STIX]{x1D70C}cV$ (Joukowsky Reference Joukowsky1899; von Karman Reference von Karman1929), which is the same pressure as that in an acoustic wave (Landau & Lifshitz Reference Landau and Lifshitz1987). The application of this (von Karman’s) formula is justified as opposed to water hammer and drop impact experiments where entrapped air leads to the air cushioning effect lowering the impact pressures. The high pressures stem from the fact that when the entire area of the head of the cylinder impacts against the solid, only the liquid at the edge is free to flow initially, and thus the liquid at the centre remains compressed until reached by the release waves from the sides, cf. figure 10. As a result, the compressible effects are instrumental in the ability of the fluid initially moving in the direction of the membrane deflection to divert in the membrane plane. If the membrane is smooth, the initial energy can be converted into a radial flow on the surface, in which case a crown fails to form unless the resistance of the surrounding air impedes the radial flow of the liquid (Yakimov Reference Yakimov1973).
Impact of a liquid cylinder on solid surface with the shaded areas denoting the liquid still under compression, which is a corrected version due to Gonor & Rivkind (Reference Gonor and Rivkind1982) of that originally given by Bowden & Field (Reference Bowden and Field1964): the interface of the released liquid should not be convex, but concave as shown here. Envelope of the pressure release wavelets, which travel inward from the sides at velocity  $c$, gives a curved wave front, and the released liquid flows out at velocity
 ${\sim}V$ as per the solution of the wave equation for the liquid cylinder impacting with a membrane developed by Konenkov (Reference Konenkov1975).

From § 4.2 one may have made a remarkable observation that due to a well-developed crown wall (also sometimes termed a Peregrine sheet) the splashes occurring in the impulse-driven drops are more typical of crowns in the drop impacts on (thicker) films (Worthington Reference Worthington1895; Wang & Chen Reference Wang and Chen2000; Deegan et al. Reference Deegan, Brunet and Eggers2008) rather than on solids (Worthington Reference Worthington1877a,Reference Worthingtonb; Rioboo, Tropea & Marengo Reference Rioboo, Tropea and Marengo2001; Liu et al. Reference Liu, Vu, Yoon and Jepsen2010). To further compare and contrast an impulsively driven drop on a membrane with drop impact on a solid, let us consider the basic sequence of events with a particular focus on the accelerations experienced by the liquid in both cases, cf. figure 11. First, when the membrane is being accelerated upwards ( $a>0$), the liquid drop flattens into a ‘pancake’ under the action of a suddenly enhanced hydrostatics (figure 11a). It is at this stage that the water hammer pressure
 $p\sim \unicode[STIX]{x1D70C}V_{max}c$ is experienced by the drop. The pancake thickness
 $\unicode[STIX]{x1D702}$, under the equilibrium conditions
 $a=\text{const}$, would be determined by the balance of hydrostatic and surface energies
 $\unicode[STIX]{x03C0}R^{2}\unicode[STIX]{x1D702}\frac{1}{2}\unicode[STIX]{x1D702}\unicode[STIX]{x1D70C}a\sim 2\unicode[STIX]{x03C0}R^{2}\unicode[STIX]{x1D70E}$, i.e. the capillary length
 $\unicode[STIX]{x1D702}\sim 2(\unicode[STIX]{x1D70E}/\unicode[STIX]{x1D70C}a)^{1/2}$, which is
 $O(10^{-4}{-}10^{-5})\,\text{m}$ in our experiments and would result in substantial size pancakes. However, since the acceleration
 $a$ is impulsive, due to inertia the drop does not have time to flatten to such an extent. Next, at the stage of deceleration (
 $a<0$), which is important only in the crown regimes as in the higher impulse intensity cases (§ 5) the drop attains independence from the membrane, the liquid inertia together with the friction at the contact line and resistance of the surrounding air lead to the pancake deflection at its edge, i.e. ejecta formation which moves at some angle to the substrate. The fluid mass flux into the ejecta continues as the membrane moves downward leading to the crown formation – the twofold role of surface tension in this process is remarkable: on the one hand it tends to pull the ejecta back into the pancake, while on the other hand, by retaining the connection of the ejecta to the pancake, it provides the channel for the inertia to keep feeding fluid into the growing ejecta. The origin of ejecta can also be understood from the fact that the substrate vertical displacement necessarily moves the fluid upwards with velocity
 $V$, while the built up pressure
 $p\sim \unicode[STIX]{x1D70C}Vc$ at the centre of the drop contact with the membrane pushes the fluid sidewise. This explains why the ejecta travels with the speed
 $v_{e}$ exceeding that of impact
 $V_{max}$, e.g. for the impact conditions in figure 12(a,b) (45 wt% glycerol solution)
 $V_{max}\approx 9~\text{m}~\text{s}^{-1}$, while
 $v_{e}\approx 17~\text{m}~\text{s}^{-1}$. The same effect (
 $v_{e}>V_{max}$) also occurs in the drop impact on a liquid layer (Thoroddsen Reference Thoroddsen2002).
Sequence of events illustrating the crown formation (a) relative to the membrane motion in the impulse-driven drop and (b) relative to the stationary solid surface in the drop impact experiments.

In the case of impact of a drop of radius  $R_{0}$ onto a solid with velocity
 $V$ (figure 11b), the liquid first experiences crashing (
 $a>0$), which flattens it similar to the drop on membrane, and water hammer pressure
 $p\sim \unicode[STIX]{x1D70C}Vc$ develops. In the absence of an air phase, the deceleration
 $a$ during crashing is dictated by the liquid compressibility
 $a\sim cV/R_{0}$. However, in reality, this deceleration is substantially reduced and the time instant of its maximum value
 $a_{max}$ is varied due to air trapped between the drop and solid surfaces, as is also known in water impact experiments (Mayer & Krechetnikov Reference Mayer and Krechetnikov2018). Thus the time scale of acceleration
 $a(t)$ in the drop impact is determined by air cushioning, while in the impulse-driven drop it is set by the impulse intensity
 $E/h_{0}$ and the membrane natural frequency
 $\unicode[STIX]{x1D714}_{M}$ (cf. § 2 and appendix C).
4.4 Effects of viscosity and surface tension on the crown dynamics
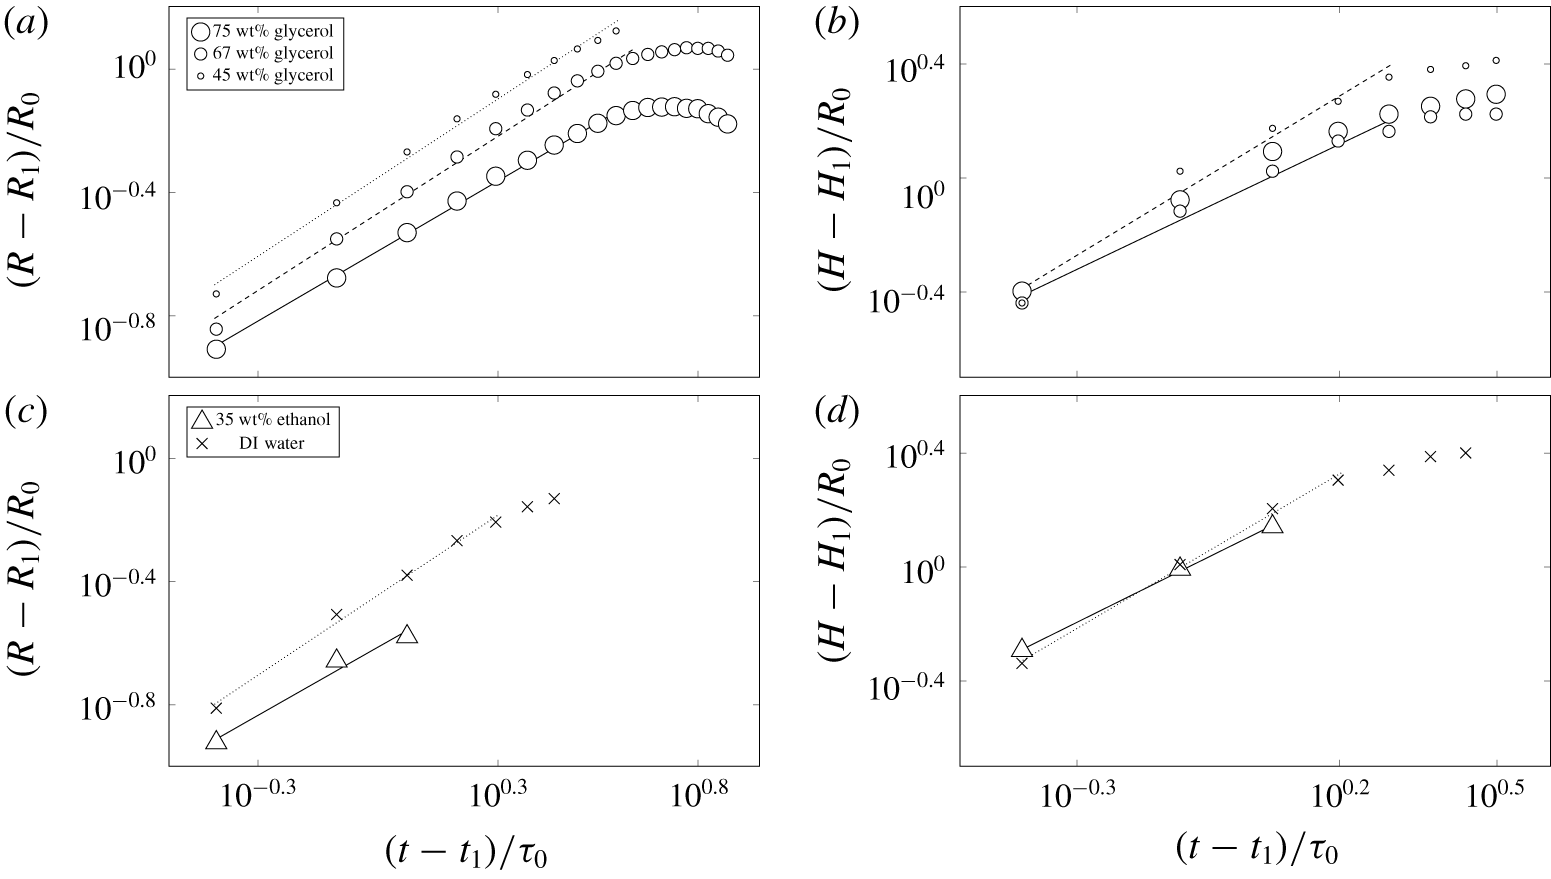
Log–log plots of non-dimensional rim radius (a,c) and height (b,d) versus non-dimensional time for water–glycerol solutions (a,b), and 35 wt% water–ethanol and DI water (c,d). Recording of the crown radius was terminated at the disintegration of the crown wall. In the cases when the crown radius evolution with respect to time is non-monotonic (a), data fits were performed up to the end of the monotonic regime before reaching the maximum radius. For the crown height measurement, data were recorded up to the end of the first impact period, cf. figure 11(a). The thickness of the stainless steel membrane, initial energy and liquid drop volume were fixed and equal to 0.5 mm, 1000 J and  $50~\unicode[STIX]{x03BC}\text{l}$, respectively. In (a,b) patterns are cs for all concentrations, in (c,d) cs for DI water and md for 35 wt% water–ethanol solutions. All curves are shifted to the origin by subtracting first data point (
 $t_{1}/\unicode[STIX]{x1D70F}_{0}$,
 $R_{1}/R_{0}$ and
 $H_{1}/R_{0}$) in each set. The crown height dynamics is shown only up the maximum point since after that the membrane is in its second oscillation.

To study quantitative changes of the crown radius  $R$ and height
 $H$, an image processing code was developed to automatically detect the edge. To investigate changes in the radius of the crown, we used the top view (cf. appendix B). Figure 12 reflects a representative choice of liquid mixtures and impulse intensities leading to the crown regimes. To clarify the effects of viscosity and surface tension in the stage of crown evolution, changes of the non-dimensional rim radius with respect to non-dimensional time are demonstrated in figure 12(a,c) and of the crown height – the distance from the rim edge to the substrate – in figure 12(b,d). While in the crown radius measurements we extracted data until the complete collapse of the crown wall, the crown height trajectory was measured up to reaching its maximum, since we analysed the crown dynamics only in the first impact period, cf. figure 11(a). The subsequent crown height decrease is, in part, due to upward substrate movement (second oscillation of the membrane). Notably, figure 12(d) shows substantial variation in achieved maxima between water and ethanol as opposed to figure 12(b) for glycerol solutions – this difference in behaviour must be due to surface tension, which varies substantially in the former case.
Data acquired from experiments seem to follow a power law, but simple plotting in log–log axes would not work as the fit function  $f=at^{b}$ is applicable only when the data either pass through the origin or behave hyperbolically, i.e. when
 $b<0$. Therefore, only after shifting to the origin by subtracting the first data point from each data set, data were fitted with a power-law function
 $f=at^{b}$, where the values of
 $a$ and
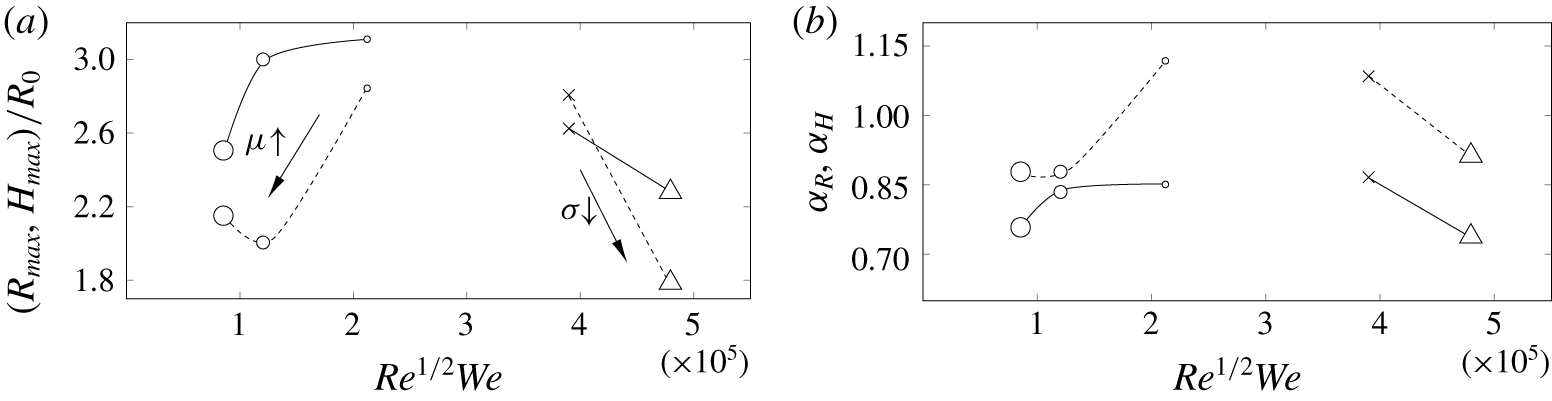
 $b$ are found through the least square fit procedure. Fittings in figure 12(a,c) were performed for the data points that follow the power-law behaviour. Similarly, in figure 12(b,d) fittings were performed before the bend at the end of each data set. It is notable that for the reported high energy impulse (1000 J), as per figure 13(b), radius
 $R(t)\sim t^{\unicode[STIX]{x1D6FC}_{R}}$ evolves closer to a linear fashion (
 $\unicode[STIX]{x1D6FC}_{R}=1$), characteristic of a ballistic regime as predicted by Peregrine (Reference Peregrine1981), although in a different context of drop impact on a solid surface. With increase of viscosity or decrease of surface tension
 $\unicode[STIX]{x1D6FC}_{R}$ reduces closer to
 $1/2$ suggested empirically by Yarin & Weiss (Reference Yarin and Weiss1995) in the drop impact experiments. The ballistic limit comes simply from the horizontal trajectory of the ejected fluid particles (with non-zero initial velocity
 $U_{0}$) in the gravity field, when other forces are negligible. As for the limit
 $\unicode[STIX]{x1D6FC}_{R}=1/2$, it can be explained by the dynamics of the liquid sheet, whose mass grows with time: increasing inertia of the crown liquid sheet slows its evolution. As a model, let us consider a 1-D liquid sheet of thickness
 $h_{\infty }$ at the rim of which there is a blob of mass
 $M_{r}(t)=M_{r0}+\unicode[STIX]{x1D70C}h_{\infty }x(t)$, i.e. growing with time due to accumulation of the film mass as it travels a distance
 $x(t)$ from the initial position
 $x(0)=0$. This growth may be due to surface tension forces pulling the blob towards the sheet as in the retracting soap film problem (Taylor Reference Taylor1959; Culick Reference Culick1960) and/or due to mass flux into the ejecta because of the splash as in the drop impact. Newton’s second law then leads to the following initial value problem:
 $$\begin{eqnarray}\displaystyle \frac{\text{d}}{\text{d}t}\left[M_{r}(t)\frac{\text{d}x}{\text{d}t}\right]=2\unicode[STIX]{x1D70E};\quad x(0)=0,\quad \frac{\text{d}x}{\text{d}t}(0)=U_{0}, & & \displaystyle\end{eqnarray}$$
the solution of which is  $x(t)=[-M_{r0}+(M_{r0}^{2}+2\unicode[STIX]{x1D70C}h_{\infty }M_{r0}U_{0}t+v_{TC}^{2}t^{2}\unicode[STIX]{x1D70C}^{2}h_{\infty }^{2})^{1/2}]/\unicode[STIX]{x1D70C}h_{\infty }$, reducing to the form assumed by Yarin & Weiss (Reference Yarin and Weiss1995) if
 $\unicode[STIX]{x1D70E}=0$. Also, if
 $t\gg M_{r0}/(\unicode[STIX]{x1D70C}h_{\infty }U_{0})$, the trajectory reduces to a power law with
 $\unicode[STIX]{x1D6FC}_{R}=1/2$. Therefore, decreasing surface tension, by replacing a water drop with a 35 %-ethanol one, makes
 $\unicode[STIX]{x1D6FC}_{R}$ decrease as in figure 13(b). If, on the other hand,
 $M_{r0}$ is negligible, then
 $x(t)\sim v_{TC}t$, i.e.
 $\unicode[STIX]{x1D6FC}_{R}=1$, in consonance with Taylor (Reference Taylor1959) and Culick (Reference Culick1960).
(a) Maximum non-dimensional radius  $R_{max}$ (solid) and height
 $H_{max}$ (dashed) achieved during the process of crown evolution versus
 $Re^{1/2}We$. (b) Exponents
 $\unicode[STIX]{x1D6FC}_{R}$ and
 $\unicode[STIX]{x1D6FC}_{H}$ are the powers of the fitted curves to non-dimensional radius
 $\hat{R}\equiv R/R_{0}=\hat{R}_{1}+\unicode[STIX]{x1D6FD}_{R}(\hat{t}-\hat{t}_{1})^{\unicode[STIX]{x1D6FC}_{R}}$ and height
 ${\hat{H}}\equiv H/R_{0}={\hat{H}}_{1}+\unicode[STIX]{x1D6FD}_{H}(\hat{t}-\hat{t}_{1})^{\unicode[STIX]{x1D6FC}_{H}}$ in figure 12; here
 $\hat{t}=t/\unicode[STIX]{x1D70F}_{0}$. The thickness of the stainless steel membrane, the initial energy and liquid drop volume were fixed and equal to 0.5 mm, 1000 J and
 $50~\unicode[STIX]{x03BC}\text{l}$, respectively. The symbols are identical to those defined in figure 12. Solid lines connect the data points for the crown radius and dashed ones for the crown height.

As follows from figure 12(a), increasing viscosity allows the rim radius  $R$ to reach a maximum value
 $R_{max}$ and then decrease with time. This non-monotonic crown regime (figure 14a) implies that after some time the radius of the lower part of the crown is larger than the rim radius. In the other cases the rim radius is monotonically increasing with time until the collapse of the crown wall (figure 14b). It should be mentioned that non-monotonic crowns are also observed for 80 wt%, 88 wt%, 90 wt% and 99.5 wt% water–glycerol solutions. At the physical level, the origin of the non-monotonic crowns is due to surface tension forces overcoming the liquid inertia and acting to minimize the crown surface area.
Evolution of the crown height  $H$ shown in figure 12(b,d), on the other hand, demonstrates a monotonic increase with time. To summarize the effects of viscosity and surface tension, maximum non-dimensional radius and height with respect to the splashing parameter
 $K$ are presented in figure 13(a). The glycerol solutions in figure 13 suggest a retarding effect of higher viscosities compared to the dynamics of lower viscosity liquids (water) operating in the ballistic regime, in which
 $\unicode[STIX]{x1D6FC}_{R}$ is closer to one, cf. figure 13(b). Lower surface tension of the 35 % ethanol solution also reduces
 $\unicode[STIX]{x1D6FC}_{R}$ and hence
 $R_{max}$ as well, which is explained by the model (4.4). Clearly, both viscosity and surface tension play a significant role in the crown dynamics.
Non-monotonic (a) and monotonic (b) crowns. Physical image size:  $12.6\times 5.3~\text{mm}^{2}$ (a) and
 $21.8\times 9.1~\text{mm}^{2}$ (b). In both cases initial energy, stainless steel membrane thickness and liquid drop volume were 1000 J, 0.5 mm and
 $50~\unicode[STIX]{x03BC}\text{l}$, respectively. Time sequence in (a) corresponds to an experiment with 99.5 % glycerol and (b) to 10 wt% water–sucrose solution.

4.5 Wettability effects
The use of different substrates enabled the study of wettability effects quantified here by the static contact angle  $\unicode[STIX]{x1D703}$, cf. table 1. Observation of different regimes for stainless steel and copper membranes at the same
 $We$ and
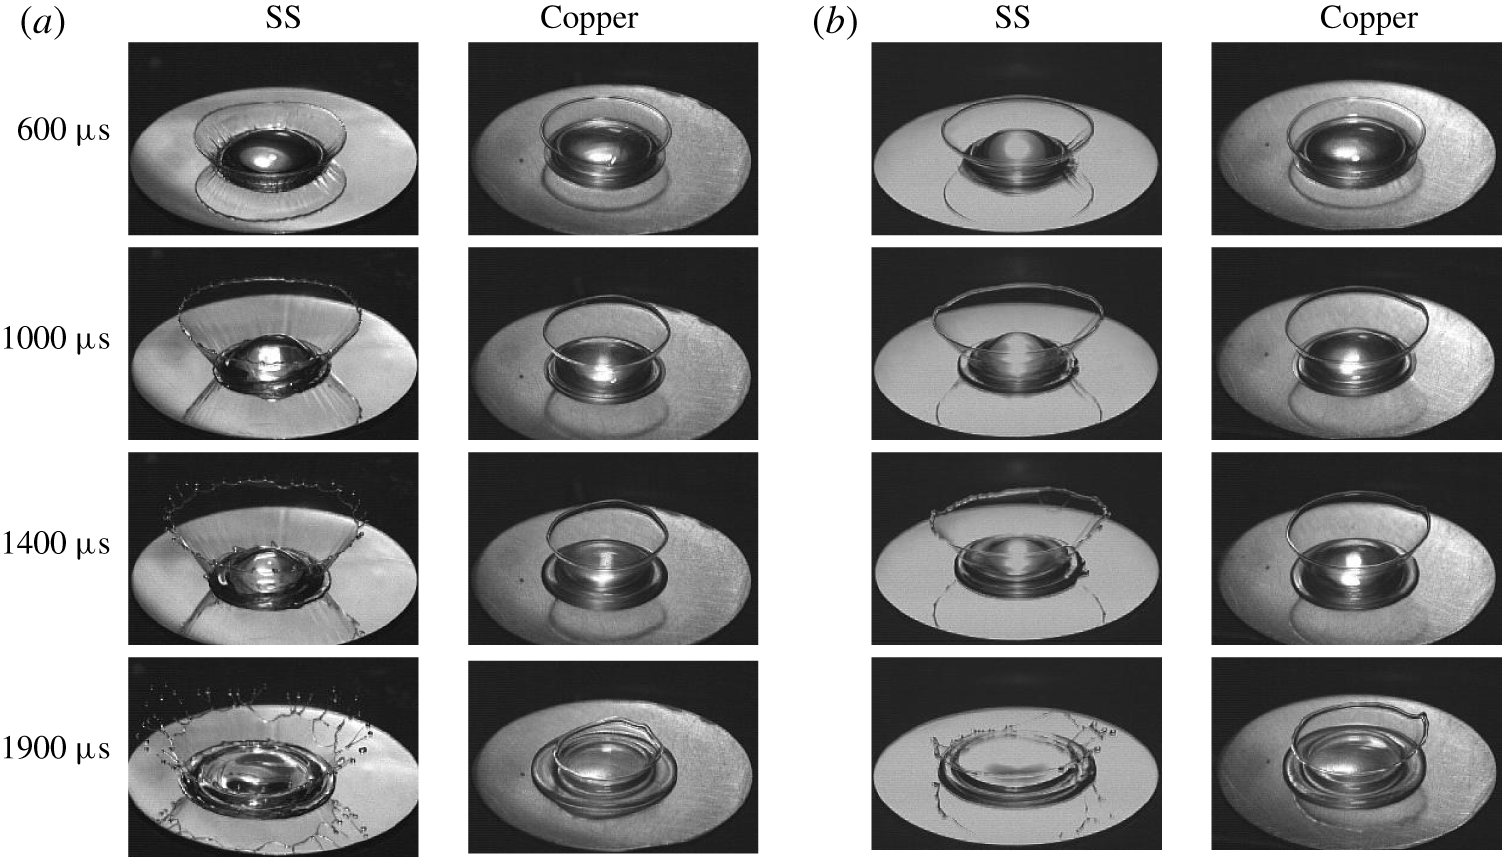
 $Re$ numbers indicates a remarkable dependence on the wetting properties of the substrate (membrane) if one compares figures 8(a) and 17(a). Figure 9(a,c) demonstrates a noticeable shift of the transition boundary between crown with and without splash regimes when substrate material changes from stainless steel to copper. Also, experiments showed that increasing the static contact angle
 $\unicode[STIX]{x1D703}$ in the microdroplet crown regime drives away from this regime towards the crown with splash regime. Next, figure 15 illustrates the effect of the static contact angle on the crown formation pattern for two liquids: 75 wt% water–glycerol and 50 wt% water–sucrose. The reason for choosing these two solutions is a considerable difference in their contact angle being
 ${<}90^{\circ }$ on the stainless steel substrate (
 $71^{\circ }$ for 75 wt% water–glycerol and
 $86^{\circ }$ for 50 wt% water–sucrose) compared with
 ${>}90^{\circ }$ on the copper substrate (
 $103^{\circ }$ for 75 wt% water–glycerol and
 $103^{\circ }$ for 50 wt% water–sucrose), cf. table 1. On the stainless steel substrate, the crown reaches a larger maximum radius compared to the same liquid on the copper substrate, cf. figure 15. Also, on the stainless steel substrate the crown splashes while on the copper substrate it does not. Since, except for the substrate material, all experimental conditions are the same, the difference in the contact angles is deemed responsible for the observed effects. The underlying physical reasons proved to follow from the distinction in the compressible processes at the initial stage of the drop deformation depending upon the contact angle being smaller or larger than
 $90^{\circ }$, as will be discussed in § 5.2.
The effect of contact angle on the crown formation pattern. Figure (a) corresponds to 75 wt% water–glycerol and (b) to 50 wt% water–sucrose solutions. Left and right columns in each figure show crown evolution on stainless steel and copper substrate, respectively. Thickness of the membrane, initial energy of the capacitors and liquid drop volume were fixed and equal to 0.5 mm, 1000 J and  $50~\unicode[STIX]{x03BC}\text{l}$, respectively. Physical image size is
 $20.3\times 13.4~\text{mm}^{2}$.

It should be mentioned that the effect of wetting on splashing characteristics has been observed in other situations such as impact of spheres studied by Duez et al. (Reference Duez, Ybert, Clanet and Bocquet2007), who established a dependence between a threshold impact velocity for air entrainment and the wetting contact angle. Despite the fact that the contact angle is dictated by microscopic phenomena, the latter have an effect on the macroscopic behaviour of the problem, in particular global splashing characteristics as in our case.
5 Results: drop disintegration regimes
5.1 Key disintegration regimes and transitions
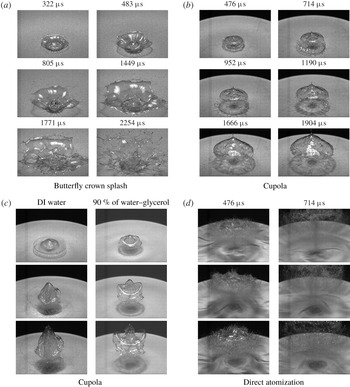
(a) Butterfly crown splash pattern observed for 67 wt% water–glycerol solution. The drop volume, initial energy and membrane thickness were  $50~\unicode[STIX]{x03BC}\text{l}$, 390 J and 0.17 mm, respectively. Physical image size is
 $37.2\times 25.1~\text{mm}^{2}$. (b) Cupola pattern in 50 wt% water–sucrose solution. The drop volume, initial energy and membrane thickness were
 $50~\unicode[STIX]{x03BC}\text{l}$, 500 J and 0.17 mm, respectively. Physical image size is
 $47.0\times 31.7~\text{mm}^{2}$. (c) Cupola patterns observed in different experiments. First to third rows correspond to 476, 714 and
 $952~\unicode[STIX]{x03BC}\text{s}$, respectively. In both cases the liquid drop volume, initial energy and membrane thickness were
 $50~\unicode[STIX]{x03BC}\text{l}$, 500 J and 0.1 mm, respectively. Physical image size is
 $47.0\times 35.3~\text{mm}^{2}$. (d) Direct atomization patterns observed in different experiments: first to third rows correspond to DI water, 22 wt% water–ethanol and 67 wt% water–glycerol, respectively. In all cases the liquid drop volume, initial energy and membrane thickness were
 $50~\unicode[STIX]{x03BC}\text{l}$, 1000 J and 0.034 mm, respectively. Physical image size is
 $47.0\times 35.3~\text{mm}^{2}$.

Increasing the impulse intensity even more brings us to the drop disintegration regimes, in which we include butterfly crown splash (figure 16a) when more than half of the original drop disintegrates, as well as cupola (figure 16b,c) and direct atomization (figure 16d) both characterized by complete disintegration of the drop. The inhibiting effects of viscosity become especially pronounced in the most intense regime: as evidenced in the first column of figure 16(d), increasing the viscosity reduces the number of microdroplets in the early stages and consequently the drop breaks into microdroplets in the later stages. As noted by Kedrinskii et al. (Reference Kedrinskii, Makarov, van Doorn and Borel2005), on the one hand it is known that the presence of viscosity leads to the dissipation of energy in a liquid, but on the other hand it is still a lingering question what precisely alters in the structure of the flow as viscosity varies: e.g. compare the atomization patterns for different liquids in figure 16(d).
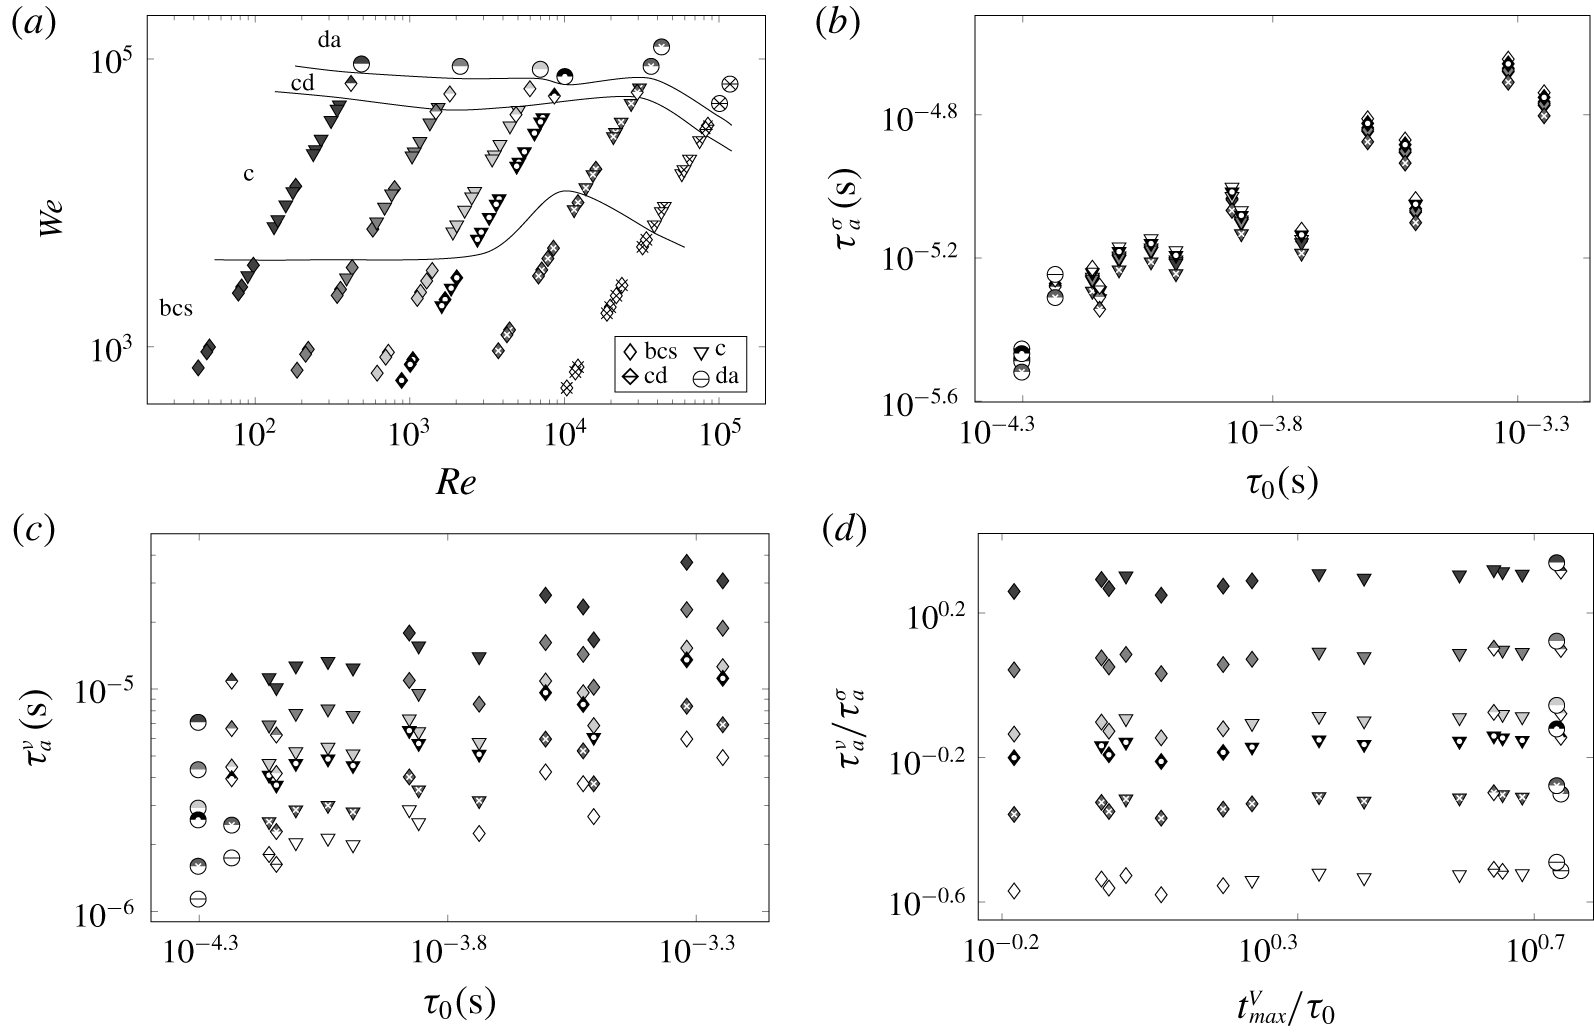
(a) Map of high intensity impulse cases when a liquid drop of volume  $50~\unicode[STIX]{x03BC}\text{l}$ was placed directly on the copper membrane (configuration 2 in figure 1a) of three different thicknesses (0.17, 0.1, 0.034 mm) agitated at five initial energies (250, 390, 500, 750 and 1000 J): patterns are identified by different symbols according to the legend. For the regime definitions and illustrations refer to figure 3; cd labels the cupola-to-direct atomization transition. The symbols and shadings used are identical to those defined in figure 8(a). DI water, 90 wt% water–glycerol, 80 wt% water–glycerol, 67 wt% water–glycerol, 50 wt% water–sucrose and 22 wt% water–ethanol solutions were employed. The corresponding time scale plots: (b)
 $\unicode[STIX]{x1D70F}_{a}^{\unicode[STIX]{x1D70E}}$ versus
 $\unicode[STIX]{x1D70F}_{0}$, (c)
 $\unicode[STIX]{x1D70F}_{a}^{\unicode[STIX]{x1D708}}$ versus
 $\unicode[STIX]{x1D70F}_{0}$, (d)
 $\unicode[STIX]{x1D70F}_{a}^{\unicode[STIX]{x1D708}}/\unicode[STIX]{x1D70F}_{a}^{\unicode[STIX]{x1D70E}}$ versus
 $t_{max}^{V}/\unicode[STIX]{x1D70F}_{0}$.

Next, let us apply the time scales following from a dimensional analysis (table 2 of appendix A) to the transitions in the higher impulse intensity regimes in figure 17(a). It transpires that both the viscous  $\unicode[STIX]{x1D70F}_{\unicode[STIX]{x1D708}}^{d}=R_{0}^{2}/\unicode[STIX]{x1D708}$ time scale required for viscous effects to propagate through the drop and the surface tension
 $\unicode[STIX]{x1D70F}_{\unicode[STIX]{x1D70E}}^{d}=(R_{0}^{3}/\unicode[STIX]{x1D6FE})^{1/2}$ time scale of small (so that the actual kinetic energy value is not relevant) oscillations of the drop do not play a role in our phenomena, because they are longer than the loading time scale
 $\unicode[STIX]{x1D70F}_{a}^{d}$;
 $\unicode[STIX]{x1D70F}_{\unicode[STIX]{x1D70E}}^{d}$ is also a period of capillary waves of wavelength
 $R_{0}$ driven by surface tension alone and, coincidentally, the RP instability time scale. This separation of time scales suggests that acceleration
 $a$ should be a governing variable, which leads to the time scale
 $\unicode[STIX]{x1D70F}_{a}^{\unicode[STIX]{x1D70E}}=(\unicode[STIX]{x1D6FE}/a^{3})^{1/4}$ of setting the period of small oscillations when kinetic energy magnitude is not important or, equivalently, of taking transfer hydrostatic energy (due to acceleration
 $a$) into surface energy (i.e.
 $\unicode[STIX]{x1D70C}al^{4}\sim \unicode[STIX]{x1D70E}l^{2}$ naturally yielding the associated capillary length
 $l=l_{a}^{\unicode[STIX]{x1D70E}}\sim (\unicode[STIX]{x1D6FE}/a)^{1/2}$ and time
 $\unicode[STIX]{x1D70F}_{a}^{\unicode[STIX]{x1D70E}}$ scales; notably,
 $\unicode[STIX]{x1D70F}_{a}^{\unicode[STIX]{x1D70E}}$ is also the RT instability time scale) and the time scale
 $\unicode[STIX]{x1D70F}_{a}^{\unicode[STIX]{x1D708}}=(\unicode[STIX]{x1D708}/a^{2})^{1/3}$ introduced earlier, plotted in figures 17(b) and 17(c), respectively. These figures, while indicating that both viscous
 $\unicode[STIX]{x1D70F}_{a}^{\unicode[STIX]{x1D708}}$ and surface tension
 $\unicode[STIX]{x1D70F}_{a}^{\unicode[STIX]{x1D70E}}$ time scales play a role in defining the transitions between the crown regimes, do not demonstrate a monotonic trend unless combined as in figure 17(d): using the ratios
 $\unicode[STIX]{x1D70F}_{a}^{\unicode[STIX]{x1D708}}/\unicode[STIX]{x1D70F}_{a}^{\unicode[STIX]{x1D70E}}$ and
 $t_{max}^{V}/\unicode[STIX]{x1D70F}_{0}$ brings in not only reasonably monotonic transitions from the butterfly crown splash to direct atomization through the successive intermediate regimes, but also shows that
 $\unicode[STIX]{x1D70F}_{0}=R_{0}/V_{max}$ is of the same order as the measured
 $t_{max}^{V}$ and thus is an appropriate parameter to be referred to throughout the discussion. The slight non-monotonic behaviour of
 $t_{max}^{V}$ in the inset of figure 2(b), which is due to the particularities of the membrane dynamics (while the pressure on the membrane
 ${\sim}E/h_{0}$ is monotonic along the abscissa in the inset of figure 2(b), the membrane response depends on
 $h_{0}$), proved to be crucial for organizing the data in figure 17(d) in a monotonic order.
Similar to the crown without splash regime, early stages of the butterfly crown splash and cupola, cf. figure 16(a–c), are characterized by short time scales  $\unicode[STIX]{x1D70F}_{a}^{\unicode[STIX]{x1D708}}=O(10^{-5})\,\text{s}$ purporting that undulations driven, for example, by acceleration-induced instabilities are suppressed by viscous dissipation. Also,
 $\unicode[STIX]{x1D70F}_{\unicode[STIX]{x1D70E}}^{\unicode[STIX]{x1D708}}=O(10^{-6})\,\text{s}$, i.e. short-wave capillary undulations are suppressed by viscous dissipation in the butterfly crown regime, but not in the cupola one since the liquid is fractured. As opposed to the crown without splash regime, in which viscous dissipation effects persist to later times as suggested by
 $\unicode[STIX]{x1D70F}_{\unicode[STIX]{x1D70E}}^{\unicode[STIX]{x1D708},d}=O(10^{-3})\,\text{s}$, this does not take place in the butterfly crown and cupola regimes. Notably, while hydrostatic (due to acceleration) energy is readily transferred into surface energy in all the regimes, since it happens on relatively short length scales
 $l_{a}^{\unicode[STIX]{x1D70E}}=O(10^{-5})\,\text{m}$ which are encountered only in the most impulse intense regimes, this process is relevant from the microdroplet generation regime onward, i.e. when small enough droplets are generated. The length scale
 $l_{a}^{\unicode[STIX]{x1D70E}}$ is analogous to
 $l_{V}^{\unicode[STIX]{x1D70E}}=\unicode[STIX]{x1D70E}/\unicode[STIX]{x1D70C}V^{2}$, which is the ratio of surface and kinetic energies, so if
 $l_{V}^{\unicode[STIX]{x1D70E}}\ll R_{0}$, then atomization takes place if permitted by other effects (e.g. if viscous dissipation is insignificant).
5.2 On the origin of cupola
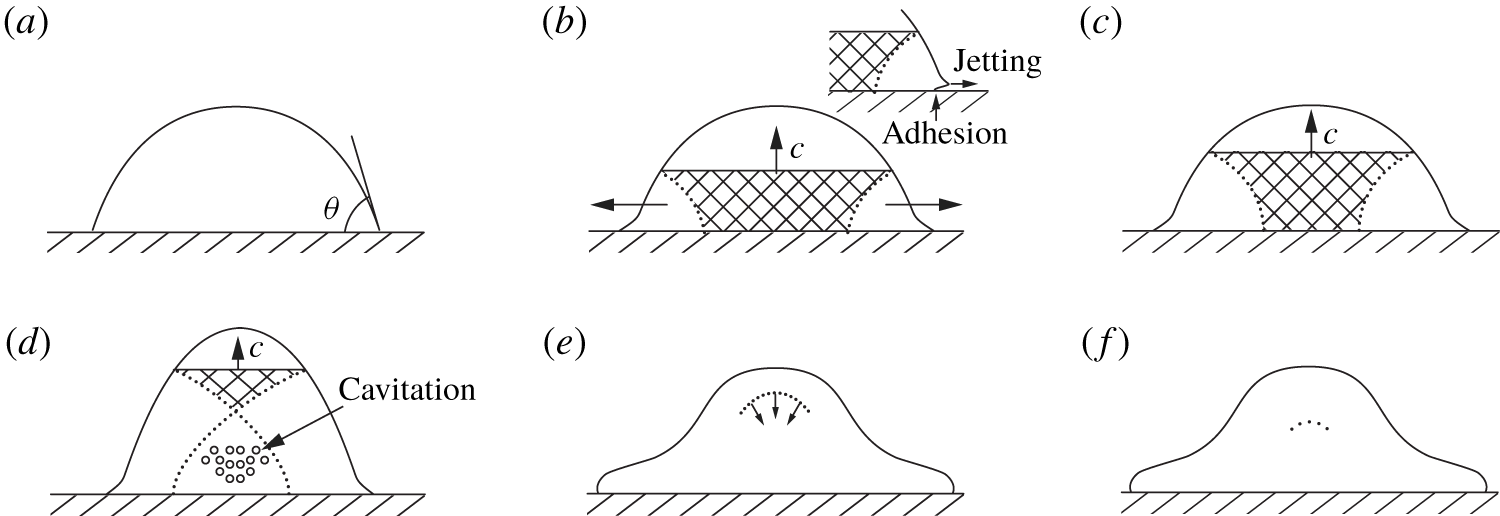
Early stages. While compressible effects proved to be instrumental in the initial stages of the drop deformation (§ 4.3), upon intensification of the driving impulse new compressible phenomena occur. Figure 18 develops a characteristic sequence of events as a SW created by a sudden motion of the membrane with speed  $V$ propagates through a drop sitting on a dry surface. Initially, the pressure and density in the water drop are dictated by the ambient pressure and the contact angle
 $\unicode[STIX]{x1D703}$, cf. figure 18(a). Immediately upon impact, a strong shock wave is created and moves upward, cf. figure 18(b), similar to that when a liquid cylinder strikes a rigid solid, cf. figure 10. The SW propagating in the drop compresses it. Next, depending upon the contact angle of the drop with the membrane, there are two possible scenarios. If the drop liquid is not wetting,
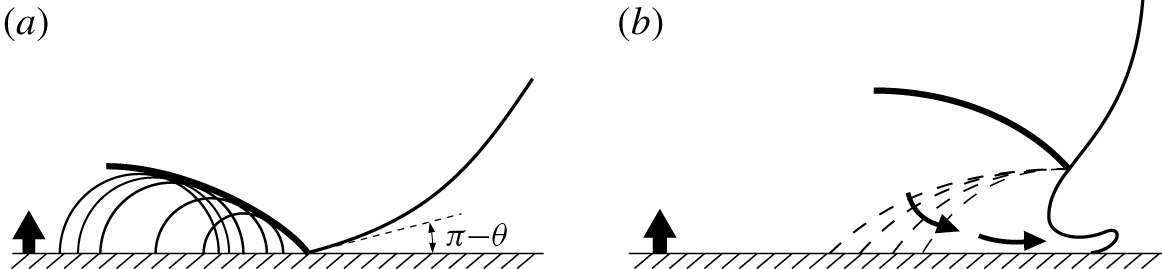
 $\unicode[STIX]{x1D703}>90^{\circ }$, the edge velocity is higher than the shock speed throughout this initial stage: therefore, the SW remains attached to the contact periphery, typically within a few nanoseconds (figure 19a).
SW propagation through an impulsively driven drop sitting on a membrane: (a) initial condition with the contact angle  $\unicode[STIX]{x1D703}<90^{\circ }$, (b) jetting occurs and continues (c) with the liquid motion next to the membrane being plagued by friction/adhesion, (d) cavitation, (e) reflected SW focusing in (f) similarly to Camus (Reference Camus1971). The SW front is flat in (a–d) because the drop is wider at the bottom (hydrophilic case). Note that the top of the drop (above SW) in (a–d) has the same shape as it is not yet affected by the SW. In the above picture we neglected the shock wave passing around the drop in air, since, as suggested by Joseph et al. (Reference Joseph, Belanger and Beavers1999) in the context of aerobreakup experiments, it has no significant influence on the breakup.

The pressure at the centre of the impact is the ‘water hammer’ pressure  $p=\unicode[STIX]{x1D70C}cV$, which in our experiments reaches
 $O(10)\,\text{MPa}$, consistent with the EM pressure
 $p_{max}$ estimated from the measured current
 $I_{max}$ (appendix C). However, at the moving contact line, where the wavelets (see figure 19a) bunch up, there are even higher pressures reaching a maximum value of approximately
 $3\unicode[STIX]{x1D70C}cV$ just before the shock envelope overtakes the contact edge (Lesser Reference Lesser1981). After this time, the edge velocity decreases below the shock velocity. Once the shock detaches and moves up along the free surface of the drop, cf. figure 19(b), release waves travel into the drop interior and jetting commences. The elastic energy in the compressed liquid (the shaded areas in figure 18) is gradually transformed into kinetic energy of the lateral flow, and the contact pressures must decrease. One important trait of the phenomena is that the high-velocity jet is ejected only from the contact edge, which is not necessarily obvious, since the travelling SW carries high pressure along the entire free surface and one might expect that jetting would occur everywhere on the free surface after the shock passage. This does not take place due to the previously mentioned expansion wave adjacent to the free surface, which rapidly lowers the high pressure carried by the shock and inhibits jetting across the free surface. The only region in the drop where the pressure remains high and can produce sustainable jetting is the zone at the contact edge, cf. figure 19(b). The release waves superpose when they cross, bringing the liquid into a tensile-stress state, cf. figure 18(d). The presence of low pressure, indicating strong rarefaction in the middle of the drop, could produce cavitation. In figure 18 we considered the case
 $\unicode[STIX]{x1D703}<90^{\circ }$ and thus assumed regular SW reflection throughout the entire process of SW propagation, i.e. when rarefaction waves arising on the free surface do not disturb the front of the SW because they cannot outrun their source (Berezin & Grib Reference Berezin and Grib1960). For wetting angles
 $\unicode[STIX]{x1D703}>90^{\circ }$ reflection initially may be irregular (Mach), but becomes regular at later stages (due to the drop convex shape).
Late stages. For further interpretation, let us briefly review the basics of SW reflection and refraction from a free interface in the limit of weak shock (acoustic) waves. In terms of acoustic impedance  $z=\unicode[STIX]{x1D70C}c$ in the 1-D case representing the ratio of acoustic pressure to particle velocity (Kinsler et al. Reference Kinsler, Frey, Coppens and Sanders1999), the reflection coefficient at the interface between two media, for an acoustic wave incident from medium
 $1$ at normal incidence reduces to
 $\unicode[STIX]{x1D6E4}=(z_{2}-z_{1})/(z_{2}+z_{1})$. Taking the values of acoustic impedance for water,
 $z_{1}=1.48\times 10^{6}~\text{Rayles}$, and for air,
 $z_{2}=415~\text{Rayles}$, i.e. when an incident wave propagates in water and reflects from the interface with air, we find
 $\unicode[STIX]{x1D6E4}\simeq -1$: the interface resembles a pressure release boundary, i.e. when the reflected wave receives a
 $180^{\circ }$ phase shift – in the context of a SW reflection we say that the reflected wave is a rarefaction wave. If, however,
 $\unicode[STIX]{x1D6E4}=+1$, which takes place when
 $z_{2}\gg z_{1}$, the interface behaves as a rigid boundary – again, in the context of a SW reflection, we say that the reflected wave is a SW.
Supersonic (a) and subsonic (b) regimes of the drop–solid interaction with initial contact angle  $\unicode[STIX]{x1D703}>90^{\circ }$ in analogy to the drop impact on a solid (Field, Lesser & Dear Reference Field, Lesser and Dear1985). Initially (a) the liquid/solid contact line moves tangentially outward at a speed which exceeds the velocity of propagation of the SW (thick solid) generated by the impact. The SW, therefore, remains attached to the solid surface and the compressed liquid, being bounded by the solid surface on one side and by the SW on the other, cannot flow out. It is only when the SW overtakes the contact line and reaches a free surface, i.e. becomes detached (b), that lateral flow begins. Similar to figure 10 expansion (pressure release) waves (dashed) now enable jetting.

With the above understanding it is clear that when the SW propagating upward reaches the drop upmost point, it reflects downward in figure 18(e) and becomes a rarefaction wave, which travels in the compressed drop and unloads it providing a rapid decompression leading to negative pressures and consequently to cavitation, e.g. in figure 14(a). While the classical nucleation theory predicts (Caupin Reference Caupin2005) that water can get to as low a pressure as  $-100~\text{MPa}$ due to its strong cohesion, the cavitation bubbles are still observable in our experiments despite much lower
 $O(10)\,\text{MPa}$ water hammer pressure. Therefore, as to the origin of cavitation, the strength of a liquid under dynamic loading is not as certain a phenomenon as that of solid strength due to the presence of micro-inhomogeneities in the form of gas bubbles, solid particles and fluctuating density ‘holes’ (Frenkel Reference Frenkel1955), which serve as cavitation nuclei. For example (Strasberg Reference Strasberg1956), DI water contains on the order of
 $10^{4}~\text{cm}^{-3}$ micro-bubbles of characteristic size
 $1.5~\unicode[STIX]{x03BC}\text{m}$ with volume fraction of
 $10^{-12}{-}10^{-8}$. While presence of these micro-bubbles does not have appreciable effect on shock wave propagation, when there are tensile stresses the cavitation nuclei start expanding increasing the volume fraction by 5–6 orders in less than a microsecond. The problem of liquid fracture in intense rarefaction waves formed as a result of explosive loading of a liquid with a free surface reduces to determining a critical tensile stress
 $p_{\ast }$ allowed by the cavitating liquid. For settled tap water
 $p_{\ast }=-0.85~\text{MPa}$, for DI water
 $-1.5~\text{MPa}$ (Wilson, Hoyt & McKune Reference Wilson, Hoyt and McKune1975), which explains, when compared to the
 $O(10)\,\text{MPa}$ pressure experienced in our experiments, the presence of cavitation bubbles. It should be emphasized that at the free surface, the SW is reflected normal to the surface as an expansion (rarefaction) wave, which focuses in the inner region of the water drop, cf. figure 18(f). Such occurrence of a focused rarefaction wave in the middle of the drop has been observed experimentally by Field, Dear & Ogren (Reference Field, Dear and Ogren1989) in 2-D drop impacts. Also, a contributing factor is a SW curving (§ 4.3) which in the cupola regime follows the shape of the drop interface upon approaching it similar to the SW reflection in the 2-D experimental studies by Camus (Reference Camus1971) and Field et al. (Reference Field, Dear and Ogren1989), so that when a SW reflects from the liquid–air interface, it does not lead to breakup of the latter. At higher intensity impulses this fine tuning between the SW and the drop shape no longer takes place and SW interaction with the drop surface leads to its immediate breakup – the direct atomization regime – e.g. via a Richtmyer–Meshkov instability, which does not depend on the direction of the interface acceleration (Krechetnikov Reference Krechetnikov2009).
In experimental studies of a single (hemispherical) drop disintegration under ultrashort loading (Kedrinskii, Besov & Gutnik Reference Kedrinskii, Besov and Gutnik1997), it was found that the cavitation zone is a system of microbubbles, inertial development of which leads to formation of cellular-type structures different from the usual foams with spherical and polyhedral cells. The process of disintegration of this cellular structure can be divided into the following stages (Kedrinskii Reference Kedrinskii1993): growth of microbubbles leading to formation of cavitation clusters, development of the cavitation clusters until the foam stage establishes and disintegration of foam via atomization. More specifically, as alluded to by Kedrinskii et al. (Reference Kedrinskii, Besov and Gutnik1997), for the SW of 15 MPa amplitude, in approximately  $25~\unicode[STIX]{x03BC}\text{s}$ one observes formation of a cavitation zone in the centre of the drop as well as near the membrane, where one can see a cavitation layer linked to the drop’s detachment from the membrane. At
 ${\sim}50~\unicode[STIX]{x03BC}\text{s}$ a relatively large cavity is formed in the drop centre. In
 $70{-}100~\unicode[STIX]{x03BC}\text{s}$ the drop transforms in a ‘boiling’ state assuming a distinct cellular-type structure, at the basis of which are large clusters formed by merging bubbles growing in the straining flow. It is notable that by this stage the drop has not changed its size appreciably and has not travelled much from the membrane. Eventually, the cavitation zone grows due to inertia, forms a cupola with cellular structure comprised of liquid threads connected by a thin film forming a net, and detaches from the membrane around
 $200~\unicode[STIX]{x03BC}\text{s}$, as confirmed by our measurements, cf. figure 20(a). At the end, this liquid network disintegrates into threads and droplets.
A closely related experimental study is by Stebnovskii & Chernobaev (Reference Stebnovskii and Chernobaev1987) on the process of disintegration of cylindrical liquid shells under impulsive loading in which they varied the time of loading  $\unicode[STIX]{x1D70F}_{a}^{d}$ defined by the characteristic parameters of explosion, and fixed the time
 $\unicode[STIX]{x1D70F}_{c}^{d}$ it takes for a rarefaction wave to travel from the free surface to the explosion cavity. They found that if
 $\unicode[STIX]{x1D70F}_{a}^{d}>\unicode[STIX]{x1D70F}_{c}^{d}$, then the liquid volume disintegration is due to perturbation growth at the free surfaces. If, on the other hand,
 $\unicode[STIX]{x1D70F}_{a}^{d}\leqslant \unicode[STIX]{x1D70F}_{c}^{d}$, the disintegration stage is proceeded by cavitation bubble growth and cluster formation. In our case, however,
 $\unicode[STIX]{x1D70F}_{a}^{d}=O(10^{-5})\,\text{s}\geqslant \unicode[STIX]{x1D70F}_{c}^{d}=O(10^{-6})\,\text{s}$, while we still observe cavitation bubble formation in the bulk, cf. figure 14(a).
(a) The time of detachment from the membrane for six liquids in the cupola and atomization regimes with respect to the surface tension force projected on the axis normal to the membrane surface. (b) Non-dimensional detachment time of the liquid drops with respect to non-dimensionalized surface tension. Error bars indicate the range of detachment uncertainty. Implemented liquids were DI water, 22 wt% water–ethanol, 50 wt% water–sucrose, as well as 67 wt%, 80 wt% and 90 wt% water–glycerol solutions. In all cases the initial energy of the capacitors and liquid drop size were fixed and equal to 1000 J and  $50~\unicode[STIX]{x03BC}\text{l}$, respectively. In the cupola and direct atomization regimes, the copper membrane thicknesses were set at 0.17 mm and 0.034 mm, respectively. For symbol and shading definitions see figures 8(a) and 17(a).

At the same time, growth of bubble concentration  $\unicode[STIX]{x1D6FC}$ in a liquid leads to increased relaxation time of tensile stresses, i.e. the liquid attains new rheological properties and behaves as viscoelastic. It is then natural to surmise that disintegration of such a medium is due to accumulation of elastic energy to the magnitude at which the bubbly medium is no longer stable thus leading to spontaneous formation of discontinuities (cavities) in the regions of elevated bubble concentration
 $\unicode[STIX]{x1D6FC}$. Understanding when such bubbly media disintegrate requires comparison of the dynamic loading time
 $\unicode[STIX]{x1D70F}_{a}^{d}$ with the relaxation time
 $\unicode[STIX]{x1D70F}_{tensile}$ of tensile stresses. If the liquid volume does not contain cavitation nuclei, then under volume stretching it would accumulate elastic energy. In this case, the time of relaxation of tensile stresses can be estimated as
 $\unicode[STIX]{x1D70F}_{tensile}=10^{-10}~\text{s}$, cf. table 2 in appendix A. If
 $\unicode[STIX]{x1D70F}_{tensile}<\unicode[STIX]{x1D70F}_{a}^{d}$, which is the case here as
 $\unicode[STIX]{x1D70F}_{a}^{d}=O(10^{-5})\,\text{s}$, then in the process of deformation cavitation bubbles would grow: elastic energy of the liquid is spent on the work required for cavitation. If stretching stresses are sufficiently high, non-uniformities in the cavitation bubble concentration
 $\unicode[STIX]{x1D6FC}$ are characterized by larger relaxation time and hence more intense accumulation of elastic energy, which leads to bubble coalescence and thus void formation.
Formation of cracks in the cavitating medium is also stipulated by shear stresses, which can grow only if the time of their relaxation  $\unicode[STIX]{x1D70F}_{shear}$ is larger than the characteristic time of shear deformation, which in our case can have a number of origins, but the most relevant one is due to minute surface deformations happening on the time scale
 $\unicode[STIX]{x1D70F}_{\unicode[STIX]{x1D70E}}^{\unicode[STIX]{x1D708}}=O(10^{-9}{-}10^{-10})\,\text{s}$ as per table 2. The relaxation time scale can be estimated from
 $\unicode[STIX]{x1D70F}_{shear}=\unicode[STIX]{x1D707}_{eff}/G_{\infty }$, where
 $G_{\infty }$ is the dynamic shear modulus and
 $\unicode[STIX]{x1D707}_{eff}(\unicode[STIX]{x1D6FC})$ the effective shear viscosity of a cavitating medium, which increases with the volume concentration of bubbles
 $\unicode[STIX]{x1D6FC}$. Hence, even for low viscosity Newtonian liquids, due to bubble concentration growth,
 $\unicode[STIX]{x1D70F}_{shear}(\unicode[STIX]{x1D6FC})$ may exceed
 $\unicode[STIX]{x1D70F}_{\unicode[STIX]{x1D70E}}^{\unicode[STIX]{x1D708}}$, and thus the liquid transitions into a viscoelastic state: growth of shear stresses leads to accumulation of elastic energy necessary for crack formation. Namely, as bubbles grow and, due to interactions among themselves, deform, they accumulate elastic energy because of surface tension. It is at this stage when the fluid starts behaving as viscoelastic owing to the fact that potential energy of deformed bubbles can transform into kinetic energy only in a finite time equal to the one required for the bubble to restore spherical shape. This time increases with bubble size and concentration
 $\unicode[STIX]{x1D6FC}$. While it was claimed earlier (Kedrinskii et al. Reference Kedrinskii, Makarov, van Doorn and Borel2005) that viscosity obstructs formation of cavitation bubbles, the map in figure 17(a) for
 $Re<O(10^{3})$ does not exhibit any significant viscosity dependence of the transition between the cupola regime, which relies upon cavitation, and the butterfly crown regime, in which cavitation phenomena are not essential. In our opinion, while viscosity indeed impedes the growth of cavitation bubbles, as can be inferred from the Rayleigh–Plesset equation (Brennen Reference Brennen1995), the associated time scales are still disparate from the loading time and thus no effect on the cupola–crown regime transition is observed. This implies that the above described process of shear-induced cavitation is not prevailing in our case compared to that induced by shock waves.
5.3 Detachment and disintegration times
Both the cupola and direct atomization regimes are characterized by total detachment, and the butterfly crown regime by partial detachment. In the latter case, whether any copious amount of liquid is left depends on the competition between adhesion force proportional to  $\unicode[STIX]{x1D70E}\cdot \sin \unicode[STIX]{x1D703}$ and the impulse intensity. As one can see from figure 20(a), the detachment times are expectedly much shorter in the direct atomization than in the cupola regime and increase with adhesion. Despite a significant visual difference between cupola and direct atomization regimes, the detachment times collapse onto one curve when scaled by the loading time
 $\unicode[STIX]{x1D70F}_{0}$, cf. figure 20(b).
Disintegration time of liquid drops with respect to (a) viscosity and (b) surface tension. (c) Non-dimensional disintegration time of six liquids in the cupola and direct atomization regimes with respect to the splashing parameter  $Re^{1/2}We$. Implemented liquids were DI water, 22 wt% water–ethanol, 50 wt% water–sucrose, as well as 67 wt%, 80 wt% and 90 wt% water–glycerol solutions. In all cases, the initial energy of the capacitors and the liquid drops size were fixed and equal to 1000 J and
 $50~\unicode[STIX]{x03BC}\text{l}$, respectively. In the cupola and direct atomization regimes, the membrane thicknesses were set at 0.17 mm and 0.034 mm, respectively. The curve fitted to the cupola regime data points is
 $t_{dis}/\unicode[STIX]{x1D70F}_{0}=213\,200(Re^{1/2}We)^{-0.5636}$ and to that of the direct atomization regime is
 $t_{dis}/\unicode[STIX]{x1D70F}_{0}=1064.2(Re^{1/2}We)^{-0.2969}$. For symbol and shading definitions see figures 8(a) and 17(a).

Next, figure 21(a) clearly indicates the retardation effect of viscosity on the drop disintegration time. From a practical viewpoint, e.g. in the context of combustion, the inhibition of the drop distortion and breakup due to increased viscosity implies that after the injection of such drops they will penetrate deeper into the surrounding space. Therefore, to attain equal degrees of atomization for the viscous components of a fuel it is required to increase the dimensions of the combustion chamber. While surface tension effects do not seem to have a lucid trend as per figure 21(b), the disintegration times non-dimensionalized with respect to the loading time scales collapse on power-law curves when plotted against the splashing parameter  $K$, cf. figure 21(c).
5.4 On the secondary droplet size distribution
Different liquids were employed to study the effect of viscosity and surface tension on the size of the secondary droplets produced in the direct atomization regime. The droplet sizes were determined using the stain method (Komabayasi, Gonda & Isono Reference Komabayasi, Gonda and Isono1964; Hall Reference Hall1970; Stow & Hadfield Reference Stow and Hadfield1981), which assumes that a droplet falling upon a uniform absorbent surface produces a stain whose diameter is proportional to the diameter of the droplet. The distribution of droplet sizes in figure 22 is obtained by comparing the stain sizes with those produced by droplets of known diameter. Similar to the originator of the method, German meteorologist Lenard (Reference Lenard1904), we added red food colour to the liquids ( ${<}1\text{wt}\%$). Whatman paper of grade 1 (medium porosity, so that it takes 10.5 s to pass
 $0.155~\text{m}^{3}$ of air through
 $1~\text{m}^{2}$ surface area of the particular paper used in our experiments) was placed 200 mm away from the membrane surface and parallel to it. After each experiment the stained paper was scanned to produce a high resolution image for further processing with the Hough transform applied to fit circles to the stains.
The secondary droplet distributions in the direct atomization regime were first compared to different analytic probability distribution functions (PDFs), and it was found that they are best represented by log-normal ones as, in particular, is evidenced by the good match of the mean secondary droplet radii between experimental and fitted log-normal PDFs in figure 23(b). Accordingly, all experimental data were fitted to a log-normal distribution function; means and standard deviations for both experimental data and fitted curves were recorded and presented in figure 23(a). The most probable size of secondary droplets in figure 22(a,b) is of the same order as that in the drop impact on a solid surface, e.g. for ethanol (Yarin & Weiss Reference Yarin and Weiss1995) and water–ethanol–sucrose solutions (Mundo et al. Reference Mundo, Sommerfeld and Tropea1995), although corresponding to splashing parameter values  $K=(1.7{-}3.5)\times 10^{4}$ considerably below the ones we work with here, cf. figure 23(a).
On the physical side, increase of viscosity both widens the distribution curves and increases the most probable secondary droplet size  $r_{max}$, cf. figure 22(a). Decreasing the impact intensity also widens the distributions and increases
 $r_{max}$, cf. figure 22(d). Conversely, surface tension does not seem to have the same discernible effect, which may be due to being masked by the variation of viscosity of the used solutions, cf. figure 22(b). However, overall, as summarized in figure 23(a), the mean radius of secondary droplets exhibits noticeable dependence on both viscosity and surface tension as
 $\bar{r}/R_{0}\sim (Re^{1/2}We)^{-0.2469}$. Also, as per figure 22(c), the PDFs admit reasonable collapse, while preserving the total probability to be one, with respect to all the key physical parameters (viscosity, surface tension and sound speed) in the form favoured here to
 $r\unicode[STIX]{x1D707}^{\unicode[STIX]{x1D6FC}}\unicode[STIX]{x1D70E}^{\unicode[STIX]{x1D6FD}}c^{\unicode[STIX]{x1D6FE}}$, with different values of exponents
 $\unicode[STIX]{x1D6FC}$,
 $\unicode[STIX]{x1D6FD}$ and
 $\unicode[STIX]{x1D6FE}$ in the range from
 $-10$ to
 $+10$, rather than to various time or spatial scales, which would obviously provide a non-unique choice. The criterion for the best collapse is the minimum difference between the average of the data sets and the data sets themselves. The substantial dependence of the collapse on the sound speed indicates that the atomization phenomena indeed rely upon compressibility effects.
PDFs of secondary droplet radii in the direct atomization experiments on 0.034 mm copper membrane. (a) The effect of viscosity on the PDF. Implemented liquids were DI water, 45 wt% glycerol, 67 wt% glycerol, 75 wt% glycerol and 80 wt% glycerol. (b) The effect of surface tension on the PDF. Implemented liquids were 35 wt% ethanol, DI water, 20 wt% sucrose and 40 wt% sucrose. (c) Data in (a) and (b) combined to collapse into a single PDF curve with respect to the scaled radius  $r^{\prime }=r\unicode[STIX]{x1D707}^{\unicode[STIX]{x1D6FC}}\unicode[STIX]{x1D70E}^{\unicode[STIX]{x1D6FD}}c^{\unicode[STIX]{x1D6FE}}$ in the inset. (d) The effect of impact intensity on PDF in the direct atomization regime for 35 wt% ethanol solution. In (a,d),
 $r_{max}$ represents the most probable radius of the microdroplets. Applied energy in (a–c) was 1000 J.

The well-distinguished bimodal character of the PDF for 35 % ethanol solution in figure 22(b) suggests that there are two prevailing processes responsible for the drop atomization producing two different secondary droplet populations and operating on similar length and time scales. Each of these processes leads to a log-normal distribution, the superposition of which furnishes a bimodal one with two preferred most probable droplet radii. While binomial distributions are not uncommon in atomization (Eroglu & Chigier Reference Eroglu and Chigier1991; Harari & Sher Reference Harari and Sher1998; Alekseev et al. Reference Alekseev, Zalkind, Zeigarnik, Marinichev, Nizovskii and Nizovskii2015), in our case with the primary mechanism being the SW–interface interactions, such a PDF likely originates from an increased contribution of cavitation similar to the case of superheated water atomization (Alekseev et al. Reference Alekseev, Zalkind, Zeigarnik, Marinichev, Nizovskii and Nizovskii2015).
(a) The comparison between the mean of the experimental data and of the fitted curves to the PDFs presented in figure 22. Error bars with ‘ $-$’ and ‘
 $\times$’ end symbols correspond to experimental and fitted data, respectively. The curve fitted to the experimental data is
 $\bar{r}/R_{0}=3.48(Re^{1/2}We)^{-0.2469}$ with
 $R_{0}=1.8~\text{mm}$. (b) Normalized difference between mean radii of the experimental data and of the fitted curves.

Qualitative insights. To begin with, it is necessary to realize that, unlike the problem of the breakup of a cylindrical liquid column, which is inherently unstable to infinitesimal disturbances having certain wavelengths (Drazin & Reid Reference Drazin and Reid2004), a spherical liquid drop is stable to small disturbances and, therefore, a finite amount of energy is necessary to cause it to burst. This is due to the fact that a spherical drop is already at its minimum free energy level, which explains why a critical Weber number (related to the impact energy) is required to break the drop as will be discussed in the context of aerobreakup in § 6.1. Hence, a proper theoretical treatment of the drop breakup would involve more than subjecting a drop to linear perturbations and analysing the conditions for their growth. Nevertheless, by appealing to the thermodynamic principles, one should be able to deduce certain characteristics of the secondary droplet sizes after the impact. Such an analysis was conducted by Cohen (Reference Cohen1991), who arrived at a power-law probability distribution of the daughter droplet size.
In our case, however, we observe a log-normal distribution, which is characteristic of the interacting droplets situation studied by Kolmogorov (Reference Kolmogorov1941). Therefore, despite the seemingly absent droplet interactions in the time sequence of figure 16(d) and straight trajectories in the direct atomization photo at the late stages of the phenomena (cf. figure 3), the acoustic processes of SW reflection from a free interface (as per figure 21(c), the SW can turn around many times before the drop disintegrates) and cavitation bubble growth apparently favour a log-normal distribution. The analysis of Cohen (Reference Cohen1991) is based on the assumption that daughter droplets do not interact. However, in real applications this is unavoidable. The extreme case, in which droplet interactions are severe, corresponds, for example, to air-blast atomization, the physics of which is very complex: in addition to gas turbulence-induced breakup, many other random processes such as multiple droplet collision and turbulence in the liquid contribute to the phenomenon of breakup. As a simplification, the process of air-blast breakup is considered in the framework of a cascade of uncorrelated breakage events, independently from the initial size distribution. The cascade idea is due to the early work of Kolmogorov (Reference Kolmogorov1941), in which he considered the breakup of solid particles as a discrete random process with the probability of breaking each parent particle into a given number of parts being independent of the parent particle size. Based on Lyapunov’s central limit theorem (Billingsley Reference Billingsley1995), such an assumption leads to a log-normal distribution of particle size in the long-time limit. Given the complexity of our phenomena similar to that of aerobreakup, we conclude that similar underlying principles – based on complex interactions of SWs with free interfaces and among each other along with the cavitation phenomena in which bubbles interact – lead to a log-normal distribution as well.
Quantitative estimates. As discussed in § 5.2, inner stresses in the liquid containing bubbles may arise due to distortion of the latter which leads to accumulation of excess energy in the deformed bubbles and existence of micro-stresses near the bubble surface with maximum curvature. When the bubble concentration  $\unicode[STIX]{x1D6FC}$ reaches dense packing,
 $0.52<\unicode[STIX]{x1D6FC}_{\ast }<0.75$ (Kedrinskii & Chernobaev Reference Kedrinskii and Chernobaev1992) it becomes more energetically preferable to form new free surfaces in the directions of the maximum deformation of the medium. One can estimate the time
 $t_{\ast }$ required to achieve
 $\unicode[STIX]{x1D6FC}_{\ast }$ from
 $t_{\ast }\sim \dot{\unicode[STIX]{x1D6FE}}^{-1}$, where
 $\dot{\unicode[STIX]{x1D6FE}}=\text{div}\boldsymbol{v}$ is the rate of deformation in the cavitation zone. Equating the kinetic energy of the deformation of a fluid particle of size
 $r$ to the surface energy required to create a free surface,
 $r^{3}\unicode[STIX]{x1D70C}(r\dot{\unicode[STIX]{x1D6FE}})^{2}\sim \unicode[STIX]{x1D70E}r^{2}$, we find
 $\dot{\unicode[STIX]{x1D6FE}}\sim (\unicode[STIX]{x1D70E}/\unicode[STIX]{x1D70C}r^{3})^{1/2}$ or
 $r\sim (\unicode[STIX]{x1D70E}/\unicode[STIX]{x1D70C}\dot{\unicode[STIX]{x1D6FE}}^{2})^{1/3}$. For water, taking
 $10^{3}<\dot{\unicode[STIX]{x1D6FE}}<10^{5}~\text{s}^{-1}$ we find the range of the droplet sizes
 $10^{-5}<r<10^{-4}~\text{m}$ in accordance with our experimental observations in figure 22. Similar estimates follow if RT instability is posited to be governing the break up of the fluid interface in analogy with the RT instability of liquid shells (Bang et al. Reference Bang, Ahn, Kim, Lee, Kim, Jeong, Al-Deyab, Yoon, Yoo and Yoon2016) as the impulse induces a SW propagating through the drop (cf. figure 18) thus accelerating the liquid–air interface: calculating the most amplified wavelength of the RT instability
 $\unicode[STIX]{x1D706}_{RT}=2\unicode[STIX]{x03C0}(3\unicode[STIX]{x1D70E}/\unicode[STIX]{x1D70C}a)^{1/2}$ (Drazin & Reid Reference Drazin and Reid2004) for the upper end of accelerations
 $a$ leading to direct atomization (cf. figure 2c), we also find
 $r\sim \unicode[STIX]{x1D706}_{RT}=O(10^{-5}-10^{-4})\,\text{m}$.
6 Discussion
6.1 Comparison of morphologies with other drop impact phenomena
Based on the experimental observations (figure 3) we distinguished the outcome patterns in figure 24, which schematically highlights the key features in the evolution of each pattern discussed in foregoing sections, sets the terminology and provides a counterpart to the outcomes in aerobreakup (figure 25) and drop impact on solid (figure 26) outlined below.
Schematics of the patterns shown in figure 3: (a) ripple waves; (b) ejecta; (c) crown without splash: once the substrate is accelerated a crown is formed with the rim either being flat or forming fingers at later times, although without secondary droplet detachment; the crown wall does not disintegrate in this regime; (d) crown splash: after the crown formation, fingers are developed at the rim but they may not detach (break into secondary droplets) until the crown wall disintegrates; (e) crown microdroplet splash: after the crown formation, fingers are developed at the rim and several microdroplets are detached from the rim while the crown has not disintegrated yet; (f) butterfly crown splash; (g) cupola with cavitation bubbles (left) coalescing to form a void (right); (h) direct atomization.

When a SW in air is passing through a liquid drop at a relative non-zero velocity  $V$, cf. figure 25(a), the latter is subject to an impulsive, although finite, acceleration
 $a$ and, depending on the SW intensity, may deform or shutter. The drop dynamics in such flows is characterized by various modes of appearance, cf. figure 25. When viscous forces are negligible, i.e. low Ohnesorge numbers
 $Oh=\unicode[STIX]{x1D707}/(\unicode[STIX]{x1D70C}R_{0}\unicode[STIX]{x1D70E})^{1/2}\lesssim 0.14$ (Hsiang & Faeth Reference Hsiang and Faeth1992), transitions between various regimes of deformation and disintegration of an initially spherical drop of radius
 $R_{0}$ and density
 $\unicode[STIX]{x1D70C}$ happen due to competition between the aerodynamic pressure and restoring surface tension
 $\unicode[STIX]{x1D70E}$ forces. The morphological sequence naturally starts with the vibrational breakup (b): the flow field interacts with the drop in such a way as to increase the oscillation amplitude, which in turn causes the drop to decompose into a few large fragments. The bag breakup (c) emerges from
 $We=\unicode[STIX]{x1D70C}V^{2}R_{0}/\unicode[STIX]{x1D70E}=8{-}13$ and involves distortion of the drop into a thin disk normal to the flow direction, followed by deformation of the centre of the disk into a thin balloon-like structure extending in the downstream direction, while being attached to a more massive toroidal rim. The bag eventually bursts, forming a large number of small droplets; the rim disintegrates a short time later, producing a small number of larger fragments. At higher velocities, from
 $We=30{-}50$, bag transitions to umbrella regime (d), when in addition to the bag breakup morphology, a column of liquid is formed along the drop axis in the direction of the approaching flow. The bag bursts first followed by rim and stamen disintegration. Lastly, the shear breakup (e), also known as the stripping regime (Theofanous & Li Reference Theofanous and Li2008) and originally postulated by Taylor (Reference Taylor and Batchelor1949), was observed at higher relative velocities, starting with
 $We=40{-}100$. Instead of forming a bag, in this regime from the periphery of the deforming disk one observes continuous stripping of a thin sheet, which disintegrates a short distance downstream from the drop. A coherent residual drop exists during the entire breakup process.
As for the regimes of drop impact on a solid surface, they were summarized by Rioboo et al. (Reference Rioboo, Tropea and Marengo2001) and are similar to those shown in figure 26: (a) deposition, where the drop during the entire process is only deformed and stays on the surface; (b) crown (corona) splash, where a crown is formed during the spreading phase and eventually breaks up into droplets developed around the rim of a crown; (c) prompt splash, where droplets are ejected directly from the contact line region in the spreading phase of the lamella – this regime is observed only on sufficiently rough surfaces; (d) receding breakup, where droplets are left on the surface during the receding phase of the impact – this is a pure wetting phenomenon; (e) complete or partial rebound, where either the entire drop or a part thereof rebounds from the substrate.
Breakup regimes (Pilch & Erdman Reference Pilch and Erdman1987) when (a) SW passes through a liquid drop: (b) vibrational, (c) bag, (d) umbrella, (e) sheet stripping.

To recapitulate, despite the fact that for low impulse intensities ripple waves (figure 5) in the impulse-driven drop experiments are analogous to the ones observed in drop impact on a solid (Renardy et al. Reference Renardy, Popinet, Duchemin, Renardy, Zaleski, Josserand, Drumright-Clarke, Richard, Clanet and Quéré2003; Roux & Cooper-White Reference Roux and Cooper-White2004), the lack of a Galilean invariance between these two problems results in different patterns, in particular at higher impulse intensities, compared to those in figure 26. Even though the term crown (corona) applies to both experimental configurations – figure 24(c–f) versus figure 26(b) – the splashes in our experiments resemble crowns in the drop impacts on films rather than on solids (cf. § 4.3); also non-monotonic crown behaviour (figure 14a) and butterfly crowns are signatures of the impulsively driven drops only. Despite the comparable accelerations experienced in aerobreakup, the differences in the observed morphologies are striking: figure 24 versus figure 25. Lastly, quantitative differences on the basis of  $We$ number are also apparent when our experiments are compared to both the drop impact on a thin film (figure 9d) as well as to the above discussed transition
 $We$ numbers between aerobreak regimes, which are considerably lower than in the impulse-driven drops (figures 8a and 17a).
Breakup regimes when a liquid drop hits dry surface (Rioboo et al. Reference Rioboo, Tropea and Marengo2001): (a) deposition, (b) corona splash, (c) prompt splash, (d) receding breakup, (e) rebound (partial).

6.2 Key findings of the present study
In the presented experimental study, we highlighted the physics of the multi-scale phenomena of an impulse-driven drop and discussed the differences from along with similarities to aerobreakup as well as drop impact on a solid and a thin liquid layer. Starting with low impulse intensities (§ 4) we explored the transitions from ripple waves forming staircase patterns to ejecta occurring due to hydraulic jump phenomena (§ 4.1), and from various crown regimes – exhibiting flat rims, regular spike structures, microdroplets and butterfly patterns (§ 4.2) – to drop disintegration ones – cupola formation due to cavitation and direct atomization (§ 5). A complete map of the morphological changes an impulse-driven drop undergoes in a wide range of viscosities, surface tensions and impulse intensities was developed (§§ 4.2, 5.1), which is found to be quite different, both qualitatively and quantitatively, from aerobreakup and drop impact phenomena (§ 6.1); also, as opposed to the latter phenomena, the maximum acceleration, not velocity, proved to be a proper physical variable for data interpretation (e.g. figure 8b).
The effect of each physical parameter – initial intensity reduced here to  $a_{max}$, surface tension
 $\unicode[STIX]{x1D70E}$, viscosity
 $\unicode[STIX]{x1D707}$ and contact angle
 $\unicode[STIX]{x1D703}$ – on the outcome pattern is summarized in the table of figure 27(a). The interrelation of the observed morphologies is illustrated in the diagram of figure 27(b), which in particular shows that the transition from the crown splash regime may either go directly to butterfly crown splash as the intensity increases while working with the same fluid, or to microdroplet splash if the surface tension is decreased, e.g. by using ethanol–water mixtures.
(a) General trends of how each physical parameter influences the appearance of a regime compared to the previous one in the column on the left; this summary is provided based on observations in figures 8, 9(a,b) and 17(a). Arrow up means that the associated pattern appears from the previous regime and arrow down means that the pattern disappears. Dashed arrows are used when the trends are observed for a narrow range of the parameter. (b) Sequence of regimes as impact intensity increases.

The role of the key time scales in each regime was illuminated as well, culminating in a proper interpretation of the regime maps (§§ 4.2, 5.1) and of the fundamental processes underlying the regimes (§§ 4.2, 5.1, 5.2). To our knowledge, such an analysis has not been done in aerobreakup and drop impact problems. The crown dynamics – its radius and height – was explored in detail and contrasted with analogous observations in the drop impact studies (§ 4.4), revealing that decreasing surface tension makes the crown radius growth approach the square-root law  $R\sim t^{1/2}$, while lowering viscosity be closer to the ballistic regime
 $R\sim t$ as opposed to the retarding effect of higher viscosities
 $R\sim t^{\unicode[STIX]{x1D6FC}_{R}}$ with
 $\unicode[STIX]{x1D6FC}_{R}<1$. Non-monotonic crowns, unique to impulse-driven drops, originate from surface tension force competing with liquid inertia.
While SW interaction with the drop interface is instrumental for comprehending the early stages of the drop dynamics even in the crown formation (§ 4.3), the most intense impulse regimes – cupola and direct atomization – turned out to strongly rely upon compressible effects such as cavitation and SW–free surface interactions (§ 5.2). The key characteristics of the latter two regimes – drop detachment and disintegration times (§ 5.3) along with probability distributions of the secondary droplet sizes (§ 5.4) – were quantified as well. In all the above studies, the effects of impulse intensity, viscosity, surface tension and wettability (§ 4.5) interplaying with compressibility (§§ 4.3, 5.2) were identified and interpreted. In particular, detachment times were observed to be much shorter in the direct atomization compared to the cupola regime and increase with adhesion; also disintegration times increase with viscosity. Collapse of these characteristic times on a power-law curve is achieved with the splashing parameter  $K$. As for secondary droplet PDFs, which prove to be log-normal due to compressible effects, increase of viscosity both widens them and increases the most probable secondary droplet size
 $r_{max}$. The significant contribution of compressibility to the nature of the PDFs is also confirmed by the collapse of the latter when properly scaled with sound speed (§ 5.4). Lastly, the discovered bimodal character of the PDF for the 35 % ethanol solution is argued to arise from an increased contribution of cavitation, to which this particular liquid is more prone.
Acknowledgements
This work was partially supported by the National Science Foundation (NSF) under grant no. CMMI-1232902 and CAREER award under grant no. 1054267, American Chemical Society (ACS) Petroleum Research Fund under grant no. 51307-ND5, the Natural Sciences and Engineering Research Council of Canada (NSERC) under grant no. 6186, as well as Canada Foundation for Innovation (CFI) JELF Grant No. 35913 and Economic Development and Trade (EDT) grant no. RCP-17-014SEG. The authors are indebted to A. Gervais and Professor B. Homsy for careful reading of the manuscript. R.K. is also grateful to H. Mayer, A. Cazabat and F. Corona for the help with building the EMSWG gun as well as to A. Zelnikov for many discussions on the subject.
Declaration of interests
The authors report no conflict of interest.
Appendix A. Summary of characteristic time and length scales
Characteristic time and spatial scales for a (water, ethanol, glycerol) drop of radius  $R_{0}=0.25~\text{cm}$, surface tension
 $\unicode[STIX]{x1D70E}=(0.072,0.022,0.063)~\text{N}~\text{m}^{-1}$ at
 $25\,^{\circ }\text{C}$ (Lide Reference Lide2006--2007), density
 $\unicode[STIX]{x1D70C}=(998,789,1261)~\text{kg}~\text{m}^{-3}$ at
 $20\,^{\circ }\text{C}$ (Lide Reference Lide2006--2007), acceleration
 $a=10^{5}~\text{m}~\text{s}^{-2}$, sound speed
 $c_{0}=(1479,1170,1923)~\text{m}~\text{s}^{-1}$ at
 $20\,^{\circ }\text{C}$ (Giacomini Reference Giacomini1947; Pryor & Roscoe Reference Pryor and Roscoe1954; Association 1963), dynamic viscosity
 $\unicode[STIX]{x1D707}=(0.89,1.2,1410)\times 10^{-3}~\text{Pa}~\text{s}$ at
 $20\,^{\circ }\text{C}$ (Lide Reference Lide2006--2007), the second (volume) viscosity
 $\unicode[STIX]{x1D701}=(2.4,3.2,1490)~10^{-3}~\text{Pa}~\text{s}$ at
 $17.4\,^{\circ }\text{C}$ (Liebermann Reference Liebermann1949; Han et al. Reference Han, Lu, Punyamurtula, Chen, Surani, Kim and Qiao2008),
 $[K]=K_{\infty }-K_{0}=O(K_{\infty })$ with static
 $K_{0}$ and dynamic
 $K_{\infty }=(2.19,0.9,4.34)~\text{GPa}$ volume elastic moduli at
 $20\,^{\circ }\text{C}$ (Shaughnessy, Katz & Schaffer Reference Shaughnessy, Katz and Schaffer2005), as well as dynamic shear modulus
 $G_{\infty }=(2.44,1.02,3.5)~\text{GPa}$ at
 $25\,^{\circ }\text{C}$ (Rodnikova Reference Rodnikova2007). For brevity we introduce
 $\unicode[STIX]{x1D6FE}\equiv \unicode[STIX]{x1D70E}/\unicode[STIX]{x1D70C}$ and kinematic viscosity
 $\unicode[STIX]{x1D708}=\unicode[STIX]{x1D707}/\unicode[STIX]{x1D70C}$.

The drop dynamics is governed by several factors: compressibility, capillarity, viscous diffusion and inertia. Each of these processes is characterized by associated time and length scales estimated in table 2 based on the available data for the temperatures close to our experimental conditions. While the kinematics data in the inset of figure 2(c) indicate that  $V_{max}$ and
 $a_{max}$ are interrelated, although not through a monotonic dependence, the analysis in § 4.2 suggests that
 $a_{max}$ is a more appropriate parameter for organizing the data in a monotonic order such as in figure 8(b). Therefore, in table 2 we express all characteristic scales in terms of acceleration only. Characteristic sessile drop radius
 $R_{0}$ is taken to be equal to the radius of a sphere having the volume equal to that of the sessile drop.
Appendix B. Crown regimes: top view
Top view: crown without splash (99.5 wt% glycerol), crown splash (DI water) and crown microdroplet splash (35 wt% ethanol) on the 0.5 mm stainless steel membrane driven by 1000 J initial energy. Physical image size is  $20.0\times 20.0~\text{mm}^{2}$. Diameter of the fingers at time stamp
 $1600~\unicode[STIX]{x03BC}\text{s}$ is
 ${\sim}0.55~\text{mm}$ and the diameter of the initially ejected microdroplets at the same time stamp is
 ${\lesssim}0.18~\text{mm}$, which are much smaller than the droplets emitted in the crown splash regime and which are followed by larger droplets as is evident from the photograph. The frame size and rate are the same as in figure 7.

Appendix C. Electromagnetic shock wave generator
The set-up in figure 29 consists of five functional parts detailed below: (a) an electromagnetic shock tube assembly as well as (b) charging, triggering, measuring and capturing units; the latter is discussed in § 2.1.
Schematics of the experimental set-up. (a) Exploded view of the EMSWG gun, which consists of a slab spiral coil  $L=1~\unicode[STIX]{x03BC}\text{H}$ mounted on the face of an acoustically hard, electrically insulated base and is separated by a thin insulating layer from an opposing metallic membrane M, a thick copper disk
 $\text{D}$, and a copper membrane (
 $\text{D}=\varnothing \,76~\text{mm}$) which are assembled in a case manufactured out of Delrin. The slab spiral coil is of outer diameter 97 mm and has 5 turns with square cross-section (
 $6.25\times 6.25~\text{mm}$) with the gap between two sequence turns being 3.1 mm. A thick copper disk (
 $\varnothing \,125\times 12.5~\text{mm}$) is placed underneath the flat spiral coil to damp undesired EM field oscillations. Smooth copper membrane (alloy 110) of different thicknesses
 $h_{0}=0.034{-}0.5~\text{mm}$ is clamped above the flat spiral coil at 6.25 mm distance. (b) Electrical circuit. Inset shows examples of a scaled main signal in the circuit and the corresponding measured membrane deflection trajectory for the initial energy 390 J and membrane thickness 0.1 mm. The delay between membrane deflection and EM oscillations is due to the inertia of the former (see text); for the same reason the membrane trajectory does not follow the EM oscillations.

An electromagnetic shock tube. Discharging the capacitor bank into the coil builds up a substantial transient current and hence electromagnetic field in the coil, which in turn induces eddy currents in both the metal membrane M (a load-bearing element on which a liquid drop of varying volume is placed) and in a thick copper disk D. According to Lenz’s law, the direction of the eddy current always opposes the primary current (in the coil) that produced it. Next, these two opposite currents induce a Lorentz force which repels the membrane away from the coil. Also the eddy current in the thick copper disk D generates a secondary magnetic field which opposes the primary one and damps the undesired magnetic field to some extent. The acceleration of the membrane produces a pressure wave in the medium on top of it such as in the drop sitting on the membrane. If the acceleration is rapid, the pressure wave will steepen, as it propagates, due to the nonlinearities in the medium and a shock wave will form. The peak EM pressure in the vicinity of the membrane can be estimated (Eisenmenger Reference Eisenmenger1962) from  $p_{max}=2\unicode[STIX]{x1D707}_{0}n^{2}I_{max}^{2}/D^{2}$, where
 $I_{max}$ is the peak discharge current,
 $\unicode[STIX]{x1D707}_{0}$ the permeability of the free space,
 $D$ the diameter and
 $n$ the number of turns in the slab coil. Thus the peak emitted pressure pulse is proportional to the square of the maximum current. To maximize the EM pressure in the near field of the membrane one should increase the turns density
 $n$ on the slab coil, which, however, increases the coil inductance
 $L$ and thus reduces the maximum current
 $I_{max}$. The parameters of the circuit were chosen to achieve a fast decaying EM oscillatory behaviour, which is confirmed by the oscillogram of the current in the inset of figure 29(b). The membrane deflection shows the expected natural frequency oscillations. In fact, as one can see from this inset, the form of EM signal is not crucial as it operates on a much shorter time scale compared to that defined by the circular plate dominant natural frequency
 $\unicode[STIX]{x1D714}_{M}\sim h_{0}(Y/\unicode[STIX]{x1D70C})^{1/2}/D$, where
 $Y=128~\text{GPa}$ is the Young modulus and
 $\unicode[STIX]{x1D70C}=8960~\text{kg}~\text{m}^{-3}$ the density of the copper. Indeed, the oscillator
 $\ddot{x}+\unicode[STIX]{x1D714}_{M}^{2}x=\unicode[STIX]{x1D6FF}_{D}(t)$ driven by the Dirac delta-function
 $\unicode[STIX]{x1D6FF}_{D}(t)$ signal behaves as
 $x(t)\sim tH(t)$ at early times, i.e. in the same fashion as in the inset of figure 29(b). For the same reason and due to the screening effect of the copper membrane we can neglect any influence on surface tension by the EM field. Use of membranes of different thicknesses
 $h_{0}=0.034,0.1,0.17$, and 0.5 mm allowed us to operate when
 $\unicode[STIX]{x1D70F}_{M}=2\unicode[STIX]{x03C0}/\unicode[STIX]{x1D714}_{M}$ could be either much longer or comparable to the essential time scales of the drop dynamics (appendix A) – this makes the phenomena complex enough even without the fluid–structure interaction present in drop impacts on soft membranes (Howland et al. Reference Howland, Antkowiak, Rafael Castrejón-Pita, Howison, Oliver, Style and Castrejón-Pita2016; Chantelot et al. Reference Chantelot, Clanet, Coux and Quéré2018a).
Electrical circuit and components. Experiments were carried out with the apparatus sketched in figure 29(b). Two  $10~\unicode[STIX]{x03BC}\text{F}$-10 kV capacitors
 $C_{1}$ (Arizona Capacitors, LK100-106YND) are charged with a high voltage power supply
 $\text{HV}_{1}$ (Matsusada, EQ-30P1-LG) to the desired voltage
 $\unicode[STIX]{x1D711}=8.7{-}12.5~\text{kV}$. Upon charging, the high voltage power supply is disconnected and a trigger pulse (20 kV) is sent to a sealed spark gap S.G. (Del Mar Photonics, RU-78-TSG), which guarantees repeatability of the experiments compared to an in-house constructed spark: the operation of the latter would be prone to variations in the ambient humidity and temperature since the physical mechanism of a spark gap operation is based on streamer initiation and propagation across the gap, as well as subsequent heating to form the arc channel decreasing the spark gap resistance and thus leading to the capacitor discharge (Williams & Peterkin Reference Williams and Peterkin1989). Also, extremely short rise time of spark gaps (Lehr et al. Reference Lehr, Baum, Prather, Torres, Heyman, Mandelbaum and Shiloh1999) enables accurate timing necessary for building a time series from delayed snapshots. The trigger pulse releases the energy stored in the capacitor, which is then delivered to a flat spiral coil. Circuit elements are connected with short lengths of aluminium bar or braided copper wire, so that the stray inductance of the circuit excluding the EMSWG unit was kept to a minimum of 535 nH. To reach a variety of peak pressures
 $p_{max}$, different
 $h_{0}$ and initial stored energies in capacitors (
 $E={\textstyle \frac{1}{2}}C_{1}\unicode[STIX]{x1D711}^{2}=250,390,500,750,1000~\text{J}$) were used with the help of different combinations of two
 $10~\unicode[STIX]{x03BC}\text{F}$-10 kV capacitors: to have 250 and 390 J energy in the capacitors, we connected them in sequence and charged to 10 kV and 12.5 kV, respectively; in the case of 500 J, a single capacitor was charged to 10 kV; and, in order to have 750 and 1000 J energies, capacitors were connected in parallel and charged to 8.7 and 10 kV, respectively.
Measuring/discharge circuit. To ensure the repeatability of the experiment a secondary loop, consisting of  $R_{3}=50~\text{k}\unicode[STIX]{x1D6FA}$–10 W and
 $R_{3}^{\prime }=5~\text{M}\unicode[STIX]{x1D6FA}$ (Ohmite 588-MOX-H-025004FE) resistors as well as an oscilloscope (Tektronix TDS
 $2024B$), was connected in parallel to the main circuit in order to measure a scaled signal. In each run, voltage across the
 $50~\text{k}\unicode[STIX]{x1D6FA}$ resistor was recorded using the oscilloscope and a Tektronix
 $P2220$ voltage probe with attenuation factor of
 $10X$. A sample measured signal for the sequence capacitor configuration charged to 12.5 kV is shown in the inset of figure 29(b): just prior to the main signal, there is a small peak with a maximum amplitude of around 2 kV which corresponds to the trigger signal (shown with an arrow). After each experiment a remaining charge in the capacitors was precisely measured using the same type of circuit as shown in figure 29(b), but with different values of the two resistors,
 $R_{3}^{\prime }=500~\unicode[STIX]{x1D6FA}$ (Ohmite
 $20J500E$) and
 $R_{3}=50~\unicode[STIX]{x1D6FA}$ (
 $20J50RE$), connected in sequence with the capacitor. The energy remaining in the capacitors ranged only from 0.1 J in the 250 J runs to 0.5 J in the 1000 J runs.
The triggering circuit includes two capacitors  $C_{2}$ (EPCOS, B43564A5108M000), a thyristor SCR (Powerex, T600121804BT), a transformer (Del Mar Photonics, TT511A), a
 $R_{2}=500~\unicode[STIX]{x1D6FA}$-10 W resistor (Ohmite
 $20J500E$), and a high voltage power supply
 $\text{HV}_{2}$ (Stanford Research System, PS325/2500V-25W). To generate a trigger pulse, the capacitors
 $C_{2}$ were charged up to 400 V and then disconnected from a high voltage power supply. The thyristor, used in our set-up in lieu of a mechanical switch, which would be prone to non-repeatability due to sparks at
 $O(10^{2})\,\text{V}$, is controlled by receiving a 2.5 V pulse on its own trigger lead, enabling the delivery of the capacitors energy to the transformer. Measured voltage across the primary winding of the transformer showed that the voltage at the input was around 200 V boosted by the transformer to 20 kV. This output voltage provides the trigger pulse to induce breakdown in the sealed spark gap, which eventually delivers the main capacitors
 $C_{1}$ energy to the flat spiral coil
 $L$.