Introduction
Precision irrigation allows the differential application of the exact amount of water to the desired irrigated areas compensating for any variability in soils or crop development, thus optimizing yields and profitability. The technological developments of the past few years have brought to market systems for the differential and variable rate application of water. At the same time, much effort has gone into the precise determination of the crop water needs. Important developments, such as the FAO 56 methodology (Allen et al., Reference Allen, Pereira, Raes and Smith1998) or the use of eddy covariance (Williams, Reference Williams, Cable, Hultine, Hoedjes, Yepez, Simonneaux and Timouk2004), allow for the precise determination of evapotranspiration (Eto), sometimes to a fraction of a millimetre. The main scientific challenge, which has sometimes been overlooked, is the ability to apply these irrigation requirements with the desirable level of precision. This has to be achieved through both correct system design and the use of appropriate irrigation equipment, such as sprayers and sprinklers.
Uneven sprinkler application due to poor design or performance will result in some areas receiving less water than others, which manifests itself in discoloured turf patches and drought-induced dormancy. This usually leads producers to increase the average application rate to overcome the brown patches. Thus, the amount of water applied in irrigated landscapes and crops is nearly always much greater that the actual plant water needs in order to account for non-uniformity in the application pattern (Kjelgren et al., Reference Kjelgren, Rupp and Kilgren2000). Uniformity of water distribution is a measure of the variability in application depth over a given area. Irrigation can be uniform and inefficient due to mismanagement (i.e., over-irrigation), which can be corrected through precision irrigation; however, irrigation cannot be non-uniform and efficient. As a result, irrigation uniformity can be a good indication of potential irrigation efficiency (Howell, Reference Howell2003).
Two methods have been used successfully to quantify uniformity: distribution uniformity (DU) and the coefficient of uniformity (CU) (Baum et al., Reference Baum, Dukes and Miller2005). The distribution uniformity represents the spatial evenness of the applied water across a field. The lower quarter irrigation distribution uniformity DUlq can be calculated with the following equation (Merriam and Keller, Reference Merriam and Keller1978):
 $$DU_{{lq}} \,{\equals}\,{{\overline{D} _{{lq}} } \over {\overline{D} _{{total}} }}$$
where Dlq is lowest quarter of the average of a group of catch container measurements and Dtotal is the total average of all catch container measurements.
A sprinkler system that applies the same depth of water over the entire coverage area would have a DUlq of 100%. By contrast, a DUlq of 50% means that part of the turf receives half the average amount (Goldhamer and Snyder, 1989). As a result, a turf irrigated with a system with a DUlq of 50% will need twice the amount of water compared to a similar system with a DUlq of 100%, in order to ensure that the dry areas received the minimum required irrigation. The DUlq of a sprayer system varies with the type of sprayer nozzle used. According to Kjelgren et al. (Reference Kjelgren, Rupp and Kilgren2000) with optimum design, DUlq values of impact/gear drive sprinklers for large turf areas can be up to 90%, while those of spray heads in small turf areas rarely exceed 75%.
Christiansen proposed a coefficient intended mainly for sprinkler systems based on the catch volumes given as (Christiansen, 1942):
 $$CU\,{\equals}\,1{\minus}{{\mathop{\sum}\limits_{i\,{\equals}\,1}^n {\left| {D_{i} \,{\minus}\,\overline{D} _{{total}} } \right|} } \over {\mathop{\sum}\limits_{i\,{\equals}\,1}^n {D_{i} } }}$$
where CU is the Christiansen’s uniformity coefficient, Di is the depth (or volume) of water in each of the equally spaced catch containers in mm.
Generally, more water is lost by sprinklers and sprayers that discharge water at high angles and over great distances, because of greater evaporation (Schneider, Reference Schneider2000). In addition, greater water losses occur from systems that discharge a greater proportion of small droplet sizes because small droplets are more readily carried by wind and they expose more surface area to the atmosphere for evaporation (Boman et al., Reference Boman, Clark, Haman, Harrison, Izuno, Pitts and Zazueta1991). In Florida, Micker (Reference Micker1996) conducted a series of tests in residential irrigation systems. The low quarter distribution uniformities (DUlq ) of the homes tested ranged from 0.32 to 0.60, averaged 0.45, and would be considered in the ‘fair’ to ‘fail’ range, with the exception of one ‘good’ according to the Irrigation Association (2003) classification. The mean DUlq of the rotor sprinklers was 0.49, which was statistically higher than the mean DUlq of the sprayers at 0.41.
Through precision irrigation it is possible to compensate for within-field variabilities in evapotranspiration and soil characteristics, only if the sprayers and sprinklers apply water at the desired rate and with a uniform pattern. The purpose of this study was to evaluate the performance of sprayer nozzles manufactured by two leading companies, and determinate their suitability for use under conditions of precision irrigation.
Material and methods
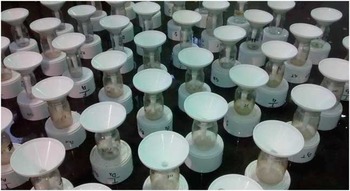
The experiment was carried out indoors at the Hydraulic Laboratory of the University of Évora, in Portugal. The choice of an indoor location provided full control over the environment conditions, such as evaporation and wind drift. The catch-can method of uniformity testing was used to evaluate the performance of the different nozzles used in pop-up sprayers under optimum conditions (Figure 1).
Partial view of the catch-cans used in this experiment.

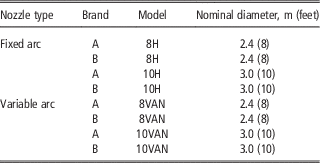
The tests performed for this study were a combination of the testing methods of both the ASAE standards and the NRCS MIL guidelines (ASAE, 2000, Micker, Reference Micker1996). Plastic cans with a diameter of 170 mm were used, which are larger than the 101 mm (4’) recommended by the NRCS MIL (Micker, Reference Micker1996). In order to eliminate evaporation, funnels were used, with the water retained in a jar under the funnel. The upper limit of the funnels were 10 mm above the edge of the sprayer body, thus replicating the field set up of the pop-up sprayers. All tests were carried out at the manufacturers’ recommended 2.1 bar pressure. Fixed arc and variable arc spray nozzles (Table 1) with a nominal diameter of 2.4 m (8’) and 3.0 m (10’) from two leading makes of sprayer nozzles were used, and designated as brand A (Rainbird) and brand B (Hunter). The tests were carried out at around 15°C air temperature, and the system run was 30 minutes for each test. The volume of water collected in each jar was measured with a 500 ml graduated cylinder.
Type and nominal diameter of the nozzles used in this experiment

Catch cans were placed in either a 0.3 m (1’) or 0.6 m (2’) square grid, depending on the range of the sprayer, in such a way as to have a minimum of 25 and a maximum of 50 sampling points in each experiment. The MIL (Micker, Reference Micker1996) catch-can test procedure requires only 16–24 cans. A dedicated pump and a constant level reservoir were used to maintain a constant pressure of 3.5 bars at the inlet of the experiment. Additionally, constant nozzle pressure was obtained by using an Hunter institutional sprayer body with built in pressure regulator, that ensures a final pressure of 2.1 bars at the nozzle.
In this work, spray pattern of individual sprayers was measured, instead of the usual field setup of overlapping sprayers. This individual pattern was then used to create synthetic overlapping spray patterns, thus allowing for the study of different spray spacings.
Most farmers and landscape irrigators will tolerate small under-irrigated areas in their crops and lawns, and will plan their irrigation so that a certain percentage of the area receives at least the desired depth. Usually, for landscape purposes, the acceptable under-irrigated threshold is limited to 20–25% of the total area.Thus a new index, called Premium Irrigation Ratio, PIR, was developed to calculate the average depth of water that needs to be applied to the whole field so that 75% of the area receives at least 1 mm of irrigation depth. The PIR can be expressed as:
 $$75PIR\,{\equals}\,10{{\overline{D} _{{total}} } \over {D_{{p25}} }}$$
where Dp25 is the application depth at the 25 percentile of the irrigated area.
Another important indicator is the degree to which some areas of the field are over-irrigated, in order to satisfy the needs of the lower 25 percentile of the field. Thus, Soaking Index, can be defined as the average irrigation depth at the upper quartile area, divided by the application depth of the lower 25% percentile, which represents the acceptable irrigation threshold:
 $$SI\,{\equals}\,{{D_{{uq}} } \over {D_{{P25}} }}$$
where Duq is the average application depth at the upper quartile of the irrigated area.
Results and discussion
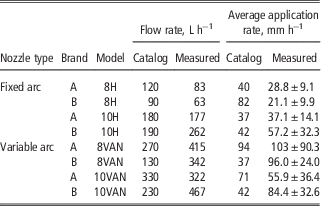
The experiments were carried out under ideal conditions which included the use of pressure compensating professional sprayers, flat area, no wind and no evaporation. The experimental results indicate that the flow rates observed for the fixed arc nozzles are generally in agreement with the manufacturer published values (Table 2). The flow rates of the variable arc nozzles are generally higher than the catalog values, specially for the 8 H nozzles, where in both brands, the measured values are around 200% of the catalog values. The implications of this difference are important at the system design level, since the piping and the pumping systems need to be sized accordingly.
Catalog and measured flow rates and average application rates of the 8 tested nozzles (the values are for the manufacturer recommended square spacing).

Table 2 also shows that the average application rates of the fixed nozzles are acceptable, ranging between 21.1±9.9 mm and 57.2±32.3 mm which should not cause any water logging or runoff in most soils. For the variable arc nozzles, the average application rates varied between 55.9±36.4 mm and 103±90.3 mm which are above what most soils can infiltrate under normal conditions, thus resulting in runoff.
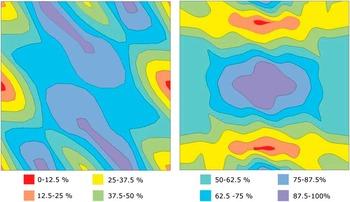
Figure 2 presents the application pattern of variable arc 8 VAN nozzle (left) and of fixed arc 8 H (right) nozzles at the recommended 2.4 m square spacing. In each case, the full application range was divided into 8 equal classes. It can be observed that in both types of nozzles, the maximum application rates occur at the middle, with low application rates near the actual sprayers. This pattern is well known to many landscape irrigation managers who face brown patches in the turf immediately in front of the sprayers, and waterlogged areas in the mid-way between the sprayers, even under optimum back to back system design.
Application pattern of 8VAN nozzles (left) and 8H nozzles (right) placed on a 2.4 m (8’) by 2.4 m grid, as recommended by the manufacture (in each case, the full application range was divided into 8 equal classes).

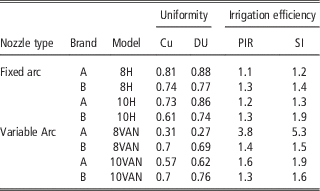
The CU and DU of the various sprayers is presented in Table 3. It can be observed that the CU of the fixed arc nozzles varied between 0.61 and 0.81, while the variable arc nozzles had CU values of between 0.31 and 0.7. A similar pattern was observed in regards to DU, where the values for fixed arc nozzles varied between 0.74 and 0.88, while the variable arc nozzles had values between 0.27 and 0.76. Given the highly favourable conditions of this experiment, these values can be assumed as the maximum theoretical values. Actual field tests such as those reported by Baum et al. (Reference Baum, Dukes and Miller2005) would be lower. These authors carried out over 100 residential turf measurements and they observed DUlq values of 0.49 with rotor zones and 0.41 with spray zones. In assessments of irrigation sprinkler system performance in California, Pitts et al. (1996) found a mean DUlq of all systems tested of 0.64. The average DUlq for non-agricultural turfgrass sprinklers (residential lawns) was 0.49. They observed that more than 40% of the tested systems had a DUlq of less than 0.40.
Uniformity and irrigation efficiency of the 8 nozzles tested in this work

The PIR values for the fixed arc nozzles are low, indicating excellent irrigation efficiency. The values are extremely high for some of the variable arc nozzles, ranging between 1.3 and 3.8, indicating that these nozzles can result in significant water losses. Similarly, the SI values indicate that variable arc nozzles result in highly over-irrigated areas.
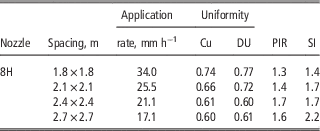
Sprayer spacing is a critical factor for achieving uniform application of water. It is generally accepted that sprinklers and sprayers should be spaced so that water from one sprinkler covers at least 100% of the distance to the adjacent sprinklers (NRCS, MIL). In this work various sprayer spacings were simulated. The results for the 8 H nozzles at spacings of 1.8 m (6’), 2.1 m, (7’), 2.4 m, (8’) and 2.7 m (9’) (Table 4) show that as the spacing increases, the quality of the irrigation decreases significantly. For the 8 H nozzles, the best spacing is 1.8 m, which is 70% if the catalog radius. This is due to the fact that the fixed nozzles actually have a shorter throw than the values specified in the catalog. An important aspect is the increase in PIR from 1.3 to 1.7, when spacing increased from 1.8 m to 2.4 m, resulting in greater water use in order to obtain the same results.
Influence of sprayer spacing on the uniformity, PIR and SI of 8H nozzle.

Conclusions
Precision irrigation can compensate for irregularities in soil characteristics, crop needs and topography, but requires the nozzles to perform well and provide uniform application patterns. This study shows that the application uniformity of fixed arc nozzles is higher than the variable arc nozzles. Moreover, their average application rates are much smaller than those of the variable arc nozzles. The later with average application rates of 33 to 103 mm h−1 can induce runoff in many soil types. Two new indexes were presented in this work, the PIR and the SI. The results show that variable arc nozzles have higher PIR which results in greater water use. These nozzles also present higher SI values, and thus result in greater water logging in some areas of the field.
It was also observed that the variable arc nozzles had significantly higher application rates than the catalog values which should be taken into consideration when designing or retro-fitting irrigation systems. Based on this work, it can be concluded that for a successful precision irrigation project, it is necessary to carefully select the nozzles and carry out field trials prior to any system design or implementation. The use of variable arc nozzles is not recommended in precision agriculture.
Acknowledgments
This work was funded by National Funds through FCT - Foundation for Science and Technology under the Project UID/AGR/00115/2013.