Implications
The adapted GrazeIn model predicts grass dry matter intake (GDMI) and milk yield (MY) for spring calving grazing dairy cows with increased prediction accuracy compared with the original model. The adapted model can be used as a decision support tool to provide dairy farmers with more accurate estimates of the GDMI and MY of cows in their herds. The use of GrazeIn as a decision support tool could lead to reduced costs of milk production and increased profitability through increased accuracy in the grazing management decision-making process, increased grass utilisation, increased stocking rates and reductions in concentrate and forage supplementation.
Introduction
In 2015, the EU milk quota system will be removed and with this, there is expected to be increased volatility in milk prices (Shalloo et al., Reference Shalloo, Creighton and O’Donovan2011). Grazed grass is the cheapest feed source available to dairy farmers with a relative cost ratio of grazed grass to concentrate of 1 : 2.4 (Finneran et al., Reference Finneran, Crosson, O’Kiely, Shalloo, Forristal and Wallace2010). There is a strong inverse relationship between the total cost of production and the grazed grass proportion in the dairy cow diet (Dillon et al., Reference Dillon, Roche, Shalloo and Horan2005). The average milk production cost is reduced by €0.025/l with a 10% increase in the proportion of grazed grass in the dairy cow diet (Dillon et al., Reference Dillon, Roche, Shalloo and Horan2005). Thus, increasing the grazed grass proportion also reduces dependence on purchased feed, which is also subject to substantial price volatility. Grass dry matter intake (GDMI) also has a major effect on the production performance of grazing dairy cows (Dillon et al., Reference Dillon, Roche, Shalloo and Horan2005) and dairy farm profitability (Shalloo, Reference Shalloo2009). Increasing the grazed grass proportion in the dairy cow diet results in lower milk production costs and increased profitability (Shalloo, Reference Shalloo2009).
The prediction of DMI in dairy cows has received much attention through the years owing to the impact that DMI has on cow performance (Ingvartsen, Reference Ingvartsen1994). Accurate prediction models simulating dairy cow GDMI are useful as decision support tools with regard to the feeding and management of grazing dairy cows. Inaccurate prediction models limit the ability to anticipate the technical consequences of adopting different strategies for GDMI and milk yield (MY) management on individual dairy farms (Shah and Murphy, Reference Shah and Murphy2006). Model evaluation is an important process to establish the accuracy of model predictions and to identify weaknesses that need to be addressed in the model (Tedeschi, Reference Tedeschi2006).
Using a tested and well-parameterised model to predict the GDMI and MY of grazing dairy cows would provide valuable information, aiding the decision-making process around grazing management, to optimise the grazed grass proportion in the dairy cow diet and to increase farm profitability. The GrazeIn model (Delagarde et al., Reference Delagarde, Faverdin, Baratte and Peyraud2011a;Faverdin et al., Reference Faverdin, Baratte, Delagarde and Peyraud2011) predicts GDMI and MY of individual cows using individual cow data. GrazeIn accounts for the variation in GDMI and MY by including cow, sward, grazing management and supplementation input variables in its calculations. Thus, GrazeIn could be an extremely useful decision support tool for dairy farmers and advisors as the input variables used by GrazeIn are readily available on farms.
Previous studies (O’Neill et al., Reference O’Neill, Lewis, O’Donovan, Shalloo, Mulligan, Boland and Delagarde2013a and Reference O’Neill, Lewis, O’Donovan, Shalloo, Mulligan, Boland and Delagarde2013b) evaluated GrazeIn at both a herd level and an individual cow level using an independent database. The detailed evaluations of GrazeIn by O’Neill et al. (Reference O’Neill, Lewis, O’Donovan, Shalloo, Mulligan, Boland and Delagarde2013a and Reference O’Neill, Lewis, O’Donovan, Shalloo, Mulligan, Boland and Delagarde2013b) highlighted the large error with which MY in autumn/late lactation was predicted, compared with spring and summer/early and mid lactation. As a result, it was necessary to adapt GrazeIn. The objective of this study was to adapt GrazeIn to improve the prediction accuracy of the model for GDMI and MY prediction for spring calving grazing dairy cows. The prediction accuracy was measured/assessed using parameters such as the relative prediction error (RPE).
Material and methods
Model description
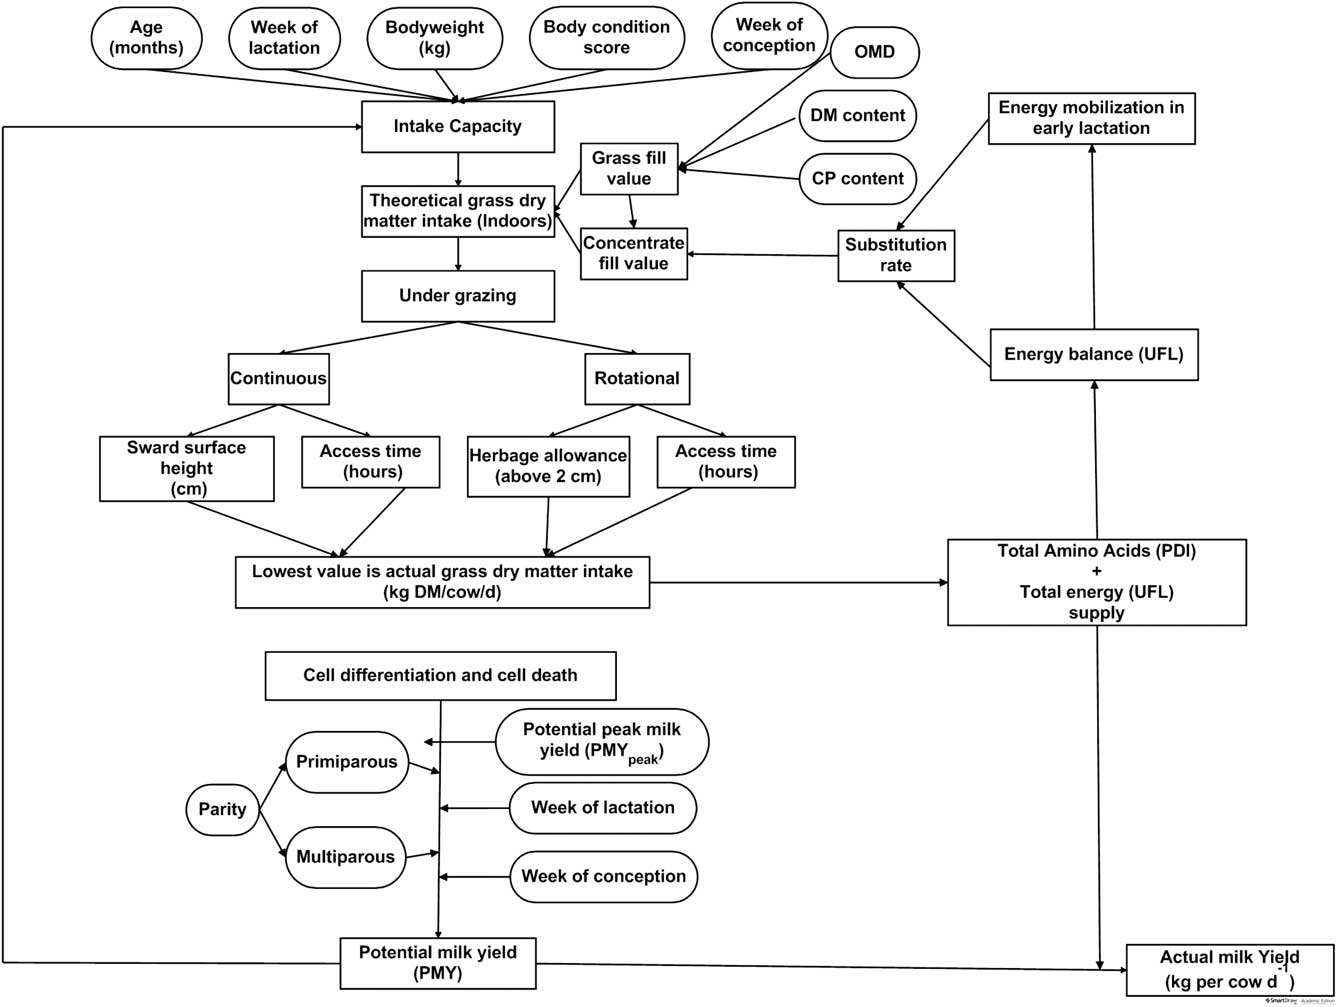
GrazeIn (Delagarde et al., Reference Delagarde, Faverdin, Baratte and Peyraud2011a; Faverdin et al., Reference Faverdin, Baratte, Delagarde and Peyraud2011) is a semi-mechanistic prediction model that simulates the GDMI and MY of grazing dairy cows using easily obtainable cow, sward, grazing management and supplementation variables. Cow variables include age, parity, week of lactation (WOL), potential peak milk yield (PMYpeak), milk fat concentration, milk protein concentration, BW, body condition score (BCS), week of conception, BCS at calving and calf birth weight. Sward variables include grass fill value (FV; an inverse function of its ‘ingestibility’), grass energy concentration (unité fourragère lait (UFL); 1 UFL is equal to the net energy for lactation of 1 kg of standard air-dry barley) and grass protein value (true protein absorbable in the small intestine when rumen fermentable energy is limiting microbial protein synthesis in the rumen; PDIE). Grazing management variables include pre-grazing herbage mass and daily herbage allowance. Supplementation variables include quantity of supplementation offered and nutritive value (UFL, FV and PDIE) of supplementation offered. Once all inputs have been entered, the model uses these in the sub-models (GDMI and MY) (Figure 1). The sub-models in GrazeIn are linked such that outputs from one sub-model are being used automatically as inputs in the other sub-model and vice-versa through a process of iterative calculations focused on convergence to predict GDMI and MY.
Structure of the GrazeIn model of grass dry matter intake (GDMI) and milk yield (Delagarde et al., Reference Delagarde, Faverdin, Baratte and Peyraud2011a; Faverdin et al., Reference Faverdin, Baratte, Delagarde and Peyraud2011).

GrazeIn is capable of calculating GDMI and MY for each individual cow or for the grazing herd (all cows grazing in the same paddock, managed identically and receiving a sward of equal quality and composition) using cow, sward, grazing management and supplementation input variables.
Brief descriptions of the sub-models are provided below, and more detailed descriptions are provided by Delagarde et al. (Reference Delagarde, Faverdin, Baratte and Peyraud2011a) and Faverdin et al. (Reference Faverdin, Baratte, Delagarde and Peyraud2011).
Intake model, grazing model and interactions
The GrazeIn model (Figure 1) is based on the French fill unit system (Dulphy et al., Reference Dulphy, Faverdin and Jarrige1989). The fill unit system predicts the intake capacity (IC) of the cow and FV of the feed in the same units, namely, fill units (FU).
GrazeIn uses the additive effects of BW, BCS and PMY and the multiplicative effects of the age of the cow (index of maturity; IM) and physiological state of the cow (index of lactation; IL and index of gestation; IG) to calculate IC (Faverdin et al., Reference Faverdin, Baratte, Delagarde and Peyraud2011). GrazeIn uses age (months), WOL (weeks) and week of conception (expressed in terms of WOL that conception occurred) to calculate these indices:
 $$\eqalignno{ & {\rm Intake \ capacity } \ \left( {{\rm FU}} \right) \cr & \quad=(9.4{\plus}0.0015\,{\rm BW} \ \left( {{\rm kg}} \right)-{\rm 1}.{\rm 5 \ BCS}\,{\rm (scale } \ 0{\minus}{\rm 5)} \cr \qquad{\plus}0.{\rm 15 \ PMY}\,({\rm kg/cow \ per \ day})){\times}{\rm IL}{\times}{\rm IG}{\times}{\rm IM } $$
The prediction of GDMI occurs in two steps. The first step is the calculation of theoretical GDMI. This assumes that the cow was offered fresh cut grass ad libitum indoors and takes into account the cow, sward and supplementation characteristics (Faverdin et al., Reference Faverdin, Baratte, Delagarde and Peyraud2011). GrazeIn calculates the FV of the grass consumed and the concentrate fed separately. The second step amends the theoretical GDMI obtained indoors by taking into account the factors that limit intake at grazing (Faverdin et al., Reference Faverdin, Baratte, Delagarde and Peyraud2011). The grazing model accounts for the restrictions placed on DMI when cows are grazing in rotational or continuous stocked systems.
GrazeIn accounts for the interactions between the cow, sward, grazing management and supplementation input variables using intermediate values calculated by iterative processes in the model (Delagarde et al., Reference Delagarde, Faverdin, Baratte and Peyraud2011a; Faverdin et al., Reference Faverdin, Baratte, Delagarde and Peyraud2011).
A full description of the GDMI sub-model used in GrazeIn can be found in Faverdin et al. (Reference Faverdin, Baratte, Delagarde and Peyraud2011).
MY model
The daily MY is predicted using the response of MY to energy and protein supply as described by Faverdin et al. (Reference Faverdin, Baratte, Delagarde and Peyraud2011). The predicted MY is dependent on the requirements of the mammary gland (PMY) and the quantities of energy and protein supplied to the mammary gland by the feed consumed by the cow. GrazeIn simulates a lactation curve based on theoretical modelling of a dynamic population of secretory cells in the mammary gland. The number of secretory cells is used to simulate the shape of the PMY curve. The dynamics of production during lactation are modelled on secretory cell differentiation and secretory cell death. The genetic potential of the cow to produce milk does not affect the number of secretory cells in the mammary gland but influences the ability of the secretory cells to synthesise milk. This is reflected in the PMY of the cow. GrazeIn can predict different MY responses to similar energy supplies according to the genetic merit of the cow using the PMY. The PMY of the cow is a function of parity (multiparous or primiparous), WOL, PMYpeak and stage of gestation (Faverdin et al., Reference Faverdin, Baratte, Delagarde and Peyraud2011). The GrazeIn model thus requires PMYpeak as an input variable.
Moorepark database description
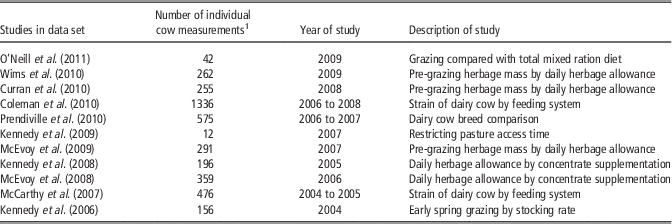
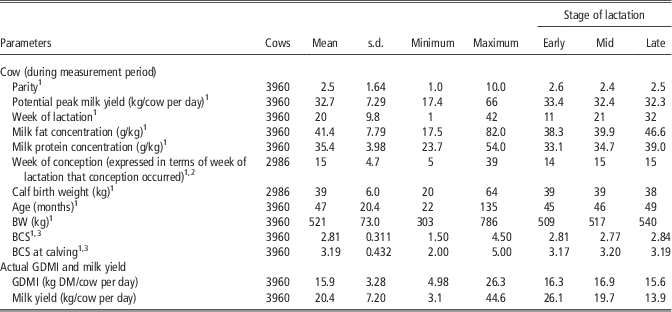
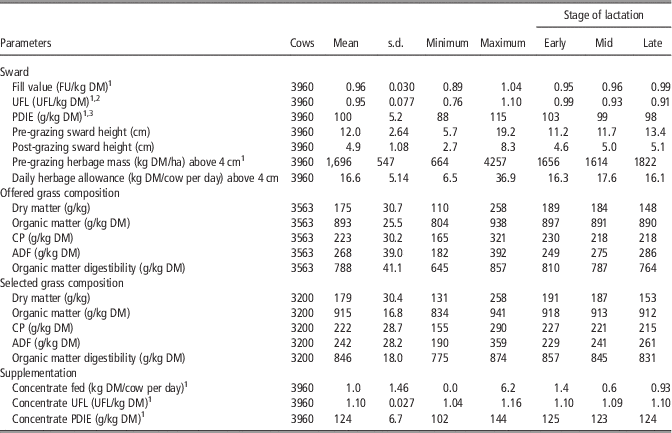
To carry out the adaptation and evaluation of GrazeIn, data from the Moorepark database (O’Neill et al., Reference O’Neill, Lewis, O’Donovan, Shalloo, Mulligan, Boland and Delagarde2013b) were used as model input data to simulate GDMI and MY. From an original database of 8787 individual cow measurements, a data set of 4514 cows with measured data for all required input variables was selected. From this data set, 554 cows were removed, as these were cows in herds where >30% of the herd had been removed owing to lack of complete measured data. This resulted in a data set of 3960 individual cow measurements available for use from 11 published studies spanning the years 2004 to 2009 (Table 1). A description of the cow, sward, grazing management and supplementation variables for the data set can be found in Tables 2 and 3. All cows in the data set were from spring calving herds resulting in stage of lactation and season being confounded. Cows in the data set had a mean PMYpeak of 32.7 kg/cow per day (Table 2) and a mean actual daily GDMI of 15.9 kg DM/cow per day. The mean actual MY was 20.4 kg/cow per day (Table 2). Cows in the data set received concentrate supplementation ranging from 0.0 kg to 6.2 kg DM/cow per day (Table 3).
The 11 grass-based lactating dairy cow studies included in the data set of 3960 individual cow measurements, which was used to adapt the GrazeIn model and to evaluate the adapted model

1 Total number of individual cow measurements in each study.
Mean, standard deviation and range of the cow, grass dry matter intake (GDMI) and milk yield variables for the total data set (n=3960) and the mean values in early (0 to 16 weeks), mid (17 to 25 weeks) and late lactation (>26 weeks)

1 Variable used as input variable in the GrazeIn model.
2 Only includes cows that were pregnant in the lactation during which the GDMI measurement took place.
3 Body condition score (BCS) (scale 0 to 5) (Lowman et al., Reference Lowman, Scott and Somerville1976).
Mean, standard deviation and range of the sward, grazing management and supplementation variables for the total data set (n=3960) and the mean values in early (0 to 16 weeks), mid (17 to 25 weeks) and late lactation (>26 weeks)

1 Variable used as input variable in the GrazeIn model.
2 Unité Fourragère Lait (UFL) (feed unit for milk).
3 True protein absorbable in the small intestine when rumen fermentable energy is limiting microbial protein synthesis in the rumen.
Model adaptation
GrazeIn was rebuilt using the C++ programming language with the equations from Delagarde et al. (Reference Delagarde, Faverdin, Baratte and Peyraud2011a) and Faverdin et al. (Reference Faverdin, Baratte, Delagarde and Peyraud2011). Data from the Moorepark data set were used as input variables in both the original and the rebuilt GrazeIn model. The predicted GDMI and MY from both simulations were compared to test the reconstructed model. Following this, the adaptation was carried out, with each step in the adaptation process being additive to the adaptation steps before it. The objective of the adaptation was to increase the prediction accuracy through (1) the inclusion and optimisation of an IC correction coefficient (for GDMI), (2) the inclusion of a body fat reserve (BFR) deposition calculation from 84 days in milk (DIM) onwards and (3) the optimisation of the persistency of the potential lactation curve (for MY). The adaptation process was carried out and evaluated step-by-step with each step including the adaptations described in the previous steps.
Inclusion of IC correction coefficient
Adaptation of the IC was undertaken to reduce the underprediction of GDMI by GrazeIn during lactation. This was achieved by introducing a 5% correction coefficient to increase the IC calculated and used by GrazeIn. This value was derived as follows. The original model accounted for the increase in the maintenance energy requirements of a grazing cow compared with a stall-fed cow by increasing the maintenance energy requirements by 20% (Coulon et al., Reference Coulon, Hoden, Faverdin and Journet1989). In the original model, the increased energy requirements of grazing dairy cows were not matched by an increased IC. A 20% increase in maintenance energy requirements equates to 1 UFL/day for a 600 kg grazing cow compared with the same cow if stall-fed (Coulon et al., Reference Coulon, Hoden, Faverdin and Journet1989). Assuming the energy concentration of grazed grass was 1.00 UFL/kg DM, this equates to a requirement of an extra 1 kg of grazed grass. Assuming a GDMI of 20 kg DM/cow per day, the cow would have to increase GDMI by 5%.
BFR deposition
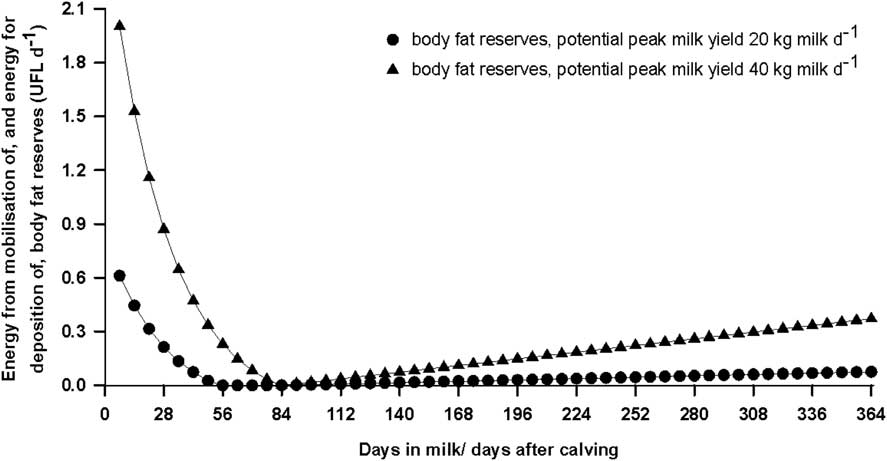
The original model accounted for mobilisation of BFR in the first 84 DIM, expressed in UFL/day and calculated based on PMYpeak, BCS at calving and WOL. The original model did not account for the deposition of BFR after 84 DIM. In reality, the cow regains BFR lost in early lactation, from nadir BCS to the next calving (Friggens et al., Reference Friggens, Ingvartsen and Emmans2004). Including the deposition of BFR in the energy requirements would reduce the amount of energy available for milk production and ultimately reduce predicted MY. The new BFR deposition calculation in the model includes the deposition of BFR from 84 DIM to next calving. This was achieved by calculating the BFR mobilised by the cow from calving to nadir BCS (DIM 84) and then setting that to equal the BFR deposited from 84 DIM to next calving (set at 365 days after previous calving) (Figure 2).
The energy mobilised in early lactation and the energy used for body fat reserve deposition from 84 days in milk to next calving (365 days after previous calving), for a cow with a potential peak milk yield of 20 kg milk/cow per day and a cow with a potential peak milk yield of 40 kg milk/cow per day, both with a body condition score at calving of 2.75 (scale 0 to 5) (Lowman et al., Reference Lowman, Scott and Somerville1976).
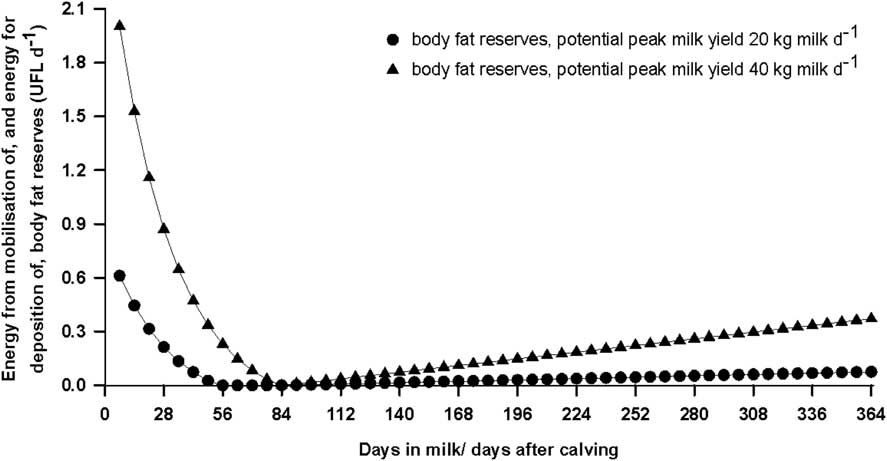
The energy mobilised in the first 84 DIM was calculated using equation (2) for the average daily mobilisation of BFR over the course of the lactation week in early lactation (Faverdin et al., Reference Faverdin, Delaby and Delagarde2007 and Reference Faverdin, Baratte, Delagarde and Peyraud2011):
 $$\eqalignno{ \rm Average \ daily \ mobilisation \ of \ BFR \ over \ the \ course \ of \ the \cr \rm lactation \ week \ in \ early \ lactation\,{\rm (UFL/day) } \cr \quad = {\minus}{\rm 1}{\plus}[({\rm 1}.{\rm 33}{\times}(a{\plus}(0.{\rm 47}{\times}{\rm potential \ peak \ milk \ yield})\cr \qquad{\plus} ({\rm 1}.{\rm 89}{\times}{\rm BCS \ at \ calving}))] \cr \qquad{\times}\left( {{\rm e}^{{{\minus}0.25{\times}{\rm week} \ {\rm of} \ {\rm laction}}} -\,{\rm e}^{{{\minus}{\rm week} \ {\rm of} \ {\rm lactation}}} } \right) $$
where a is −9.54 for primiparous cows and −13.24 for multiparous cows.
If the value obtained was negative then the value for mobilisation was zero.
The total BFR mobilised in the first 84 DIM was calculated using the equation (3):
 $$\eqalignno{ & {\rm Total} \ {\rm BFR} \ {\rm mobilised} \ {\rm in} \ {\rm early} \ {\rm lactation}\,\left( {{\rm UFL}} \right) \cr & = {\rm 7}\,{\rm days}\,{\rm per}\,{\rm week}\,{\times}\,\mathop{\sum}\limits_{k=1}^{12} { {\rm average}\,{\rm daily}\,{\rm mobilisation}\,{\rm of}\,{\rm BFR} \atop \displaystyle { \,{\rm over}\,{\rm the}\,{\rm course}\,{\rm of}\,{\rm the} \,{\rm lactation} \atop \displaystyle \,{\rm week}\,{\rm in}\,{\rm early}\,{\rm lactation}\,\left( {{\rm UFL/day}} \right) \hfill }}\cr$$
It was assumed that the cow regained the total BFR mobilised in early lactation between 84 DIM and the next calving (365 days after previous calving). The linear rate of BFR deposition from 84 DIM to the next calving was calculated using equation (4):
 $$\eqalignno{ & {\rm Rate} \ {\rm of} \ {\rm increase} \ {\rm in} \ {\rm BFR} \ {\rm deposition} \ \left( {{\rm UFL/day}} \right) \cr & \quad ={\rm Total}\,{\rm BFR}\,{\rm mobilised}\,{\rm in}\,{\rm early}\,{\rm lactation}\,\left( {{\rm UFL}} \right) \cr \qquad{\times}{2 \over {280{\times}281\,{\rm days}}} $$
The daily energy partitioned towards the BFR deposition from 84 DIM to next calving (365 days after previous calving) was calculated using equation (5):
 $$\eqalignno{ & {\rm Daily} \ {\rm BFR} \ {\rm deposition}\,\left( {{\rm UFL/day}} \right) \cr\quad={\rm Rate} \ {\rm of} \ {\rm increase} \ {\rm in} \ {\rm BFR} \ {\rm deposition} \ \left( {{\rm UFL/day}} \right) \cr & \qquad{\times}[(7\,{\rm days}\,{\times}\,{\rm lactation} \ {\rm week}) \cr\qquad{\minus}({\rm 365} \ {\rm days} \ {\rm after} \ {\rm previous} \ {\rm calving} \ {\minus}{\rm 280}\,{\rm DIM})] $$
Optimisation of the potential lactation curve (for MY)
Previous evaluations of GrazeIn (O’Neill et al., Reference O’Neill, Lewis, O’Donovan, Shalloo, Mulligan, Boland and Delagarde2013a and Reference O’Neill, Lewis, O’Donovan, Shalloo, Mulligan, Boland and Delagarde2013b) highlighted problems with the prediction of MY in late lactation. MY is predicted by the model using the PMY and the MY response to nutrient intake. To reduce the overprediction of late lactation MY, the potential lactation curve used to estimate MY by GrazeIn was reparameterised. This process was carried out by optimising, for MY, the coefficients for the rate of decrease in the theoretical hormone related to secretory cell differentiation (kh) and for the basal rate of secretory cell death (ks). The objective function was set to minimise the overall mean prediction error (MPE) for MY by adjusting the coefficients kh and ks.
 $${\rm MPE}=\sqrt {{{\mathop{\sum}\limits_{{\rm cow}} {(({\rm actual} \ {\rm milk} \ {\rm yield}_{{{\rm cow}}} {\minus}{\rm predicted} \ {\rm milk} \ {\rm yield}_{{{\rm cow}}} )^{2} )} } \over {{\rm Number} \ {\rm of} \ {\rm cows}}}} $$
A limit was placed on the range within which the coefficients could be optimised. All combinations within this range were tested using the 3960 individual cow measurements in the data set. The optimal combination of coefficients were the coefficients that achieved the lowest overall MPE for the prediction of MY.
If in the optimal combination, one or more of the coefficients reached the upper or lower limit value, then the limits were widened to increase the range and the optimisation was rerun. The coefficients in the original model for the rate of decrease in the theoretical hormone related to secretory cell differentiation were 0.08/day for primiparous and 0.13/day for multiparous cows, and the coefficients for the basal rate of secretory cell death were 0.0015/day for primiparous and 0.0025/day for multiparous cows. There was no change in the optimised coefficient for kh for primiparous or multiparous cows (0.08/day and 0.13/day, respectively). The optimised coefficients ks were 0.0023/day for primiparous and 0.0035/day for multiparous cows.
Optimisation of the IC correction coefficient (for GDMI)
The final step in the adaptation process was optimising the IC for GDMI. This was undertaken to ensure that the previous steps, carried out to improve MY, had not decreased the prediction accuracy of GDMI. The objective function was set to minimise the overall MPE for GDMI by optimising the IC correction coefficient. A limit was placed on the range within which the coefficient could be optimised. The different coefficients within this range were tested using the 3960 individual cow measurements in the data set. The optimal coefficient was the coefficient that achieved the lowest overall MPE for the prediction of GDMI.
 $${\rm MPE}=\sqrt {{{\mathop{\sum}\limits_{{\rm cow}} {{\rm ((actual} \ {\rm GDMI}_{{{\rm cow}}} {\minus}{\rm predicted} \ {\rm GDMI}_{{{\rm cow}}} {\rm )}^{2} {\rm )}} } \over {{\rm Number}\,{\rm of}\,{\rm cows}}}} $$
If the optimal coefficient reached the upper or lower limit value, then the limits were widened to increase the range and the optimisation was run again.
Following each step of the adaptation process, the prediction accuracy of the adapted model (including all previous adaptation steps) was evaluated using the total data set of 3960 individual cow measurements and using sub-data sets for early, mid and late lactation.
Statistical analysis
Predicted GDMI and MY were simulated by GrazeIn and the adapted models using data from the data set of 3960 individual cow measurements and input variables. The actual values from the data set and the predicted values from the model for GDMI and MY were compared using linear regression of the actual on the predicted values. The accuracies of the original model and the adapted models were determined using the origin, slope and r 2 of the relationships between the actual and the predicted values (Hayirli et al., Reference Hayirli, Grummer, Nordheim and Crump2003). The statistical analysis carried out in this paper is similar to the analysis carried out by O’Neill et al. (Reference O’Neill, Lewis, O’Donovan, Shalloo, Mulligan, Boland and Delagarde2013a and Reference O’Neill, Lewis, O’Donovan, Shalloo, Mulligan, Boland and Delagarde2013b) and uses the common deviance measures proposed by Rook et al. (Reference Rook, Dhanoa and Gill1990), namely, mean square prediction error (MSPE), MPE and RPE (Hayirli et al., Reference Hayirli, Grummer, Nordheim and Crump2003).
 $${\rm MSPE}=\left( {A_{{\rm m}} {\minus}P_{{\rm m}} } \right)^{2} {\plus}S_{{\rm p}}^{2} \left( {{\rm 1}{\minus}b} \right)^{2} {\plus}S_{{\rm A}}^{2} \left( {{\rm 1}{\minus}r^{2} } \right)$$
where A m and P m are the means of the actual and predicted GDMI/MY, respectively, S A 2 and S p 2 are the variances of the actual and predicted GDMI/MY, respectively, b is the slope of the regression of actual on predicted, and r is the correlation coefficient of actual and predicted. The MSPE is the sum of the mean bias, line bias and random variation (Bibby and Toutenburg, Reference Bibby and Toutenburg1977).
The MPE is the square root of the MSPE (Rook et al., Reference Rook, Dhanoa and Gill1990).
 $${\rm MPE}=\sqrt {{\rm MSPE}} $$
The RPE is the expression of the MPE as a percentage of the actual measured GDMI/MY.
 $${\rm RPE}=\left( {{{\sqrt {{\rm MSPE}} } \over {A_{{\rm m}} }}} \right){\times}100$$
where A m is the mean of the actual measured GDMI/MY.
Ideally, models are considered robust for practical use if they have a satisfactory level of accuracy for most data sets (RPE⩽10%) rather than high accuracy for some data sets and poor accuracy for others (Fuentes-Pila et al., Reference Fuentes-Pila, Delorenzo, Beede, Staples and Holter1996; Keady et al., Reference Keady, Mayne and Kilpatrick2004). An RPE of ⩽10% is achievable for models predicting DMI of dairy cows in confined systems of milk production (Zom et al., Reference Zom, André and van Vuuren2012) but is very difficult to achieve for models predicting GDMI of grazing dairy cows (Delagarde and O’ Donovan, Reference Delagarde and O’ Donovan2005).
The concordance correlation coefficient (CCC; Lin (Reference Lin1989)) was used to evaluate the extent of agreement between the actual and predicted values. The CCC is calculated as CCC=ρ×C b, with ρ being the Pearson correlation coefficient and C b the bias correction factor. The Pearson correlation coefficient reflects precision, that is, the degree to which the predicted against actual values cluster about the regression line. The bias correction factor reflects accuracy, that is, the degree to which the regression line adheres to the 45° line through the origin. The scale of Landis and Koch (Reference Landis and Koch1977) has been used here to describe the degree of concordance, with 0.21 to 0.40 being ‘fair’; 0.41 to 0.60 being ‘moderate’; 0.61 to 0.80 being ‘substantial’; and 0.81 to 1.00 being ‘almost perfect’.
Results
Original GrazeIn model
Total data set
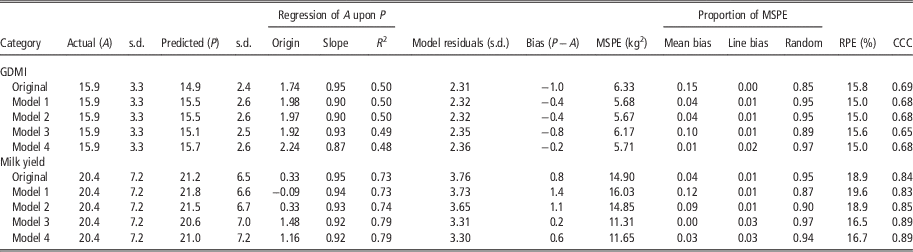
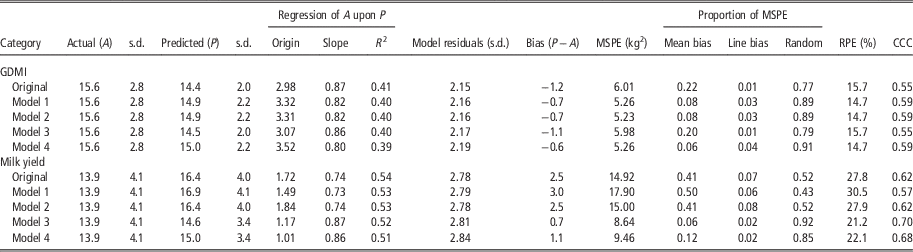
The model predicted GDMI with an RPE of 15.8% (Table 4). The majority of the MSPE was attributed to random variation (0.85). The model had a CCC for GDMI of 0.69 with a Pearson correlation coefficient of 0.70 and a bias correction factor of 0.98.
Prediction accuracy of the GrazeIn model for grass dry matter intake (GDMI) (kg DM/cow per day) and milk yield (kg/cow per day) prediction of grazing dairy cows for the total data set (n=3960) investigating the original model and the model adapted to include (1) intake capacity correction coefficient, (2) body fat reserve deposition, (3) optimised potential lactation curve and (4) intake capacity correction coefficient optimisation

MSPE=mean square prediction error; RPE=relative prediction error; CCC=concordance correlation coefficient.
GrazeIn predicted MY with an RPE of 18.9% (Table 4). The majority of the MSPE was attributed to random variation (0.95). The model had a CCC for MY of 0.84 with a Pearson correlation coefficient of 0.86 and a bias correction factor of 0.97.
By stage of lactation
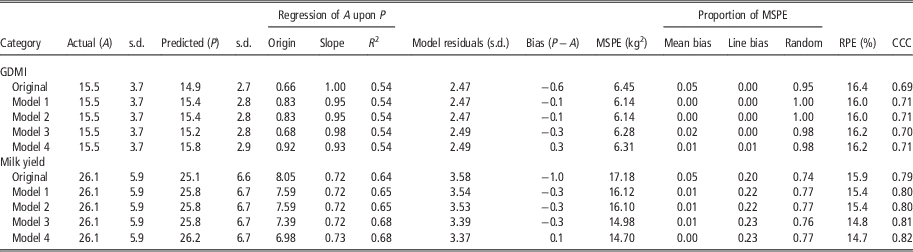
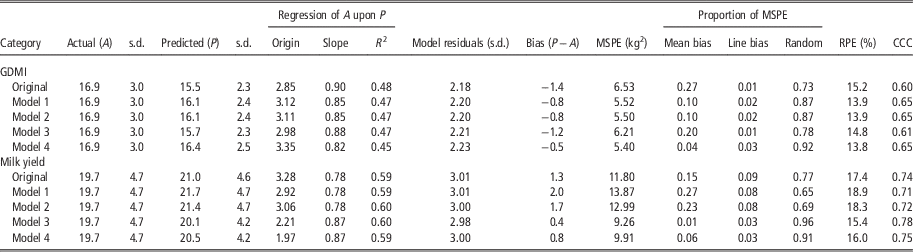
Investigating GDMI by stage of lactation, the RPE ranged from 15.2% to 16.4% (Tables 5, 6 and 7). The bias between predicted and actual values was consistently negative indicating the model on average underpredicted GDMI during all stages of lactation. The mean average bias ranged from −1.4 kg to −0.6 kg DM/cow per day. In early lactation, the majority of the MSPE was attributed to random variation (0.95). This majority reduced to 0.73 for mid lactation and 0.77 for late lactation.
Prediction accuracy of the GrazeIn model for grass dry matter intake (GDMI) (kg DM/cow per day) and milk yield (kg/cow per day) prediction of grazing dairy cows for early lactation (0 to 16 weeks) (n=1557) investigating the original model and the model adapted to include (1) intake capacity correction coefficient, (2) body fat reserve deposition, (3) optimised potential lactation curve and (4) intake capacity correction coefficient optimisation

MSPE=mean square prediction error; RPE=relative prediction error; CCC=concordance correlation coefficient.
Prediction accuracy of the GrazeIn model for grass dry matter intake (GDMI) (kg DM/cow per day) and milk yield (kg/cow per day) prediction of grazing dairy cows for mid lactation (17 to 25 weeks) (n=1153) investigating the original model and the model adapted to include (1) intake capacity correction coefficient, (2) body fat reserves deposition, (3) optimised potential lactation curve and (4) intake capacity correction coefficient optimisation

MSPE=mean square prediction error; RPE=relative prediction error; CCC=concordance correlation coefficient.
Prediction accuracy of the GrazeIn model for grass dry matter intake (GDMI) (kg DM/cow per day) and milk yield (kg/cow per day) prediction of grazing dairy cows for late lactation (>25 weeks) (n=1250) investigating the original model and the model adapted to include (1) intake capacity correction coefficient, (2) body fat reserve deposition, (3) optimised potential lactation curve and (4) intake capacity correction coefficient optimisation

MSPE=mean square prediction error; RPE=relative prediction error; CCC=concordance correlation coefficient.
GrazeIn predicted MY in early lactation with an RPE of 15.9% (Table 5) but predicted MY of cows in mid and late lactation with an RPE of 17.4% and 27.8%, respectively (Tables 6 and 7). The mean average bias was −1.0 kg in early lactation and was +1.3 kg and +2.5 kg in mid and late lactation. This indicated that the model on average underpredicted MY in early lactation and overpredicted MY in mid and late lactation. The bias increased as stage of lactation increased. The proportion of the MSPE attributed to the mean bias, line bias and random variation was 0.41, 0.07 and 0.52 for late lactation.
Inclusion of IC correction coefficient in the model
Total data set
Grass DMI was predicted with an RPE of 15.0%. The majority of the MSPE was attributed to random variation (0.95) (Table 4).
GrazeIn predicted a mean daily MY of 21.8 kg/cow per day with an RPE of 19.6% (Table 4). The majority of the MSPE was attributed to random variation (0.87).
By stage of lactation
Investigating GDMI by stage of lactation the RPE ranged from 13.9% to 16.0% (Tables 5, 6 and 7). The majority of the MSPE was attributed to random variation (1.00, 0.87 and 0.89 in early, mid and late lactation, respectively).
GrazeIn predicted MY in early lactation with an RPE of 15.4% (Table 5) but predicted MY of cows in mid and late lactation with an RPE of 18.9% and 30.5%, respectively (Tables 6 and 7). The proportion of the MSPE for MY attributed to the mean bias was 0.01 for early lactation, 0.27 for mid lactation and 0.50 for late lactation.
Inclusion of IC correction coefficient and BFR deposition in the model
Total data set
The prediction accuracy results of GrazeIn for GDMI were identical to the previous step (Table 4).
GrazeIn predicted a mean daily MY of 21.5 kg/cow per day (Table 4). MY was predicted with an RPE of 18.9%. The majority of the MSPE was attributed to random variation (0.90).
By stage of lactation
The prediction accuracy results of GrazeIn for GDMI were identical to the previous step (Tables 5, 6 and 7).
GrazeIn predicted MY in early lactation with an RPE of 15.4% (Table 5) but predicted MY of cows in mid and late lactation with an RPE of 18.3% and 27.9%, respectively (Tables 6 and 7). The proportion of the MSPE attributed to the mean bias and line bias was 0.01 and 0.22 for early lactation, 0.23 and 0.08 for mid lactation and 0.41 and 0.08 for late lactation.
Inclusion of IC correction coefficient and BFR deposition in the model and optimisation of the potential lactation curve
Total data set
The model predicted GDMI with an RPE of 15.6% (Table 4). The majority of the MSPE was attributed to random variation (0.89).
MY was predicted with an RPE of 16.5% (Table 4). The majority of the MSPE was attributed to random variation (0.97).
By stage of lactation
Investigating GDMI by stage of lactation the RPE ranged from 14.8% to 16.2% (Tables 5, 6 and 7). The majority of the MSPE was attributed to random variation (0.98, 0.78 and 0.79 in early, mid and late lactation, respectively).
GrazeIn predicted MY in early lactation with an RPE of 14.8% (Table 5) but predicted MY of cows in mid and late lactation with an RPE of 15.4% and 21.2%, respectively (Tables 6 and 7). The majority of the MSPE was attributed to random variation (0.76, 0.96 and 0.92 in early, mid and late lactation, respectively).
Inclusion of IC correction coefficient and BFRs deposition in the model and optimisation of the potential lactation curve and the IC correction coefficient
Total data set
The model predicted GDMI with an RPE of 15.0% (Table 4). The majority of the MSPE was attributed to random variation (0.97). The model had a CCC for GDMI of 0.68 with a Pearson correlation coefficient of 0.69 and a bias correction factor of 0.97, which was similar to the original model.
MY was predicted with an RPE of 16.7% (Table 4). The majority of the MSPE was attributed to random variation (0.94). The model had a CCC for MY of 0.89 with a Pearson correlation coefficient of 0.89 and a bias correction factor of 1.00.
By stage of lactation
Investigating GDMI by stage of lactation the RPE ranged from 13.8% to 16.2% (Tables 5, 6 and 7). The majority of the MSPE was attributed to random variation (0.98, 0.92 and 0.91 in early, mid and late lactation, respectively).
GrazeIn predicted MY in early lactation with an RPE of 14.7% (Table 5) but predicted MY of cows in mid and late lactation with an RPE of 16.0% and 22.1%, respectively (Tables 6 and 7). The proportion of the MSPE attributed to random variation was 0.77, 0.91 and 0.85 in early, mid and late lactation, respectively.
Discussion
Various models have been developed for the prediction of GDMI and MY of grazing dairy cows (Baudracco et al., Reference Baudracco, Lopez-Villalobos, Holmes and MacDonald2010; Delagarde et al., Reference Delagarde, Faverdin, Baratte and Peyraud2011a; Faverdin et al., Reference Faverdin, Baratte, Delagarde and Peyraud2011). One of these models, GrazeIn (Delagarde et al., Reference Delagarde, Faverdin, Baratte and Peyraud2011a; Faverdin et al., Reference Faverdin, Baratte, Delagarde and Peyraud2011), was identified by Delagarde and O’ Donovan (Reference Delagarde and O’ Donovan2005) as being suitable for predicting the GDMI and MY of grazing dairy cows. They evaluated GrazeIn using Irish and French databases containing 190 and 114 grazing herds, respectively. They found that GrazeIn predicted GDMI with a lower level of error for Irish (RPE=10%), French (RPE=12%) and combined databases (RPE=11%) than three other published GDMI models (Sepatou: Cros et al. (Reference Cros, Duru, Garcia and Martin-Clouaire2003); Pâtur’IN: Delaby et al. (Reference Delaby, Peyraud and Faverdin2001); Diet-Check: Heard et al. (Reference Heard, Cohen, Doyle, Wales and Stockdale2004)). In addition, with GrazeIn, more of the variation was attributable to random variation than was the case for the other three models. GrazeIn predicted more accurately than the other three models because of its utilising more input factors and estimating more interactions than those of other models (Delagarde and O’ Donovan, Reference Delagarde and O’ Donovan2005).
Numerous evaluations of GrazeIn have been carried out using data from different countries (Delagarde and O’ Donovan, Reference Delagarde and O’ Donovan2005; Delagarde et al., Reference Delagarde, Valk, Mayne, Rook, Gonzalez-Rodriguez, Baratte, Faverdin and Peyraud2011b; O’Neill et al., Reference O’Neill, Lewis, O’Donovan, Shalloo, Mulligan, Boland and Delagarde2013a and Reference O’Neill, Lewis, O’Donovan, Shalloo, Mulligan, Boland and Delagarde2013b). O’Neill et al. (Reference O’Neill, Lewis, O’Donovan, Shalloo, Mulligan, Boland and Delagarde2013a) evaluated GrazeIn at a herd level using an independent database, not only for the database as a whole, but also by season and by grazing management input variable. For the total database (522 grazing herds), GrazeIn predicted GDMI with an RPE of 12.2% and MY with an RPE of 12.8%. Investigation by season and input variable revealed that GrazeIn predicted MY in autumn with a large level of error compared with spring and summer and predicted MY less accurately for herds offered grass with a low FV, high UFL and high PDIE concentration compared with herds offered grass of lower quality (higher FV, lower UFL and lower PDIE concentration).
In the study by O’Neill et al. (Reference O’Neill, Lewis, O’Donovan, Shalloo, Mulligan, Boland and Delagarde2013b), GrazeIn was evaluated at a cow level using 8787 individual cow measurements from Irish studies. GrazeIn predicted GDMI with an RPE of 15.5% and MY with an RPE of 16.7% for the total database. There were large differences in prediction accuracies between stages of lactation. GrazeIn predicted MY in late lactation with a large level of error (RPE=22.9%) compared with early and mid lactation (RPE=13.9% and 15.4%).
The detailed evaluations of GrazeIn by O’Neill et al. (Reference O’Neill, Lewis, O’Donovan, Shalloo, Mulligan, Boland and Delagarde2013a and Reference O’Neill, Lewis, O’Donovan, Shalloo, Mulligan, Boland and Delagarde2013b) highlighted the large error with which MY in autumn/late lactation was predicted compared with spring/early and summer/mid lactation. As a result, it was necessary to adapt GrazeIn.
Inclusion of IC correction coefficient
In the evaluation of the original model in the current paper, GrazeIn predicted GDMI with an RPE of 15.8%. Stage of lactation did not appear to have a significant effect on RPE for GDMI prediction. The RPE values are within the range reported by Keady et al. (Reference Keady, Mayne and Kilpatrick2004) and Fuentes-Pila et al. (Reference Fuentes-Pila, Delorenzo, Beede, Staples and Holter1996) as acceptable (RPE 10% to 20%). As a result, the prediction of GDMI by the original model was within acceptable limits, but given the importance of GDMI it was deemed important to try to improve it further. The absence of a line bias for the total data set, and for the different stages of lactation, indicated that the general structure of GrazeIn for the prediction of GDMI was acceptable with the majority of the MSPE attributed to random variation (Rook et al., Reference Rook, Dhanoa and Gill1990). At grazing, the maintenance energy requirements of the cow are 20% higher than the maintenance energy requirements of a stall-fed cow indoors (Coulon et al., Reference Coulon, Hoden, Faverdin and Journet1989). The original model takes account of this, but does not include a similar correction coefficient for the IC of the grazing cow. Kaufmann et al. (Reference Kaufmann, Münger, Rérat, Junghans, Görs, Metges and Dohme-Meier2011) demonstrated that the higher energy requirements of grazing cows in comparison with stall-fed cows might be because of the increased level of physical activity required to graze. Grazing cows spent more time walking and eating than their counterparts indoors. The increased maintenance energy requirements of the grazing cow are not accounted for in the calculation of IC in GrazeIn but are accounted for in a similar model for predicting DMI in Nordic countries (Volden et al., Reference Volden, Nielsen, Åkerlind, Larsen, Havrevoll and Rygh2011). Increasing the IC of the grazing cow by 5% in the model reduced the RPE for GDMI and the bias between predicted and actual GDMI for the total data set and for GDMI prediction in the different stages of lactation. As the GDMI and MY sub-models are linked, the increased IC resulted in an increase in energy intake with the extra energy partitioned into MY. In early lactation, this resulted in an improved MY prediction owing to the underprediction of MY at this time. In mid and late lactation, however, there was an increase in the RPE of MY because of an increase in the overprediction of MY.
Inclusion of IC correction coefficient and BFR deposition
Following the inclusion of the IC correction coefficient, the deposition of BFR was included in the model. Cows generally mobilise BFR in early lactation and regain these reserves during the subsequent pregnancy (Friggens et al., Reference Friggens, Ingvartsen and Emmans2004). The mobilisation of BFR in early lactation and the deposition of BFR during pregnancy are natural components of the reproductive cycle of the cow (Friggens et al., Reference Friggens, Ingvartsen and Emmans2004). This increase in BFR in late lactation is observed as an increase in BCS in late lactation and late pregnancy (Roche et al., Reference Roche, Berry and Kolver2006). One approach to dealing with BCS change and the mobilisation/deposition of BFR is that of Baudracco et al. (Reference Baudracco, Lopez-Villalobos, Holmes and MacDonald2010) who used a BCS model proposed by Friggens et al. (Reference Friggens, Ingvartsen and Emmans2004) to predict the genetically driven pattern of BCS change throughout lactation. The model of Friggens et al. (Reference Friggens, Ingvartsen and Emmans2004) is based on the concept that at any given time in pregnancy or lactation there is an optimal BCS that the cow is genetically driven to achieve. It assumes that the cow is genetically driven to achieve a target level of BCS at or around conception and at next calving. Cows in early lactation will adjust the partitioning of energy to achieve the target BCS at conception. After conception, the cow will gradually increase BCS to achieve the target BCS at next calving. An alternative approach, used in the present study, was to include BFR deposition from 84 DIM to the next calving. The total BFR deposited during this period was equal to the BFR mobilised from calving to 84 DIM. The calculation attempts to simulate what occurs during lactation, namely, the partitioning of energy in mid and late lactation into BFR deposition (Roche et al., Reference Roche, Berry and Kolver2006) and away from MY. Including BFR deposition in the model therefore reduced the overprediction of MY in mid and late lactation. The reduction in the RPE was larger in late lactation than in mid lactation because of the incremental increase in energy partitioned towards BFR deposition later in lactation (Figure 2) (Roche et al., Reference Roche, Berry and Kolver2006). Including BFR deposition in the model had no effect on predicted GDMI as the energy partitioned towards BFR deposition is not used in the iterative calculation of GDMI. As a result, the prediction accuracy for GDMI remained unchanged.
Inclusion of IC correction coefficient and BFR deposition and optimisation of the potential lactation curve
GrazeIn includes a potential lactation curve model based on the mammary gland model of Neal and Thornley (Reference Neal and Thornley1983) to simulate the PMY of the dairy cow, which is the functional capacity of the mammary gland to produce milk (Faverdin et al., Reference Faverdin, Baratte, Delagarde and Peyraud2011). The PMY lactation curve is simulated based on the variation in an arbitrary number of secretory cells (fixed number initially). The number of secretory cells varies because of secretory cell differentiation and secretory cell death (Neal and Thornley, Reference Neal and Thornley1983; Faverdin et al., Reference Faverdin, Baratte, Delagarde and Peyraud2011).
Secretory cell differentiation in the model is directly related to a theoretical lactation hormone. The rate of exponential decrease in this hormone, and thus a decrease in the secretory cell differentiation rate, differs between primiparous and multiparous cows. This agrees with Paliser et al. (Reference Paliser, Wastney, Bright, MacDonald and Penno2001) who also found that the rate of decrease in the theoretical hormone related to secretory cell differentiation was higher in multiparous compared with primiparous cows. In the original model, the coefficient for the rate of decrease in the theoretical hormone related to secretory cell differentiation was 0.08/day for primiparous and 0.13/day for multiparous cows (Faverdin et al., Reference Faverdin, Baratte, Delagarde and Peyraud2011). The optimised coefficients were identical to those used in the original model. This suggests that the values used in the original model were accurate for MY predictions for grazing dairy cows.
In GrazeIn, secretory cell death is a function of the number of secretory cells and the cow’s stage of pregnancy. The death of secretory cells is proportional to the number of secretory cells (Faverdin et al., Reference Faverdin, Baratte, Delagarde and Peyraud2011). The basal rate of secretory cell death is different for primiparous and multiparous cows. The original model had basal rate of secretory cell death coefficients of 0.0015/day for primiparous cows and 0.0025/day for multiparous cows. The optimised basal rate of secretory cell death coefficients were 0.0023/day for primiparous and 0.0035/day for multiparous cows. The basal rate of secretory cell death coefficient was larger for multiparous than for primiparous cows and this agrees with the frequently made observation of lower lactation curve persistency for multiparous compared with primiparous cows (Stanton et al., Reference Stanton, Jones, Everett and Kachman1992). Optimising the basal rate of secretory cell death coefficients resulted in an increase in the coefficients for both primiparous and multiparous cows compared with those used in the original model. This leads to a decrease in the persistency of the potential lactation curve used by the model. It is difficult to validate the PMY persistency as the PMY curve is theoretical and assumes that MY is not limited by nutrient intake. The persistency of cows in the literature is the persistency of actual MY and is limited by the nutrient supply available to the mammary gland (Faverdin et al., Reference Faverdin, Baratte, Delagarde and Peyraud2011).
Optimising the basal rate of secretory cell death coefficients resulted in an improvement in the prediction accuracy of the model for MY in all stages of lactation compared with the previous step. There was a small reduction in the RPE for MY prediction in early lactation, a larger reduction in mid lactation and the largest reduction in late lactation. As a result, MY prediction improved throughout lactation.
Optimising the basal rate of secretory cell death coefficients for primiparous and multiparous cows resulted in a decrease in the prediction accuracy of GDMI compared with the previous step. This was owing to a decrease in the PMY persistency leading to a decrease in predicted GDMI and an increase in the underprediction of GDMI by GrazeIn.
Inclusion of IC correction coefficient and BFR deposition and optimisation of the potential lactation curve and IC correction coefficient
The second step of the adaptation process improved the MY prediction in late lactation as energy was diverted towards BFR deposition and MY. The third step optimised the potential lactation curve for MY, which also increased the prediction accuracy of the model for MY, especially in late lactation. This latter step, however, also changed IC through adaptations to the PMY curve. It was then necessary to reoptimise the model for GDMI to deal with the fact that the previous two steps were carried out to improve MY irrespective of GDMI. This was carried out by optimising the correction coefficient for IC, resulting in a new correction coefficient for IC of 1.11. This final optimisation succeeded in improving the prediction accuracy of GDMI compared with the original model and maintained the improvements in the prediction accuracy of MY. The increase in the correction coefficient may be owing to the fact that not all factors that affect IC are accounted for by the original IC equation. The Nordic feed evaluation system contains a similar model to GrazeIn for predicting feed intake of dairy cows using IC and FV (Volden et al., Reference Volden, Nielsen, Åkerlind, Larsen, Havrevoll and Rygh2011). In their calculation of IC, the increased maintenance energy requirements of loose-housed and grazing cows compared with stall-fed cows are accounted for. Season may affect IC as grazing lactating dairy cows consumed 10% less grass in autumn than in spring, even though cows were at the same stage of lactation and grazing grass of the same digestibility (Corbett et al., Reference Corbett, Langlands and Reid1963). The lower intake in autumn may be attributed to the greater proportion of dead material in the sward (Le Du et al., Reference Le Du, Baker and Newberry1981), increased area rejected because of excreta contamination (Greenhalgh and Reid, Reference Greenhalgh and Reid1969) and shorter day length affecting grazing intensity (Linnane et al., Reference Linnane, Brereton and Giller2001). Including extra factors such as these to calculate IC could reduce or remove the IC correction coefficient. In addition or alternatively, the coefficients for the existing input variables in the calculation of IC could be reparameterised to increase their effect on IC giving rise to a greater IC, thus reducing or removing the requirement for an IC correction coefficient.
Conclusion
The adaptation of GrazeIn improved the GDMI and MY prediction accuracy by using the original input variables, adding new equations to the model and optimising some coefficients in the model. The adaptations not only improved the prediction accuracy of GDMI and MY prediction across the total data set but also in each stage of lactation, particularly MY in late lactation. Future work on GrazeIn should aim to test whether using new input variables not previously included would increase the prediction accuracy of GDMI and MY. Further testing of the adapted model, using an independent data set, would be beneficial.
Acknowledgements
This work was funded by the Irish Department of Agriculture, Food and the Marine Research Stimulus Fund (RSF 07 526) and The Irish Dairy Levy Trust. The first author was in receipt of a Teagasc Walsh Fellowship. The authors would like to acknowledge the assistance of the researchers and students whose data were used to compile the data set used in the adaptation and to Philippe Faverdin (INRA) for his help with the adaptation process.