Introduction
In teleost fish, otoliths are calcium carbonate structures, mainly formed by aragonite, which are located in the inner ear and comprise three pairs called sagittae, asteriscus and lapillus. These structures, which belong to the sensory and balance system (Schulz-Mirbach et al., Reference Schulz-Mirbach, Ladich, Plath and Heb2019), are inert, i.e. after deposition there is no resorption of otoliths. Due to this characteristic, otoliths are excellent tools for ichthyological studies as they preserve information of fish's life history (Popper et al., Reference Popper and Fay2011). Otolith morphology can be influenced by environmental factors and by gene flow processes occurring during fish migrations (Vignon & Morat, Reference Vignon and Morat2010; Cerna et al., Reference Cerna, Saavedra-Nievas, Plaza-Pasten, Niklitschek and Morales-Nin2019). Through trace elements deposited in otoliths, it is possible to identify patterns of habitat use of fish species. Recent studies have applied this latter technique to exotic (non-native) fish species for their management and prevention of dispersal in recently colonized environments (Morissette & Whitledge, Reference Morissette and Whitledge2022).
Exotic species occur in an area far from their natural limits of distribution (Blackburn et al., Reference Blackburn, Bellard and Ricciard2019; Vitule et al., Reference Vitule, Occhi, Kang, Matsuzaki, Bezerra, Daga and Padial2019). Colonization of new environments depends on the ability these species have to adapt to new environmental forces, production of fertile offspring and dispersal of recruits in the new environment (Richardson et al., Reference Richardson, Pysek, Rejmánek, Barbour, Panetta and West2000; Wonham et al., Reference Wonham, Carlton, Smith and College2000; Olenin et al., Reference Olenin, Gollasch, Lehtiniemi, Sapota, Zaiko and Snoeijs-Leijonmalm2017). Species introductions occur by accident, but various human activities are pathways, or vectors, for many introductions (Castro et al., Reference Castro, Fileman and Hall-Spencer2016; Ojaveer et al., Reference Ojaveer, Galil, Carlton, Alleway, Goulletquer, Lehtiniemi and Zaiko2018). Translocation of oil platforms is one of these activities, when companies displace their platforms from one place to another without removing the biofouling, and their translocation can disperse various species, which have reduced migratory capacity. Another route of introduction is ballast water, which disperses species along maritime routes of commercial ships, causing habitat homogenization and environmental imbalance (Boltovskoy & Correa, Reference Boltovskoy and Correa2015; Dimitriou et al., Reference Dimitriou, Chartosia, Hall-Spencer, Kleitou, Jimenez, Antoniou, Hadjioannou, Kletou and Sfenthourakis2019; Watkins et al., Reference Watkins, Yan, Dunic and Côté2021). Aquaculture also favours species introduction by accidental escapes (Encarnação et al., Reference Encarnação, Teodósio and Morais2021). The number of registered exotic species has increased in the marine environment (Tempesti et al., Reference Tempesti, Mangano, Langeneck, Lardicci, Maltagliati and Castelli2020; Encarnação et al., Reference Encarnação, Teodósio and Morais2021). The same pattern of increase in introduced species has also been documented in the South-western Atlantic, and along the Brazilian coast (Schmidt et al., 2020). Together, these species, such as Omobranchus punctatus and Opsanus beta, have expanded their geographic distribution in recently colonized areas (Caires et al., Reference Caires, Pichler, Spach and Ignácio2007; Lasso-Alcalá et al., Reference Lasso-Alcalá, Nunes, Lasso, Posada, Robertson, Piorski, Tassell, Giarrizzo and Gondolo2011; Tomás et al., Reference Tomás, Tutui, Fagundes and Souza2012; Contente et al., Reference Contente, Brenha-Nunes, Siliprandi, Lamas and Conversani2015; Carvalho et al., Reference Carvalho, Ferreira Junior, Fávaro, Artoni and Vitule2020).
Opsanus beta (Goode & Bean, 1880) (family Batrachoididae) is a native and endemic fish of the Gulf of Mexico (Collette, Reference Collette and Carpenter2002), common in estuaries and intertidal regions of the shallow inner shelf (Greenfield et al., Reference Greenfield, Winterbottom and Collette2008). It is cryptic, territorial, sedentary and performs short migrations (Collette, Reference Collette and Carpenter2002; Greenfield et al., Reference Greenfield, Winterbottom and Collette2008). It is an opportunistic and generalist species feeding on molluscs, crustaceans, fish (Franco-Lopez et al., Reference Franco-López, González, Arenas, Sánchez, Escorcia, Pérez, Rodríguez and Legorreta2017), and presents a short life cycle reaching up to 6 years of age in its natural distribution area (Malca et al., Reference Malca, Barimo, Serafy and Walsh2009). It has parental care, with females laying adherent eggs in the substrate. The males fertilize the eggs, and after hatching, they protect the juveniles in their mouths (Gallardo-Torres et al., Reference Gallardo-Torres, Martinez-Perez and Lezina2004).
Opsanus beta was first recorded on the Brazilian coast in the Paranaguá Estuarine Complex (PEC) (Caires et al., Reference Caires, Pichler, Spach and Ignácio2007) and Santos Bay (STB) (Tómas et al., Reference Tomás, Tutui, Fagundes and Souza2012). Recent studies have recorded O. beta in Guanabara, Sepetiba, Guaratuba and Laguna bays (Carvalho et al., Reference Carvalho, Ferreira Junior, Fávaro, Artoni and Vitule2020, Reference Carvalho, Freitas, Lapuch, Volpedo and Vitule2022; Cordeiro et al., Reference Cordeiro, Bertoncini, Abrunhosa, Corona, Araújo and Santos2020; Almeida-Tubino et al., Reference Almeida-Tubino, Salgado, Uehara, Utsunomia and Araújo2021, respectively). Ballast water and/or an association with an oil platform are the most plausible vectors, which have introduced Opsanus beta in the Brazilian coast. This study aimed to compare the shape contours in otoliths of O. beta from the Brazilian coast and from the southern Gulf of Mexico as a basis for future studies on their stock and management in recently colonized regions.
Materials and methods
Study area
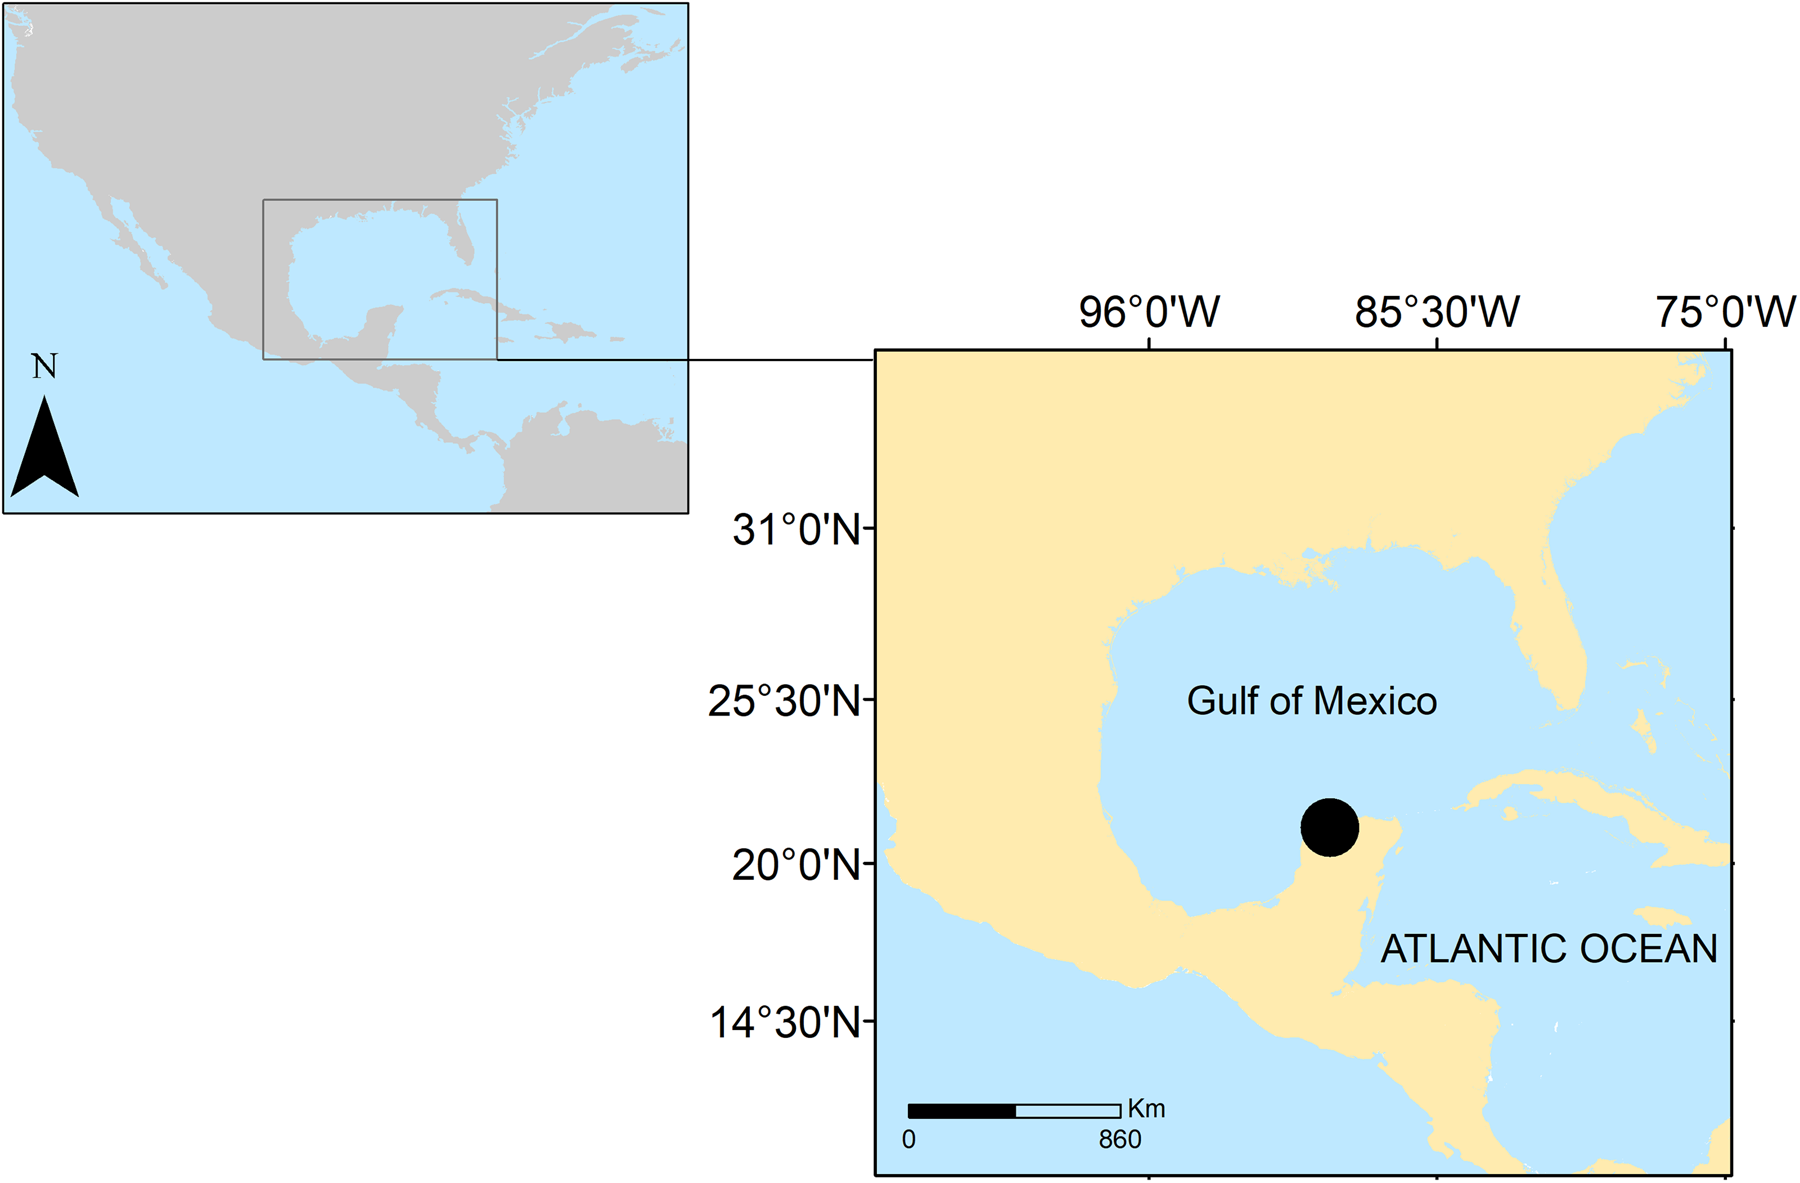
Fishers speared O. beta specimens in areas adjacent to the Celestún Lagoon (CEL), on the northern coast of the Yucatan Peninsula, Mexico (Figure 1), and in two estuaries on the south-eastern-south Brazilian coast (Figure 2). CEL is a tropical estuary ~22 km long and 2 km wide, with an average depth of 1.5 m and connected to the Gulf of Mexico by a narrow channel ~460 m wide (Figure 1). The salinity inside the lagoon varies between 3.1 and 37.4 with the diurnal tide (Gutiérrez-Mendieta & Lanza Espino, Reference Gutiérrez-Mendieta and Lanza Espino2019).
Sampling site of Opsanus beta in Laguna de Celéstun, northern coast of the Yucatan Peninsula, Mexico, in the Gulf of Mexico (black circle).

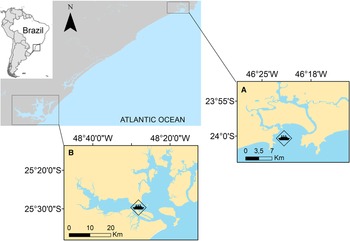
Sampling sites of Opsanus beta in Brazil. (A) Santos Bay (23°59′06″S 46°18′42″W) and (B) Paranaguá Estuarine Complex (25°26′43″S 48°39′58″W). The ship represents port activity in the region.

On the Brazilian coast, specimens were collected in Santos Bay (STB – 23°59′06″S 46°18′42″W, Figure 2A), located about 80 km from São Paulo, with a representative portion of the coast dominated by mangroves. Humid weather and water temperature range between 20–30 °C, and salinity ranges from 20–35 (Porcaro et al., Reference Porcaro, Zani-Teixeira, Katsuragawa, Namiki, Ohkawara and Favero2014). The Paranaguá Estuarine Complex (PEC – 25°26′43″S 48°39′58″W, Figure 2B), with an area of ~551.8 km2, is a subtropical environment composed of mangroves, marshes and shallows, salinity and temperature vary seasonally from 0–32 and from 18–30 °C, respectively (Lana et al., Reference Lana, Marone, Lopes, Machado, Seeliger and Kjerfve2001; Mizerkowski et al., Reference Mizerkowski, Hesse, Ladwig, Machado, Rosa, Araújo and Koch2012). In PEC, the specimens were captured with traps and in STB with hook and line fishing.
Sample processing
After sampling, fish specimens were taxonomically identified, measured in total length (TL, in centimetres, from the snout to the margin of the tail) with a scaled table and weighed in total weight (TW, in grams) with an electronic scale. The sagittae otoliths were extracted from each fish, cleaned, packed dry, and numbered according to geographic location.
Otolith contour analysis
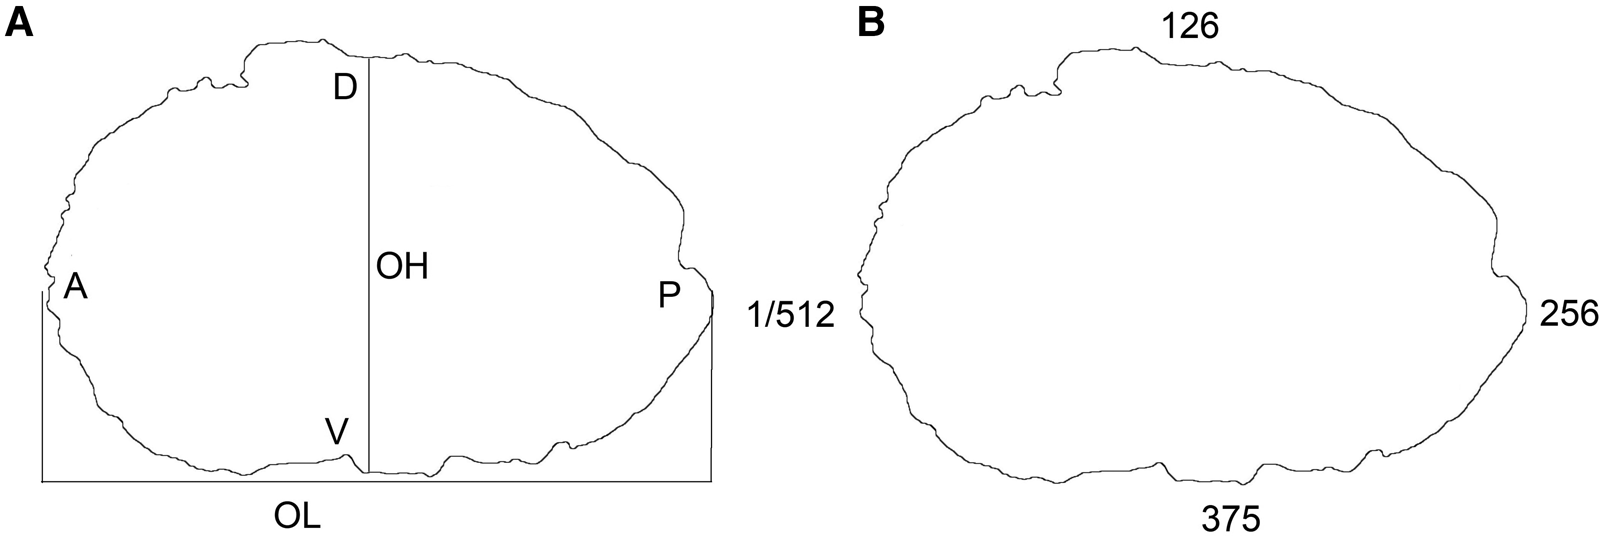
Each otolith was photographed, and from the images obtained otoliths were measured in length (OL, in mm) and height (OH, in mm). The wavelet function was used to define the otolith contour (Parisi-Baradad et al., Reference Parisi-Baradad, Manjabacas, Lombarte, Olivella, Chic, Piera and García-Ladona2010; Sadighzadeh et al., Reference Sadighzadeh, Valinassa, Vosugi, Motallebi, Fatemi, Lombarte and Tuset2014) (Figure 3B). The ‘wavelets’ are the result of the expansion of a signal in a family of functions representing the expansions and translations of a mother function, this being: Ψs(x) = 1/sΨ(φ/s), where Ψ function with local support in a limited amplitude on the abscissa axis; φ lower step filter; s scale parameter (Mallat, Reference Mallat1991). The wavelet analysis allows for measurement of similar points on the otolith (Lombarte & Tuset, Reference Lombarte, Tuset, Volpedo and Vaz-dos-Santos2015). A total of 512 points, with equidistant coordinates from each otolith, were extracted with the rostrum as the contour origin (Parisi-Baradad et al., Reference Parisi-Baradad, Manjabacas, Lombarte, Olivella, Chic, Piera and García-Ladona2010). The fourth and fifth wavelet are more appropriate for identifying stocks or populations (Sadighzadeh et al., Reference Sadighzadeh, Valinassa, Vosugi, Motallebi, Fatemi, Lombarte and Tuset2014; Abaad et al., Reference Abaad, Tuset, Montero, Lombarte, Otero-Ferrer and Haroun2015). Image processing was performed using AFORO (http://isis.cmima.csic.es/aforo/).
(A) Otolith sagitta of Opsanus beta. A, anterior; D, dorsal; P, posterior; V, ventral region of the otoliths; OL, otolith length; OH, otolith height. (B) Otolith contour using 512 equidistant points.

Principal component analysis (PCA), based on the variance-covariance matrix, was applied to reduce wavelet functions without losing information (Tuset et al., Reference Tuset, Imondi, Aguado, Otero-Ferrer, Santschi, Lombarte and Love2015, Reference Tuset, Otero-Ferrer, Omez-Zurita, Venerus, Stransky, Imondi, Orlov, Ye, Santschi, Afanasie, Zhuang, Farré, Love and Lombarte2016). Principal components (PCs) that explain data variability were selected by the Broken–Stick method (Gauldie & Crampton, Reference Gauldie and Crampton2002). Subsequently, the effect of fish size allometry was removed using the residual of the linear regression between the significant principal components and the otolith length. From these, a new PCA was run (Stransky & MacLellan, Reference Stransky and Maclellan2005) to check for variations in the otolith contour for each site: Celestún, STB and PEC. A Linear Discriminant Analysis (LDA) was applied between sites to verify the correct percentage of otolith reclassification. A multivariate analysis of variance (MANOVA) was performed, with the length and height of otoliths and the PC without the effect of allometry, to check for differences in the shape of otoliths collected in CEL, STB and PEC. All statistical analyses were performed using the Past program.
Results
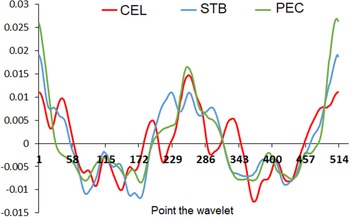
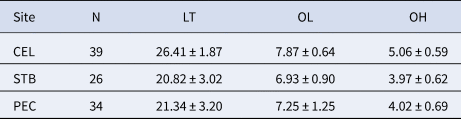
Ninety-nine otoliths of O. beta from CEL, STB and PEC were analysed (Table 1). The reconstruction of the otolith contour using wavelets 4 and 5 showed high variability in the contour of the three analysed sites. This variability was observed in the dorsal, ventral and posterior regions (Figure 4).
Contour decomposition of the otolith sagitta of Opsanus beta collected in Celestun – Mexico, Santos Bay (STB) and Paranaguá Estuarine Complex (PEC) – Brazil.

Mean and standard deviation of fish total length (TL, cm), otolith length (OL, mm) and otolith height (OH, mm) of Opsanus beta by site and ‘N’ number of specimens

CEL, Celestun; STB, Santos Bay; PEC, Paranaguá Estuarine Complex.
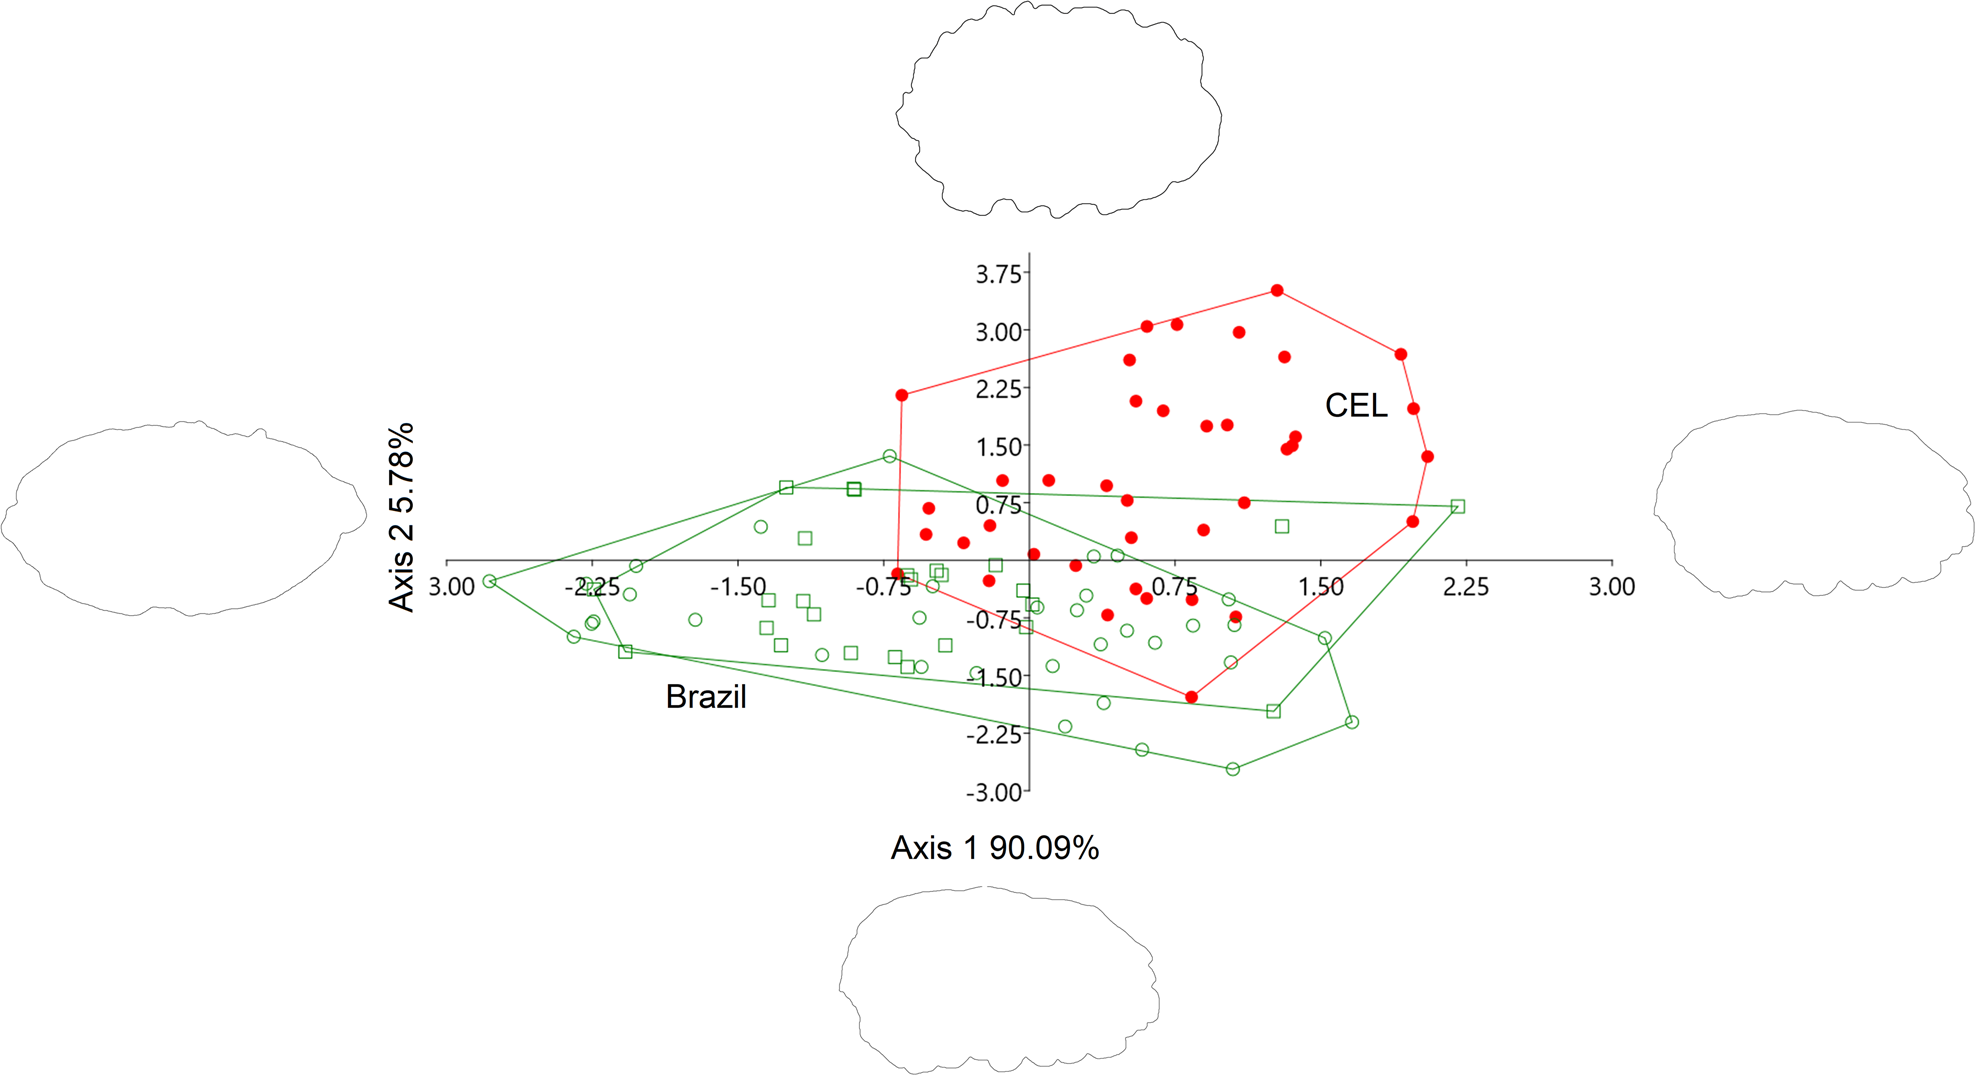
PCA showed high variability in the otolith shape (Figure 5), with PC1 explaining 90.09% and PC2 explaining 5.78% in otolith shape variability. Along PC1 are distributed more elongated otoliths, with irregular margins, and straight posterior region, and on PC2 are distributed more rounded otoliths, with crenulated and irregular margins and sharp posterior region. Otoliths of O. beta from Brazil were more distributed along PC1, while those from the Mexican coast along PC2 (Figure 5).
Principal component analysis (PCA) scatterplot for the otolith contour of Opsanus beta from Mexico (CEL – red circle) and Brazil (STB – open square; PEC – open circle). The contours of the most frequent otoliths in each axis of the PCA.

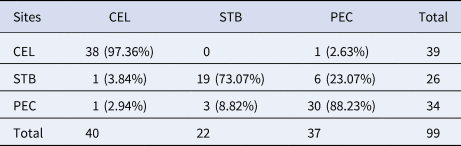
The LDA showed 87.88% correct reclassification of otoliths among sites. CEL showed the highest reclassification percentage (97.36%), followed by PEC (88.23%) and SBT (73.07%) reclassification (Table 2). MANOVA evidenced a significant difference in otolith shape between sites (F = 5.37; P < 0.005). Otolith shape of CEL was significantly different from those from STB and PEC (P < 0.005). However, the otolith shape of STB and PEC did not differ significantly among them (P > 0.005).
Reclassification of the otolith sagitta of Opsanus beta between Celéstun Lagoon (CEL, Mexico), Santos Bay (SBT, Brazil) and Paranaguá Estuarine Complex (PEC, Brazil) by the linear discriminant analysis (LDA)

Discussion
Our results showed that shape otolith contours of O. beta differed between the populations from Mexico and Brazil. Populations exposed to different environmental parameters have a differentiated otolith shape, as observed for O. beta and other estuarine and marine species (Capoccioni et al., Reference Capoccioni, Costa, Aguzzi, Menesatti, Lombarte and Ciccotti2011; Hoff et al., Reference Hoff, Dias, Zani-Teixeira and Correia2020; Maciel et al., Reference Maciel, Vianna, Carvalho, Miller and Avigliano2021). The population of O. beta on the Mexican coast lives in a tropical, eutrophic environment, with diurnal tidal variations, and with three well-defined seasons (dry, rainy and windy). Meanwhile, the Brazilian populations of O. beta are located within subtropical estuaries, with very similar rainfall, photoperiods and dominated by semidiurnal tides, which differ greatly from the environmental forces in the Mexican estuary (Spalding et al., Reference Spalding, Fox, Allen, Davidson, Ferdaña, Finlayson, Halpern, Jorge, Lombana, Lourie, Martin, Mcmanus, Molnar, Recchia and Robertson2007; Gutiérrez-Mendieta & Lanza Espino, Reference Gutiérrez-Mendieta and Lanza Espino2019).
Along with the environmental influence, the ecological fish connectivity of populations influences the otolith shape, in which connected populations have similar otolith shape (Ibañez et al., Reference Ibañez, Hernández-Fraga and Alvarez-Hernández2017; Soeth et al., Reference Soeth, Spach, Daros, Adelir-Alves, Almeida and Correia2019). This latter suggests that populations of O. beta on the Mexican coast and those established on the Brazilian coast are not connected. In this context of ecological connectivity, a plausible reason of O. beta introduction in Brazil is the soybean industry. The soybean is the third most exported product through marine vessels from Brazil to Mexico and the USA, the native region of O. beta. This transport consequently would facilitate the constant pressure of propagules coming through the ballast water on the soybean cargo ships at the Brazilian ports. If there was an introduction of O. beta on the Brazilian coast from Mexico, these specimens could not establish properly due to potential competition with the already established O. beta population, showing no connectivity between the Brazilian and Mexican populations. However, based on our results, it is not possible to know if the population of O. beta actually comes from Mexico's population.
The similarity between O. beta otoliths from the PEC and STB suggests two hypotheses. First, the Brazilian O. beta populations probably have a common origin. Second, Brazilian O. beta populations are either well connected or are subjected to very similar environmental conditions. PEC and STB showed very similar salinity, water and air temperature, geological formations, vegetation and photoperiod. These latter parameters exert similar forces on O. beta populations, which could be reflected in the shape of their otoliths (Lessa et al., Reference Lessa, Santos, Filho, Corrêa-Gomes, Lana and Bernardino2018).
Migration between populations could also make the shape of otoliths very similar, as observed in other estuarine and marine fish species (Ibañez et al., Reference Ibañez, Hernández-Fraga and Alvarez-Hernández2017; Soeth et al., Reference Soeth, Spach, Daros, Adelir-Alves, Almeida and Correia2019; Kikuchi et al., Reference Kikuchi, Cardoso, Canel, Timi and Haimovici2021). However, O. beta is a cryptic, territorial species, with a strong parental care and no larval dispersal (Collette, Reference Collette and Carpenter2002; Gallardo-Torres et al., Reference Gallardo-Torres, Martinez-Perez and Lezina2004; Greenfield et al., Reference Greenfield, Winterbottom and Collette2008). These latter life history characteristics raise questions about the occurrence of migrations and natural dispersions of O. beta between PEC and STB. Does the similarity of their otoliths between these sites occur by a natural ecological connectivity? Or are these fish populations connected by human pathways? The ports of Paranaguá and Santos are located in the PEC and in STB, respectively, and both are important for the international and domestic cabotage trade (Cutrim et al., Reference Cutrim, Robles, Galvão and Casaca2017; Beuren et al., 2018). The Brazilian legislation does not determine as mandatory the disposal of maritime cabotage service of ballast water in oceanic areas prior to docking at ports (NORMAM 20/2014). It is possible that the cabotage fleet is introducing O. beta populations in Santos Bay and in the PEC through ballast water, making the otoliths of these two populations similar.
The analysis of the shape of otolith contours is an important tool which helped to determine if populations of O. beta on the Brazilian coast are connected, but it is not possible to determine whether a migration occurs either naturally by larval dispersion and/or through fish adult migration or these fish come associated with cabotage activities. We further recommend studies involving otolith chemistry to describe possible migration pathways between these O. beta populations and to elucidate the influence of the cabotage fleet on its dispersion on the Brazilian coast occurs. Future studies could help understand, and potentially provide information to control, the introduction of O. beta, preventing it from establishing in north-eastern Brazil, a region where no records of O. beta are available yet.
Acknowledgements
BMC is thankful to the National Council for Scientific and Technological Development (CNPq # 153090/2019-7). Virginia Nóh-Quiñones helped processing otolith samples and images in Mexico. ARGT is thankful to Sao Paulo Research Foundation (FAPESP #2018/04099-5). JRSV is thankful to National Council for Scientific and Technological Development (CNPq) for the constant research productivity grants provided to JRSV (PQ #302367/2018-7 and #303776/2015-3). AVV thank to CONICET (PIP 11220200103264CO), Universidad de Buenos Aires (UBACYT UBACYT 2020 Mod I. 20020190100069BA) and Agencia Nacional de Promoción Científica y Técnica (ANPCyT PICT 2019-0388).