I. INTRODUCTION
Carbon is capable of forming various hexagonal networks incorporating partially pentagonal or heptangular structures with sp 2 hybrids. Reference Suarez-Martinez, Grobert, Ewels and Tagmatarchis1 A variety of carbon nanomaterials with unique forms, including fullerenes, Reference Kroto, Heath, O'Brien, Curl and Smalley2 carbon nanotubes (CNTs), Reference Iijima3 graphene Reference Novoselov, Geim, Morozov, Jiang, Katsnelson, Grigorieva, Dubonos and Firsov4 and so on, have been generated owing to this versatility. Even as for CNTs or nanofibers, bamboo-type, Reference Saito and Yoshikawa5 cup-stacked-type, Reference Endo, Kim, Hayashi, Fukai, Oshida, Terrones, Yanagisawa, Higaki and Dresselhaus6 beaded Reference Ting and Lan7 and necklace-type Reference Okuno, Grivei, Fabry, Gruenberger, Gonzalez-Aguilar, Palnichenko, Fulcheri, Probst and Charlier8 tubes, nanobells, Reference Ma, Wang, Tilley, Jefferson and Zhou9 and nanocoils Reference Zhang, Nakayama and Pan10 as well as cylindrical ones have been reported. Applications of these materials have been intensively examined so as to take advantage of their structural features or physical properties. As the properties of carbon nanomaterials could be superior or peculiar depending on their structures, Reference Suarez-Martinez, Grobert, Ewels and Tagmatarchis1 creating novel carbon nanomaterials has been one of the significant subjects in materials research.
One of the effective approaches to produce novel structures is the application of nonequilibrium conditions such as high temperature gradients or rapid cooling in the synthesis. It is known that inhibition of a reverse reaction or control of precipitation through rapid cooling is a key point in the arc discharge synthesis of fullerene Reference Saito, Inagaki, Shinohara, Nagashima, Ohkohchi and Ando11 or chemical vapor deposition (CVD) of graphene, Reference Miyata, Kamon, Ohashi, Kitaura, Yoshimura and Shinohara12 respectively. The high growth rate of CNTs is achieved in the liquid phase deposition, and is attributed to the high gradient of temperature around catalysts immersed in an organic liquid. Reference Nakagawa, Nishitani-Gamo, Ogawa and Ando13 A flaw of this technique is the difficulty in applying catalysts that are solvable to organic liquids or peeled from substrates due to violent bubbling during the deposition.
To resolve the flaw, we have been developing a synthesis technique, named submarine-style substrate heating CVD, in which catalysts do not contact organic liquid despite the fact that the synthesis chamber is settled in the liquid. In the present study, we have adopted graphene oxide Reference Dreyer, Park, Bielawski and Ruoff14 (GO) as a catalyst support in applying this CVD method to the synthesis of carbon nanomaterials, and succeeded to synthesize nanofibers composed of novel pot-shaped carbon nanomaterials, named carbon nanopot in this study. GO is well-known as an excellent support of metal nanoparticles, and its potential applications in catalysis, light energy conversion, fuel cells, and sensors have been examined. Reference Kamat15 On the other hand, CNTs were produced in a conventional CVD with GO-supported Ni nanoparticles. Reference Zhang, Xiong and Zhao16 No further investigation, however, into the synthesis of carbon nanomaterials with GO-supported catalysts has been reported to the best of our knowledge. Catalyst supporting materials made of sp 2 carbon could not only disperse metal nanoparticles as well as zeolite Reference Mukhopadhyay, Koshio, Tanaka and Shinohara17 but also affect the structure of produced materials made of the same sp 2 carbon.
Nanobell has been already known as a container-shaped carbon nanomaterial that is synthesized in the appearance of fiber. This material was separated into pieces through intense ultrasonication for the application as drug-delivery vehicle in a recent study. Reference Zhao, Tang, Chen and Star18 The properties of carbon nanopot, such as the capacity and the controlled release of medicine, are expected to be definitely superior to those of nanobell as the aspect ratio of a nanopot is much larger than that of a nanobell. In addition, a nanopot has a complex structure in which graphene edges are distributed unevenly at its outer surface and are exposed densely around its closed end, which would enable one to develop new nanomaterials processing unavailable to conventional nanomaterials.
The growth mechanism of this uniquely structured nanomaterial should be also discussed. Several formation mechanisms have been proposed for CNT. Reference Kumar and Yellampalli19 Two general modes, tip-growth mode Reference Davis, Slawson and Rigby20 and base-growth mode Reference Baker and Waite21 are accepted widely in the catalyzed CVD of CNTs on substrates. Depending on the strength of the catalyst-substrate (or -support) interaction, catalyst particles separate from the substrate during the precipitation of CNT across the particle bottom in the former mode, and are anchored to the substrate surface while CNT precipitates out around the particle's apex in the latter mode. The state of catalyst particles during the CNT growth, and the diffusion of carbon after carbon source, such as hydrocarbon, is decomposed on the surface of catalyst particles have been also debatable, whether the catalyst is in the liquid Reference Baker, Barber, Harris, Feates and Waite22,Reference Homma, Kobayashi, Ogino, Takagi, Ito, Jung and Ajayan23 or solid state Reference Baker, Harris, Thomas and Waite24 and whether the carbon diffusion is a volume one Reference Baker, Harris, Thomas and Waite24,Reference Tibbetts25 or a surface one, Reference Baird, Fryer and Grant26,Reference Oberlin, Endo and Koyama27 respectively. Several in situ atomic-scale electron microscopy studies were conducted to approach the heart of these issues. Those studies have revealed that catalyst particles exhibit successive elongation and contraction during the formation of the bamboo-type CNTs in the tip-growth mode while they remain crystalline. Reference Helveg, López-Cartes, Sehested, Hansen, Clausen, Rostrup-Nielsen, Abild-Pedersen and Nørskov28,Reference Hofmann, Sharma, Ducati, Du, Mattevi, Cepek, Cantoro, Pisana, Parvez, Cervantes-Sodi, Ferrari, Dunin-Borkowski, Lizzit, Petaccia, Goldoni and Robertson29 This dynamic deformation of the catalyst particle could also take place in the formation of carbon nanopots. However, one should note that these two nanomaterials are distinct from each other in their nanostructures as described above, which suggests that some aspects of the growth mechanism of carbon nanopot could be unique. As for the carbon diffusion, both a surface one Reference Helveg, López-Cartes, Sehested, Hansen, Clausen, Rostrup-Nielsen, Abild-Pedersen and Nørskov28 and a volume one Reference Hofmann, Sharma, Ducati, Du, Mattevi, Cepek, Cantoro, Pisana, Parvez, Cervantes-Sodi, Ferrari, Dunin-Borkowski, Lizzit, Petaccia, Goldoni and Robertson29,Reference Yoshida, Takeda, Uchiyama, Kohno and Homma30 have been confirmed or supported.
In this paper, we report the development of the submarine-style substrate heating CVD method, and synthesis, structure, and discussion on the growth mechanism of carbon nanopots.
II. EXPERIMENTAL
A. Development of the submarine-style substrate-heating CVD method
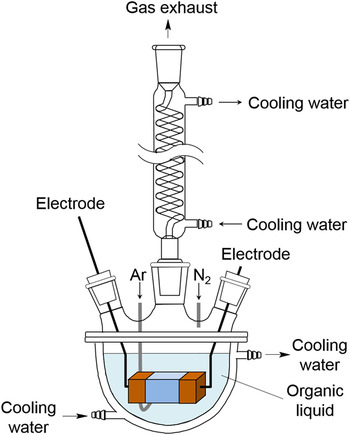
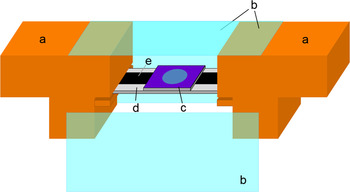
A schematic of an apparatus of the submarine-style substrate-heating CVD method is shown in Fig. 1. A 1-L vessel with a water jacket was half-filled with organic liquid and covered with a five-necked lid. A Dimroth condenser (VIDREX, Fukuoka, Japan) was attached to one of the lid necks, and air remaining inside the vessel was replaced with nitrogen gas at a flow rate of 5 L/min. We assembled a synthesis chamber by covering the top and the sides of the space between two electrodes with 1 mm thick borosilicate glass plates as shown in Fig. 2 and settled the chamber in the organic liquid. The inside of the chamber was not submerged with liquid by maintaining the internal pressure against the hydraulic pressure, and its uncovered bottom served as a gas port. Thus, we have fulfilled the following requirements simultaneously and simply: the catalyst does not contact organic liquid directly, and it is possible to control the temperature gradient around the catalyst to be almost comparable to that in the liquid phase deposition.
Schematic of the submarine-style substrate heating CVD apparatus. Two of five necks are not shown.

Schematic of the synthesis chamber part of the submarine-style substrate heating CVD apparatus. The front glass plate of the chamber is detached for ease of observing the inside. (a) Electrode, (b) borosilicate glass plates, (c) catalyst-loaded silicon substrate, (d) substrate support, and (e) carbon plate heater.

In this study, the catalyst was mounted on thermally-oxidized silicon substrates of 14 mm in length, 9 mm in width, and 0.5 mm in thickness. The thickness of the silicon oxide layer was 300 nm. The substrate was settled 10 mm above the bottom of the inner space of the synthesis chamber, and its catalyst-mounted side was turned upward. The size of the synthesis chamber was 20 mm in length, 25 mm in width, and 20 mm in height. One can also mount the substrate much closer to the surface of organic liquid at the bottom of the chamber by turning the catalyst-mounted side downward, which would realize almost the same condition of the temperature gradient around the catalyst as that in the liquid phase deposition. The substrate was heated with a carbon plate of 5 mm in width and 0.5 mm in thickness attached to the bottom side. The carbon plate was charged with a DC power supply [PU12.5-60, 750 W (12.5 V, 60 A), KENWOOD TMI, Kanagawa, Japan] to heat the silicon substrate to 1273 K. The temperature of the substrate was measured with a calibrated radiation thermometer (THI-900DX16, Sensor: Si, TASCO, Osaka, Japan). Argon gas was blown into the chamber to remove air from the chamber and also to prevent the product from being immersed with organic liquid while cooling the substrate down after the deposition. Carbon source was supplied into the chamber through the vaporization of the organic liquid at the bottom of the chamber due to the radiant heat from the carbon plate heater. Using the thus designed apparatus, we could heat the catalyst to 1273 K and supply it with the carbon source without immersing it with the organic liquid in the whole synthesis process under the level of organic liquid. In addition, we could quench the product from 1273 K to a temperature below 773 K in 2 s by turning off the power supply.
B. Synthesis and analysis of carbon nanopot
GO used as the catalyst support was prepared with a modified Hummers method. Reference Hummers and Offeman31 The concentration of GO in the aqueous dispersion was diluted to 0.092 g/L approximately. Iron acetate (99.995%, Aldrich, St. Louis, Missouri) and cobalt acetate tetrahydrate (99.998%, Aldrich) were dissolved in the dispersion with a concentration of 0.01 mol/kg for both, in which metal acetates are decomposed and reduced to form catalyst nanoparticles at synthesis, following the procedure developed for catalyzed CVD of CNT. Reference Mukhopadhyay, Koshio, Tanaka and Shinohara17,Reference Mukhopadhyay, Koshio, Sugai, Tanaka, Shinohara, Konya and Nagy32 After the solution was ultrasonicated for 10 min and centrifuged at 15,000g for 30 min, supernatant liquid was replaced with the same amount of deionized water and settled GO was dispersed again. A 1.5 μL drop of the suspension was applied to each of the silicon substrates for synthesis. After the drops dried, the catalyst-supporting GO coats were illuminated by an ultra-high pressure mercury lamp (UI-501C, 500 W, Ushio, Tokyo, Japan). X-ray photoelectron spectroscopy (XPS) was performed for the GO coats mounted on naturally-oxidized silicon substrates in a vacuum better than 10−7 Pa to analyze the amount of iron and cobalt loaded on GO. The XPS system (Sigma Probe, Thermo Scientific, Waltham, Massachusetts) was equipped with a monochromatized x-ray source (Al Kα, hν = 1486.6 eV). Electrons emitted from the samples were detected by a hemispherical energy analyzer equipped with six channeltrons. The overall energy resolution for XPS was below 0.55 eV (on Ag 3d 3/2 with a pass energy of 15 eV). XPS peaks were deconvoluted using Gaussian components after Shirley background subtraction. XPS was also used to analyze the termination states of graphene edges in the outer side of carbon nanopot.
In the synthesis with the submarine-style substrate-heating CVD apparatus, we used 2-propanol as organic liquid, expecting to keep the catalyst active longer. Reference Maruyama, Kojima, Miyauchi, Chiashi and Kohno33 The synthesis time and temperature were 10 min and 1100–1130 K, respectively. The morphological and structural features were investigated with a field-emission scanning electron microscope (FE-SEM, JSM-6320F, JEOL Ltd., Tokyo, Japan) and a transmission electron microscope (TEM, JEM-2000FX, JEOL Ltd.) at the acceleration voltage of 5 and 200 kV, respectively. Raman spectroscopy was conducted using a micro Raman spectrometer (RS-RIP-2000, Nippon Roper, Tokyo, Japan) with a 532 nm excitation source for the analysis of the quality of carbon sp 2 network. XPS analysis was performed for aggregates of carbon nanopot fibers transferred to a cleaned silicon substrate from a deposition substrate to avoid detecting photoelectrons from the GO sheets on the base. After the transfer of carbon nanopots, the thus exposed surface of the deposition substrate was analyzed using an electron probe microanalyzer (EPMA, EPMA-1720H, Shimadzu Corp., Kyoto, Japan) at an acceleration voltage of 15 kV and a sample current of 20 nA to investigate catalyst particles supported on GO.
III. RESULTS
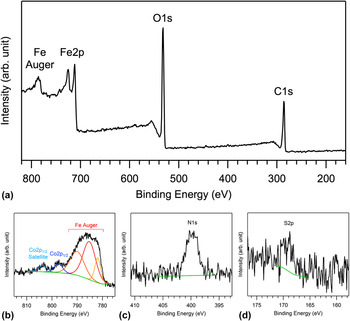
In the XPS measurements of the catalyst-supporting GO coats, prominent peaks assigned to C1s, O1s, and Fe2p, respectively, were observed in the energy range between 160 and 820 eV as shown in Fig. 3(a). Though signals related to Co were detected and the Co2p 3/2 peak was also expected to appear around 780 eV, it was too small to distinguish from the Fe Auger peaks [Fig. 3(b)], which prevented us from determining the Co content accurately. Weak emission peaks assigned to N1s and S2p were also recorded as shown in Figs. 3(c) and 3(d), respectively. The sources of these elements are thought to be remnants of NaNO3 and H2SO4 used in the preparation of GO from graphite powder. Another emission peak was observed at 103.5 eV, and assigned to Si2p. This emission is originated from the silicon substrate. The content of the catalyst-supporting GO coats was estimated at 48.7, 38.5, 0.9, 0.3, 10.7, and 0.8 at.% for C, O, N, S, Fe, and Co, respectively, through semiquantitative analysis of these emission peaks. Though the accuracy of the Co content is limited, it was obvious that the content of Co is an order of magnitude smaller than that of Fe despite the fact that the Co/Fe molar ratio was 1:1 in the mixture of metal acetates added to GO dispersions.
XPS spectra of catalyst-supporting GO coats on a silicon substrate. (a) Widely scanned, (b) Co2p 1/2, (c) N1s, and (d) S2p XPS spectra are displayed.

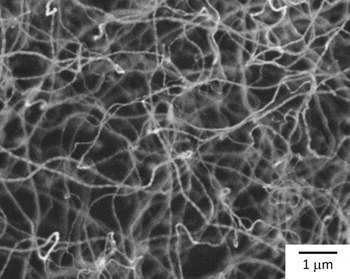
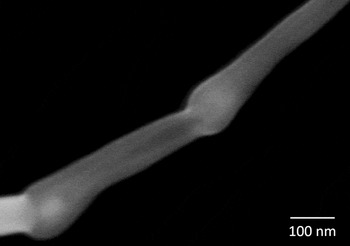
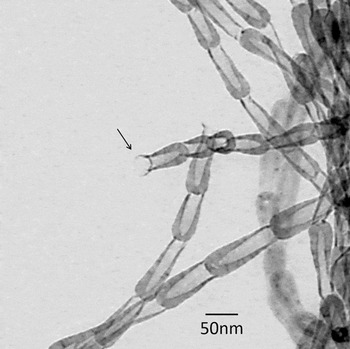
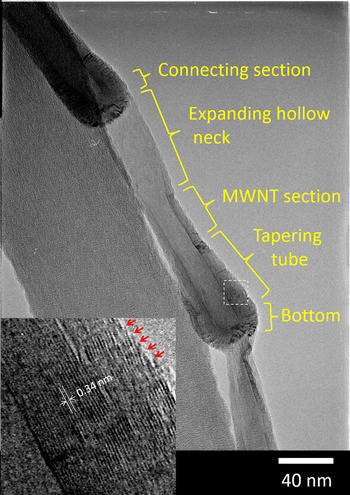
In the SEM observations of products synthesized at 1110 K, we noticed that a lot of winding nanofibers are not simply formed but there is also a repeated cyclical bright and dark pattern on every nanofiber as shown in Fig. 4. In the observations of the products under high magnification, we found that these nanofibers consisted of cyclic combination of a rounded section and a linear section (Fig. 5). Investigations using TEM revealed that pot-shaped units, in which the end of the hollow straight section was open and the end of the rounded section was closed, were connected in the appearance of fiber (Fig. 6). The pot-shaped units had a complex nanostructure composed of a bottom part and tapering tube section formed of multi-layer graphene, a multi-walled-tube section with a fairly constant outer diameter, an expanding hollow neck, and a connecting section (Fig. 7). The distance between layers was estimated at 0.34 nm (Fig. 7, inset), which is in line with that in multi-walled CNTs. Reference Iijima3 The following features were also found: the innermost graphene layer was connected in the region from the bottom part to the multi-walled-tube section while the graphene layers at the outer surface of the tapering tube section were terminated, where graphene edges were distributed densely (Fig. 7, inset); the graphene layers were disconnected between the pot-shaped units (Fig. 7); separated single pot-shaped units were also observed (not shown). The length of some fibers exceeded 100 μm (not shown). Typical geometry parameters of the products were 20–40 nm in outer diameter, 5–30 nm in inner diameter, 100–200 nm in unit length, and 20–100 μm in fiber length. Nanofibers synthesized at 1120 K had the same structure as mentioned above. Hereafter, we refer to the pot-shaped unit and the nanofiber composed of the pot-shaped units as “carbon nanopot” and “carbon nanopot fiber,” respectively, as named in the following section.
FE-SEM image of products synthesized at 1110 K. A repeated cyclical bright and dark pattern is recognized on every nanofiber.

Magnified FE-SEM image of a product synthesized at 1110 K.

TEM image of products synthesized at 1110 K. The arrow points to an open end of a pot-shaped unit.

TEM image of pot-shaped units synthesized at 1110 K. Different parts of the unit are labeled. The inset is a magnified view of the section bordered by the dashed box in the main image. The value indicates the average distance between layers. The arrows point to the graphene edges along the outside of the tapering tube part.

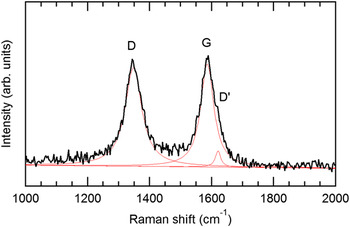
A typical Raman spectrum of carbon nanopot fibers is shown in Fig. 8. Two distinct peaks were observed at 1345 and 1586 cm−1, which are assigned to D and G bands, respectively. A small D′ band at 1620 cm−1 was also recognized according to peak deconvolution with Lorentz functions. The G band corresponds to the in-plane stretching vibration in graphite. The D and D′ bands are associated with the existence of defects in the two-dimensional hexagonal graphitic network. It was noted that the intensity ratio of the D band to the G band at their peaks (I D/I G) is inversely proportional to the in-plane crystallite size. Reference Tuinstra and Koenig34,Reference Cançado, Jorio and Pimenta35 In the case of the carbon nanopot fibers, the ratio was calculated at 0.954, which is corresponding to a crystallite size of 20.2 nm. Reference Cançado, Jorio and Pimenta35
Typical Raman spectrum of carbon nanopot fibers. Fitted Lorentz curves are shown by thin lines. The D, G, and D′ bands are labeled, respectively.

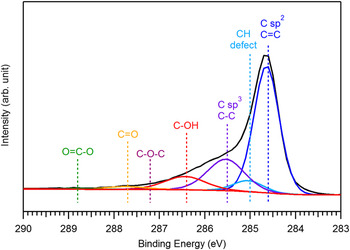
In the XPS measurements of the aggregates of carbon nanopot fibers, a tail was observed at the higher energy side of the C1s peak for sp 2 C=C bonds at 284.6 eV (Fig. 9). This spectral structure is attributed to chemical shifts corresponding to C–H bonds, defects, sp 3 C–C, and oxygenated functional groups modifying carbon atoms in the outer layers of the carbon nanopot. Reference Koinuma, Tateishi, Hatakeyama, Miyamoto, Ogata, Funatsu, Taniguchi and Matsumoto36 Through detailed peak analysis, we have found that 9.5 at.% of the carbon atoms are modified with the hydroxyl group. We note that silicon with the amount comparable to that of carbon was detected in the measurements. This result means that the fibrous material could not cover the silicon substrate completely. Though the XPS analysis showed that the substrate surface was contaminated with carbon materials, the amount of carbon was less than 10 at.% while the rest of the components were silicon and oxygen composing the naturally oxygenated silicon surface. Consequently, most of the detected hydroxyl groups could be attributed to the carbon nanopot fibers.
A typical C1s XPS spectrum of aggregates of carbon nanopot fibers transferred to a silicon substrate from a deposition substrate. Deconvolution of the spectrum using Gaussian curves corresponding to sp 2 C=C, CH (defect), sp 3 C–C, C–OH, C–O–C, C=O, and O=C–O, respectively, is exhibited.

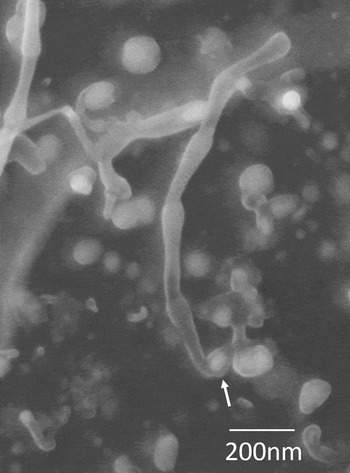
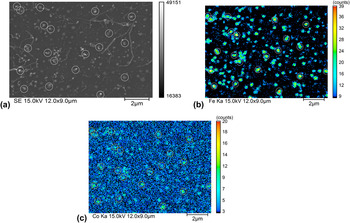
We investigated the GO surface exposed after longer carbon nanopot fibers were harvested for TEM observations, and found that the round and linear sections of each carbon nanopot are formed on the tip and base sides, respectively, and nanoparticles, which are thought to be catalysts, stay on the base in some leftovers of the nanofibers as exhibited in Fig. 10. The size of the nanoparticles was distributed widely in a range between 15 and 120 nm. Carbon nanopot fibers were observed to grow from catalyst nanoparticles with the size smaller than 40 nm approximately. The EPMA study of the exposed surface has clarified that the distribution of iron and that of cobalt were coincident with the positions of nanoparticles [Figs. 11(a)–11(c)). It was suggested qualitatively that the content of cobalt was much less than that of iron, which is in line with the result in XPS analysis mentioned above.
FE-SEM image of a GO surface exposed after longer carbon nanopot fibers were harvested. A catalyst particle staying on the base part of a carbon nanopot fiber is indicated with an arrow.

EPMA images of (a) secondary electron, (b) Fe Kα x-ray, and (c) Co Kα x-ray of a GO surface after longer carbon nanopot fibers were harvested. Some of nanoparticles are marked with circles for ease of correspondence.

We also obtained fiber-shaped products for the synthesis at 1100 or 1130 K. There was, however, no clear cyclic variation in the diameter of these fibers observed.
IV. DISCUSSION
The features of the pot-shaped material synthesized in this study are quite different from those of nanobell, which consists of a bottom part and expanding sidewall part formed of graphene layers with a fairly constant thickness. The typical aspect ratio of the depth to the inner diameter in the hollow space of nanobell is 1–3. On the other hand, the pot-shaped material has the aspect ratio as high as about 10, and more complex nanostructures consisting of several sections formed of graphene layers with different layer numbers as well. The latter feature is accompanied by another distinct feature that dense graphene edges are localized to the outer side near the closed end. Consequently, we have judged that the pot-shaped material is a new material and named it carbon nanopot.
The I D/I G ratio of the carbon nanopot in Raman spectroscopy was 0.954, which is slightly higher than that reported for bamboo-type CNTs (0.82 at the synthesis temperature of 850 °C). Reference Lee, Park, Choi, Ryu and Lee37 We interpret this result to imply that defected structures are fixed before relaxing to the most stable structure in the growth process under the high temperature gradient while the extreme condition would favor the formation of metastable phases. The XPS analysis suggested that approximately 10% of carbon atoms in the outer layers of carbon nanopot are hydroxylated. The most possible hydroxylation sites are the graphene edges distributing densely at the outer surface of the tapering tube section. It could be another merit of using an alcoholic carbon source that the graphene edges are terminated by the hydroxyl group rather than hydrogen. We expect that carbon nanopots might behave like nano-surfactants as the densely hydroxylated region could be localized to the vicinity of the closed end, which would make the closed end part hydrophilic while the open end part remains hydrophobic.
We assumed that the growth behavior of a carbon nanopot is different from those of existing carbon nanomaterials to some extent as the carbon nanopot has a far more complex structure than those nanomaterials. The following viewpoints are taken into consideration in examining the growth mechanism of carbon nanopots:
-
(i) GO was used as a catalyst support. The metal catalyst with high carbon content is expected to have a similar affinity for both the surface of GO and the inner surface of carbon nanopot.
-
(ii) Carbon nanopot could be formed in the base-growth mode, as suggested in the SEM observation of the exposed GO surface (Fig. 10).
-
(iii) Catalyst particles could exhibit successive elongation and contraction during the formation of carbon nanopot even in the solid phase as observed in the in situ TEM studies. Reference Helveg, López-Cartes, Sehested, Hansen, Clausen, Rostrup-Nielsen, Abild-Pedersen and Nørskov28,Reference Hofmann, Sharma, Ducati, Du, Mattevi, Cepek, Cantoro, Pisana, Parvez, Cervantes-Sodi, Ferrari, Dunin-Borkowski, Lizzit, Petaccia, Goldoni and Robertson29
-
(iv) The carbon diffusion in catalyst particles could be both a volume one and a surface one.
-
(v) The sharp temperature gradient, a feature of the submarine-style substrate-heating CVD method, would promote the precipitation of carbon in colder surface areas of catalyst particles.
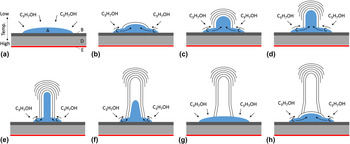
We propose the following growth model, integrating the above viewpoints (Fig. 12). At the first stage, iron acetate and cobalt acetate supported on GO are decomposed at high temperatures and would be reduced to iron–cobalt alloy with hydrogen generated through the decomposition of the alcoholic carbon source on the particle surface. These processes should be similar to those in the conventional alcohol catalytic CVD of CNTs. Reference Maruyama, Kojima, Miyauchi, Chiashi and Kohno33 Carbon atoms generated through the decomposition of the organic gas dissolve in the catalyst particle and diffuse [Fig. 12(a)], and are precipitated as a cap-shaped graphene sheet (graphene cap) at an apex, where the temperature is lower due to the sharp temperature gradient [Fig. 12(b)]. The catalyst particle with a high carbon content protrudes, keeping in contact with the inner surface of the graphene cap as a new cap is precipitated and the cap edge is extended through the surface diffusion of carbon. This behavior of catalyst particles was confirmed in the in situ TEM observations. Reference Hofmann, Sharma, Ducati, Du, Mattevi, Cepek, Cantoro, Pisana, Parvez, Cervantes-Sodi, Ferrari, Dunin-Borkowski, Lizzit, Petaccia, Goldoni and Robertson29,Reference Yoshida, Takeda, Uchiyama, Kohno and Homma30 The sharp temperature gradient is expected to favor the precipitation of a new graphene cap rather than the extension of older caps, which would cause termination of the extension of the older caps when a new cap is precipitated [Fig. 12(c)]. As the catalyst particle becomes elongated, the supply of carbon to the tip of the catalyst particle decreases and the growth at the cap edge becomes superior to the precipitation of new graphene layers [Fig. 12(d)]. The multi-walled-tube section with less disconnection of outer graphene layers is formed in this way [Fig. 12(e)]. As the multi-walled-tube section extends, the carbon content of the catalyst particle decreases due to the increase of the diffusion length and the temperature decrease around the catalyst tip. This triggers the contraction and the evacuation of the catalyst particle from the hollow space [Fig. 12(f)]. The catalyst particle forms the expanding hollow neck through the growth at the graphene edge on the way back and finishes forming one unit of a carbon nanopot [Fig. 12(g)]. Another cap-shaped graphene layer corresponding to the bottom part of the next carbon nanopot is precipitated after the carbon content of the catalyst particle at the apex is recovered [Fig. 12(h)]. In summary, we have assumed that a part of the catalyst particle intrudes into and evacuate from carbon nanopots in turn while the other part sticks to the GO surface firmly, to form connected carbon nanopots.
Proposed growth model of carbon nanopot. (A) Catalyst particle, (B) GO sheets, (C) carbon atom, (D) silicon substrate, (E) carbon plate heater. The arrows represent the intake of carbon atoms by the catalyst particle or diffusion of carbon atoms. The panel labels (a)-(h) indicate the sequence of the growth steps. See text for details.

The XPS analysis has revealed that the amount of cobalt loaded on GO was in an order of magnitude smaller than that prepared. This could be attributed to the low pH value (3.6) of the GO suspension used in this study. It was reported Reference Liu, Fan, Yu, Wu, Liu, Qiu and Liu38 that cobalt was successfully loaded on reduced GO through the pH adjustment of a GO suspension to 9.5. In addition, it was found that the size of the catalyst particles formed on GO sheets was not uniform. It should be noted that the small content (0.3 at.%) of sulfur was detected in the XPS analysis of the catalyst supporting GO sheets. The effect of sulfur on the formation of filamentous carbon was studied intensively in 1990s. Kim et al. explained that sulfur enhances the filamentous growth of carbon by selectively poisoning the surface of the catalysts. Reference Kim, Rodriguez and Baker39 Tibbetts et al. explained that the role of the sulfur in enhancing carbon fiber growth is to melt the iron-based catalyst particle, enabling vapor–liquid–solid growth, because the Fe–S system is eutectic at 988 °C. Reference Tibbetts, Bernardo, Gorkiewicz and Alig40 In the present study, the ratio of atomic percentages of sulfur and iron is 0.03, which is too small to reduce the melting point of the catalyst. As for the effect of selective poisoning of the catalyst surface, however, quite small amount of sulfur could affect the filamentous growth of carbon. The content of cobalt in the catalyst particle, the particle size and remnants of sulfur could affect the morphology and growth rate of carbon nanopots. The effects and control of these conditions will be investigated further.
The carbon nanopot could be a highly functional material. The structural features such as the dense exposure of presumably hydroxylated graphene edges at the outer surface of the tapering tube part or the aspect ratio of the hollow space as high as about 10 would be favorable to its application to functional composite materials or drug delivery, respectively.
V. CONCLUSION
It has been confirmed through FE-SEM and TEM observations, XPS, EPMA, micro-Raman spectroscopy that the pot-shaped carbon nanomaterial synthesized using the submarine-style substrate heating CVD method is a novel nanomaterial and that it has a complex and regular nanostructure consisting of several parts made of different layer numbers of graphene and a deep hollow space (the aspect ratio of ∼10). This new material has been named carbon nanopot. It is suggested that using GO as a catalyst support and the nonequilibrium reaction field generated in the submarine-style substrate heating CVD method could be essential to the formation of carbon nanopot. The following growth model has been proposed: a part of the catalyst particle intrudes into and evacuates from carbon nanopots in turn while the other part sticks to the GO surface firmly, to form carbon nanopots in series. The dense exposure of presumably hydroxylated graphene edges at the outer surface of the tapering tube part as well as the deep hollow space would give enough reason to examine its utility, for example, in the development of composite materials or drug delivery systems.
ACKNOWLEDGMENTS
This work was supported by the Core Research for Evolutionary Science and Technology (CREST) of the Japan Science and Technology Agency, JSPS KAKENHI Grant No. 24510153. We appreciate Dr. Masayuki Tsushida and Mr. Tetsuya Sato of the Technical Division, Faculty of Engineering, Kumamoto University for the TEM observations and the EPMA analysis, respectively.