For government, there is no equivalent to the legal right of silence (Norton, 1993: 332)
Introduction
The Greek political system has gone through turmoil since 2009. As the scope of the economic crisis and the severity of the subsequent austerity measures unfolded, the party system began to go through massive changes. The Socialist Party, one of the two major players in Greek politics, was nearly decimated in the 2012 election, and Syriza, an anti-austerity party, challenged the political establishment. Shaky government coalitions became a necessity as ruling parties struggled to implement painful economic policies. However, these events are not part of an isolated ‘Greek tragedy’. For example, in 2011 a coalition government was formed in Portugal. This coalition of Social Democrats and Conservatives enacted severe, unpopular austerity measures, which led to a rift between the coalition partners. The crisis culminated with the resignation of the leader of a junior coalition member. The background to the resignation was the opposition of factions within the party to austerity, and evidence of the erosion of public support for these policies. In Ireland, another austerity-laden country, the center-right Fine Gael and the left-leaning Labour formed a coalition in March 2011. Over the following 2 years, characterized by aggressive austerity policies, seven key figures in the Labour party resigned due to their disagreement with the government’s economic policies. In 2014, amid growing concerns over the party’s numbers at the polls and Labour’s poor electoral performance, the leader of the party resigned.
As these cases illustrate, the implementation of severe, unpopular austerity policies has had a profound impact on party politics. This article focuses on the Greek case. During the period of austerity, members of Greek governments attempted to thread the needle of holding on to power while bracing for the electoral consequences of their participation in government. In light of these events, the article asks two general questions. First, how does the politics of severe austerity affect the behavior of legislative parties? Second, what can be learned from these dynamics about legislative politics in general? In order to answer these questions, the paper draws on blame avoidance (Weaver, Reference Weaver1986; Pierson, Reference Pierson1996; Giger and Nelson, Reference Giger and Nelson2011; Schumacher et al., Reference Schumacher, Vis and van Kersbergen2013) and coalition oversight literature (Thies, Reference Thies2001; Martin and Vanberg, Reference Martin and Vanberg2004; Lipsmeyer and Pierce, Reference Lipsmeyer and Pierce2011; Carrol and Cox, Reference Carrol and Cox2012; Indridason and Kristinsson, Reference Indridason and Kristinsson2013). Governments and legislative environments provide members of coalition governments with an array of mechanisms with which they can monitor their coalition partners, overcome tensions within the coalition Martin and Vanberg, Reference Martin and Vanberg2005, or communicate intra-coalition disagreements to voters Martin and Vanberg, Reference Martin and Vanberg2008. Communicating intra-coalition tensions may be especially important in unpopular austerity governments, as parties try to minimize the political blame associated with the painful policies the government is pushing forward. Thus, the fundamental questions of this article are: Do parties who are members of these governments increase their use of these mechanisms? And, if so, what motivates the use of these institutions?
Focusing on parliamentary questions (PQs), an institution that has, thus far, received little attention in the context of coalition politics, the analysis provides a positive answer to the first question. Junior parties in coalitions overseeing unpopular austerity measures increase their use of these measures to an unparalleled degree. With regard to the second question, the results echo recent literature arguing that political ideology and electoral bases condition blame avoidance behavior (Giger and Nelson, Reference Giger and Nelson2011; Jensen and Mortensen, Reference Jensen and Mortensen2014). Specifically, the results indicate that while serving in government as junior members, PASOK, the Panhellenic Socialist Movement, uses its PQs to minimize or avoid the blame associated with austerity, while the conservative New Democracy (ND) does not. Thus, the article sheds light on new venues of oppositional behavior within government coalitions, but also highlights the importance of left-right ideology in conditioning this behavior.
The analysis is based on a new data set comprising all of the oral PQs and interpellations in the Greek parliament during the 2007–12 period. The data cover a period that can be characterized as ‘business as usual’ (pre-2010), as well as the austerity measures’ period. These measures were implemented by both right- and left-leaning parties, as well as by government coalitions.Footnote 1 The focus in the first part of the analysis is on the frequency of using PQs by legislative parties, conditional on their status as opposition/government members. The results of this section demonstrate that while serving as junior coalition partners in austerity governments, parties’ usage of PQs rivals their usage of this institution while in opposition. Put differently, while parties serve as junior members in unpopular austerity coalitions,Footnote 2 they behave ‘as if’ they were in the opposition.
The second part of the analysis utilizes a new method of quantitative text analysis in order to explore the topics of PQs. This method offers an answer as to the reason behind the rise in PQs usage for junior members of austerity coalitions. The analysis of topics’ distribution across PQs and parties demonstrates that while serving as a junior coalition member, the socialist PASOK chooses to highlight problematic aspects of austerity policies in order to avoid blame, while the conservative ND party (while serving as a junior member of a different austerity coalition) does not. This finding is in line with recent research by Giger and Nelson (Reference Giger and Nelson2011) and Jensen and Mortensen (Reference Jensen and Mortensen2014), which argues that left-wing parties are more sensitive to the possible electoral cost of implementing entrenchment policies.Footnote 3
This article makes a number of contributions. First, it adds a new facet to the coalition-monitoring literature by analyzing the use coalition members make of PQs, an institution that has not been studied systematically in the context of coalition politics. Second, it highlights oppositional behavior of coalition members in austerity governments. Austerity governments exemplify the dilemma faced by every coalition party. On the one hand, parties would prefer the coalition to survive, but electoral considerations also dictate a degree of differentiation and distancing among the parties, especially in unpopular coalitions. In unpopular austerity coalitions this need for differentiation is extreme and is manifested by oppositional behavior. This ‘intra-coalition opposition’ behavior is an understudied aspect of coalition politics, which should be further explored in future research. Third, the analysis demonstrates the importance of context (specifically, government policies and parties’ ideology) in explaining the levels and type of coalition dissent. Finally, along with recent research focusing on legislative speeches (Vasilopoulou et al., Reference Vasilopoulou, Halikiopoulou and Exadaktylos2014), the article seeks to add to our understanding of the important changes undergoing the Greek party system as a result of the economic crisis, by systematically analyzing legislative rhetoric.
Coalition oversight, electoral motivations and PQs
Coalition governments create a complex set of principal-agent problems. Given the division of labor in modern governments, it is essential that parties allow other actors in the coalition to take the lead on some policy issues, and play a secondary role with regard to these issues. In their seminal work, Laver and Shepsle (Reference Laver and Shepsle1996) offer a theoretical model by which ministers are allowed unlimited latitude with regards to their respective portfolios. However, empirical work has shown that parties use a variety of institutions to monitor and oversee the actions of ministers from different parties. These institutions exist both at the level of government and in the legislative arena. With regard to the former, Müller (Reference Müller2000), Thies (Reference Thies2001), and Lipsmeyer and Pierce (Reference Lipsmeyer and Pierce2011) have found that parties use junior ministers to monitor the actions of ministers from partner parties during the tenure of government, while Indridason and Kristinsson (Reference Indridason and Kristinsson2013) show that coalition agreements provide an important mechanism to contain policy drift.
Shifting our focus to the parliamentary arena, legislative committees play a key role in coalition oversight, as chairmen of strong committees have been shown to ‘shadow’ ministers from rival (coalition partners) parties (Loewenberg and Kim, Reference Loewenberg and Kim2005; Carrol and Cox, Reference Carrol and Cox2012). In addition, legislative review procedures (Martin and Vanberg, Reference Martin and Vanberg2004, Reference Martin and Vanberg2005) have been identified as oversight mechanisms. These works advanced the coalition oversight literature because they emphasized the ability of coalition parties to use legislative institutions in order to either delay the passage of an undesirable bill or amend it at the legislative stage. More generally, they have shown that the dynamics of coalition oversight does not end at the level of government, but extends to the legislature.
The rationale of legislative- and government-level oversight institutions is functional. Specifically, they provide problem-solving mechanisms that allow for greater cooperation among coalition parties. Analyzing legislative debates, Martin and Vanberg (Reference Martin and Vanberg2008) assign a larger role to electoral motivations. Specifically, the authors find that coalition parties use legislative debates to communicate their positions to voters, especially on issues where they disagree with their coalition partners. Here, the rationale is party differentiation within the context of coalition government. This is a fundamental tension in coalitional politics, or, as the authors put it: ‘one of the most delicate problems of participating in coalition: reconciling the tension between the need to compromise on policy with the need to maintain the party’s public profile with respect to certain policy commitments’ (Martin and Vanberg, Reference Martin and Vanberg2008: 502–503). Undoubtedly, the tension between parties’ desire to remain in government and communicating their position to voters (a position that may be different than the one advocated by the coalition) is a core component of parties’ behavior in coalition. Thus, this paper expands the toolkit that can be utilized by coalition parties for these purposes, by analyzing their use of PQs.
These questions have not been systematically studied in the context of coalition politics.Footnote 4 This lack of attention to PQs is surprising, as in terms of their institutional intent, PQs are a legislative tool used to monitor, gain information from, and to a lesser extent, control the actions of the government (Wiberg, Reference Wiberg1994; Cole, Reference Cole1999; Akirav, Reference Akirav2011). Among others, Wiberg (Reference Wiberg1995: 185) discusses PQs as being used for a number of goals:
-
1. gain access to information,
-
2. gain personal publicity (for the asking MP),
-
3. demand explanations,
-
4. pressure for action,
-
5. attack ministers,
-
6. show concern for constituencies,
-
7. demonstrate the government’s faults, and
-
8. rally the troops within an opposition.
As can be seen, questions vary in terms of their specific goals, procedures, and style, but the overarching purpose of PQs is that of position signaling. For the political actor asking the question, these questions offer a unique opportunity of highlighting their preferences, and conveying them to other political actors, including parties and voters. Indeed, recent empirical research of PQs has moved beyond description and classification. Instead, it focuses on the strategic use of PQs by opposition parties. For example, Thesen (Reference Thesen2013) finds that opposition parties are more likely to raise questions on issues they own when the news is bad (for the government). Similarly, focusing on the Danish parliament, Green-Pedersen (Reference Green-Pedersen2010) demonstrates that opposition parties raise questions based on issue ownership.
However, there is nothing about PQs suggesting that only members of the opposition should use them. PQs serve two purposes in the case of coalition members. Broadly, the use of these questions follows the same logic outlined by scholars studying coalition oversight processes, especially when it comes to communicating intra-coalition differences. Most importantly, PQs offer these parties a venue for signaling to future voters how their preferences differ from those of other coalition members, and a way of demonstrating that they are protecting constituents’ interests and exposing problematic aspects in the government’s policies. Electorally, this can be an important tool, especially when the policies advocated by the government are unpopular. Second, PQs can be used for monitoring purposes, that is, they can be used to demand explanations and additional information by coalition members.
Importantly, the reasoning underlying the use of PQs by coalition members is based on the assumption that coalition governments are not cohesive actors, and that the preferences of coalition partners may differ. While the main party in government, which is generally conceived as having the last word in terms of policy making (Duch and Stevenson, Reference Duch and Stevenson2008), may want to keep problematic issues outside of the parliamentary agenda, the motivations of junior coalition members may be different. These parties can provide the support necessary for the survival of government and enjoy the perks of office, while at the same time use their PQs for electoral and monitoring goals. Put differently, although all parliamentarians can potentially use PQs for these purposes, it is less likely that legislators from the main party in government will use this resource, as it might discredit their party and harm its electoral prospects.Footnote 5
Overall, PQs offer a valuable resource to junior coalition partners. They allow junior coalition partners to stay in the coalition and enjoy the perks of government, while behaving in a way that can be electorally beneficial. Put differently, these questions offer a means of ‘intra-coalition opposition’, that is, a way in which members of the coalition can behave as if they are in the opposition. This opportunity is especially important in unpopular governments, as by using PQs, a junior coalition member can highlight its disagreement with the policies pursued by the coalition leader to voters.
Intra-coalition opposition and blame avoidance
Within the context of coalition politics, blame avoidance tactics stem from electoral considerations. A government aiming to cut social programs faces risks because voters are attached to the services of the welfare state (Pierson, Reference Pierson1996, Reference Pierson2001; Huber and Stephens, Reference Huber and Stephens2001). I argue that if indeed these measures are unpopular, parties in austerity coalitions might be expected to use the resources provided by their institutional environment to minimize the electoral costs associated with their membership in government.
The first blame avoidance strategy is simply the formation of a coalition. Coalition governments make it harder for voters to assign responsibility for policies, and thus might reduce the electoral punishment associated with unpopular policies (Anderson, Reference Anderson2000; De Vries et al., Reference de Vries, Edwards and Tillman2011). According to typologies of blame avoidance mechanisms, coalition formation in the context of austerity is part of a ‘circle the wagons’ (Weaver, Reference Weaver1986: 388) tactic, whereby the responsibility for policies is distributed among a number of political agents.
The second legislative blame avoidance strategy is finding a ‘scapegoat’ (Hood, Reference Hood2002). In this strategy, politicians attempt to delegate the blame for unpopular measures to others, or at least minimize the loss they might incur for being associated with these policies. Again, in the realm of legislative politics, junior members of the coalition are able to use this strategy. This is because members of the main party in the austerity government cannot credibly argue that painful austerity measures are not their party’s responsibility. It is more likely that junior members of the coalition would at least try to minimize the blame by shifting the responsibility for painful measures to other members of the coalition.
However, in the context of austerity measures, blame avoidance tactics are only relevant if these measure are unpopular. Thus, an important question remains: Are austerity measures always an electoral liability? This is important because if austerity measures are popular, then there is no incentive for members of a coalition to behave in an oppositional manner (e.g. increase their use of PQs). Indeed, recent empirical work has questioned the assumption that cutting social policies always leads to voter wrath (Giger and Nelson, Reference Giger and Nelson2011; Jensen and Mortensen, Reference Jensen and Mortensen2014), by highlighting the mediating effects of factors such as the partisan composition of the government and its institutional fragmentation. Partisan composition might play a role because, as opposed to voters of left-leaning parties, voters of economically conservative parties are less sensitive to retrenchment policies and might even favor them (Kitschelt, Reference Kitschelt2001). Institutional fragmentation affects the ability of the public to identify and assign responsibility to relevant policy makers. In addition, globalization and international economic structures may affect the ability of the public to attribute responsibility to national-level politicians (Duch and Stevenson, Reference Duch and Stevenson2008).
Thus, it is necessary to examine two crucial aspects with regards to the Greek case. First, were austerity measures unpopular in Greece? Public opinion data provided by Kosmidis (Reference Kosmidis2014: 1144) demonstrate that the socialists lost more support during the 2009–12 period than the conservatives did. While it is obvious that at least part of this precipitous decline has to do with austerity measures, the fact that the data only cover periods where PASOK was the major party in government (and was thus responsible for austerity) does not allow us to make any inferences regarding ND’s voters, and the impact of austerity measures initiated by ND on their voting intentions. However, the data indicate that austerity governments were indeed unpopular. Second, it is important to inspect the degree to which the Greek public was able to identify the relevant political actors, and their relationship to austerity. Greece ranks low in terms of institutional fragmentation, and thus the ability of the public to attribute responsibility to government policies is high. What complicates responsibility attribution are the strict conditions specified by the international Troika in their agreements with Greek governments, essentially tying national-level politicians’ hands.Footnote 6 However, examination of survey data focusing on attribution of political responsibility reveals that after the parliamentary approval of the bailout plan signed with the Troika, respondents attribute more and more responsibility to their national government at the expense of the EU (Kosmidis, Reference Kosmidis2014: 1142). Put differently, Greek voters see their national government as responsible for the political situation, even though the latitude given to the government by the EU is limited.
The preceding discussion leads to two testable hypotheses. First, as austerity measures and the governments implementing them are generally unpopular in Greece, and the public’s ability to assign responsibility for the measures is high, we might expect all junior members of these coalitions to increase their use of PQs. As mentioned, using these measures signals intra-coalition disagreement to other political actors, especially voters, and allows the parties to enjoy the perks of government while behaving in an oppositional way:Footnote 7
Hypothesis 1 Parties serving as junior coalition partners in unpopular austerity governments increase their usage of PQs relative to periods when they lead the government.
Similarly, we might expect blame avoidance tactics stemming from electoral motivations to affect the behavior of all parties who are junior members of austerity coalitions. If all parties in government expect austerity measures to affect them in a similar fashion at the polls, then we should observe an increase in the use of austerity-related PQs by all junior members of governments, regardless of their ideological position. However, given the differences in parties’ ideology and support bases, it is possible that conservative parties would be less concerned about losing votes due to their membership in austerity governments. If this is the case, we should expect only left-leaning parties to use PQs in order to avoid austerity-related blame:
Hypothesis 2 Partisan blame avoidance: Socialist Parties (PASOK) serving as junior coalition partners during unpopular austerity governments will emphasize economic and social issues in their PQs, while conservative parties (ND) will not.
Data and methodology
The raw data, consisting of 1014 daily parliamentary sessions from July 2007 to December 2012, were retrieved from the records of the Greek parliament. The Greek parliament stores its daily discussions (in Greek) using a variety of formats (various types of .PDF and .doc files). Computer scripts were used in order to unify the format of the raw data into .txt format. In the next stage of pre-processing, I used Python scripts to scrape all the oral PQs and interpellations from daily discussions. More specifically, each question in the data set generally starts with an MP asking the question and the minister providing a preliminary answer, followed by a discussion among a number of MPs. The question ends when the chair of the session moves to a different topic on the agenda. This yielded 2815 oral PQs, tagged by the partisan affiliation of the MP asking the question. The final stage of data pre-processing consisted of generating a vocabulary of the 10,000 most frequent words in the corpus, and using the vocabulary to generate the 2815×10,000 document-term matrix, which included 8,231,981 words.
A new method for text analysis: the Factor Analytic Topicky (FAT) model
In order to analyze the content of PQs, I first select the words to be analyzed. This stage is necessary, as the entire vocabulary used by legislators is too large to analyze, and thus the analysis should focus on words whose covariation convey meaningful topical information. The FAT model (Monroe et al., Reference Monroe, Colaresi and Quinn2012) feature-selection approach is similar to the generic approaches used in computational linguistics that involve removal of stop words and ranking of words based on criteria such as term frequency-inverse document frequency, or mutual information (Blei et al., Reference Blei, Ng and Jordan2003; Grimmer, Reference Grimmer2010). Note, however, that the FAT approach is more general, as it does not involve arbitrary selection of words. Based on Quinn et al. (Reference Quinn, Monroe, Colaresi, Crespin and Ragev2010), the first stage in this process is to calculate the per word unexpected variance as follows. I represent the length of documents (i.e. the sum of words in each PQ) with the Q×1 vector l, with typical element l q . Second, I denote the number of times a word w was used in question q as y w,q . Then, for each w in (w=1, … , W), I calculate the variance of the differences between the number of times it was used in the PQ and the number of times it would have been used in a ‘typical’ PQ of the same length:Footnote 8
 $$\tilde{\sigma }_{w} ={\rm var}\left(y_{{w,q}} {\minus}{\sum_{{q=1}}^{Q}} y_{{w,q}} {\times}l_{q} \right)$$
The resulting
 $$\tilde{\sigma }_{w} $$
vector captures the extent to which words in specific documents are used differently than in the entire corpus. Words with high values of
 $$\tilde{\sigma }_{w} $$
are those that exhibit high variation across PQs (e.g. words that are used frequently in a small number of documents, but rarely appear in others). Thus, words with high values of
 $$\tilde{\sigma }_{w} $$
are more informative in terms of their topical content. I then rank the words based on their
 $$\tilde{\sigma }_{w} $$
values, and choose an adequate number of words to use in the model.Footnote
9
In the next stage, a ‘prior’ is added to each question.Footnote
10
The prior is formally defined as
 $${\rm median}(l){\times}\sum_{{q=1}}^{Q} y_{{w,q}} $$
. The purpose of this procedure is twofold. First, it shrinks the variance of the words’ frequency toward the global mean, thus favoring the null hypothesis of no differences among words.
The second, a related goal, is to penalize words that appear a very low number of times in the corpus (e.g. typos made by the legislative clerk or esoteric expressions MPs use).
In the next stage, I calculate the log odds ratio for each word w in PQ q relative to the log odds ratio of its use in the entire corpus of questions:
 $$\delta _{{w,q}} ={\rm log}\left( {{{y_{{w,q}} /\sum_{w=1}^W y_{{w,q}} } \over {1{\minus}y_{{w,q}} /\sum_{w=1}^W y_{{w,q}} }}} \right){\minus}{\rm log}\left( {{{\sum_{{q=1}}^{Q} y_{{w,q}} /\mathop{{\sum_{w=1}^W \sum_{{q=1}}^{Q} y_{{w,q}} }}\limits_{{}} } \over {1{\minus}\sum_{{q=1}}^{Q} y_{{w,q}} /\sum_{w=1}^W \sum_{{q=1}}^{Q} y_{{w,q}} }}} \right)$$
In order to standardize the values of δ w,q , I approximate the variance of δ w,q using Equation (3):
 $$\sigma _{{w,q}} ={1 \over {y_{{w,q}} }}{\plus}{1 \over {\sum_{{q=1}}^{Q} y_{{w,q}} }}$$
Finally, I obtain ζ kw , which is the normalized log odds ratio for every word w, in PQ q:
 $$\zeta _{{w,q}} ={{\delta _{{w,q}} } \over {\sqrt {\sigma _{{w,q}} } }}$$
In the final stage, I use factor analysis to model the 2786×1281 Z matrix, with words serving as variables, and PQs as observations.Footnote 11 The FAT model produces two quantities of interest. First, factor loadings, which are correlation coefficients between the topics and the words. Second, as a by-product, the model produces PQ-specific factor scores. These scores are composite variables, which provide information about each PQ’s placement on a specific topic.Footnote 12
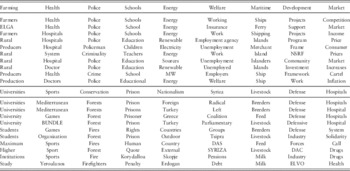
In order to illustrate the topic assignment process and the model’s results, Table 1 presents the 10 highest loading words, resulting from a model estimating 21 topics.Footnote 13 Based on the words that are highly correlated with the topic, topic labels (column titles) are assigned. Inspection of the highest loading words appearing in Table 1 suggests that the FAT model identifies clear, informative, and cohesive topics in the PQs. However, in order to guarantee that the PQs match the topics assigned, I thoroughly examine the scores estimated for the PQs, and read a sample of 30 PQs whose scores for a given topic are the highest.Footnote 14
Highest loadings words, 18 substantive topics (21 topic Factor Analytic Topicky model)

ELGA=Greek Agricultural Insurance Organization; NSRF=National Strategic Reference Framework; MW=Mega Watt; DAC=Defense Ammunition Center; ELVO=Elliniki Viomihania Ohimaton, Hellenic Vehicle Industry; DAS=The German word for ‘that’.
Analysis
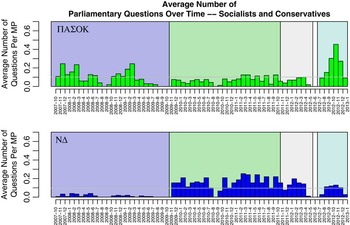
Figure 1 presents the monthly behavior of ND and PASOK. Regarding ND, the figure reveals a clear opposition–government contrast in terms of PQs’ use. During its time in power (2007–09), ND’s MPs generally refrained from asking questions. This stands in stark contrast to their behavior during PASOK’s time in office (2009–11), in which they asked ~0.15–0.2 monthly questions/MP, significantly more than the party’s overall average of 0.09. Interestingly, ND continues to exhibit a relatively high average number of PQs during the unity government period (November 2011–May 2012). After forming the second grand coalition with PASOK (June 2012), we see a slight, expected decline in ND’s PQs’ use. Inspection of PASOK’s PQs behavior reveals that during ND’s term in power (2007–09), PASOK – being the largest opposition party – had generally asked more questions than during its time in office (2009–11). However, during the grand coalition period (June 2012–December 2012), the figure suggests an additional increase in the average number of questions asked by PASOK.
Parliamentary questions behavior over time. Bars represent the number of questions asked by a given party in a specific month divided by the number of legislative seats held by the party. The party mean for the entire 2007–12 period is represented by the superimposed gray line. Colors represent party in power: (from left to right) the area shaded dark blue represents New Democracy’s (ND) government. The green shaded area represents Panhellenic Socialist Movement’s (PASOK) government. The gray area represents the grand coalition with Lucas Papademos as Prime Minister. The white area represents the interelection period of 2012 (May–June). The area shaded light blue represents the grand coalition including ND, PASOK, and Democratic Left.

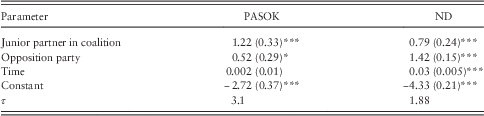
I now turn to testing the first hypothesis. Recall that the hypothesis states that while serving as junior partners in unpopular austerity governments, parties are expected to increase their use of PQs. In order to test the hypothesis, I compared the behavior of these parties (ND, who joined PASOK in November 2011, and PASOK, who joined ND in June 2012) during their partnerships in austerity coalitions (November 2011–May 2012 and June 2012–December 2012, respectively) to (1) their behavior as opposition parties, and (2) their behavior during their tenure either in one-party governments or as the leaders of a government (which is the baseline category in the statistical model). The dependent variable was the average monthly number of PQs that parties had asked during the 2007–12 period. To model the monthly average of PQs, a count model is used. In addition, as the overall number of PQs for a given party is related to the number of seats the party holds in parliament, I utilize the number of their respective MPs as an offset variable.Footnote 15 Finally, as the data are overdispersed, I use a flexible quasi-Poisson model, which, as opposed to Poisson, also estimates the dispersion parameter.Footnote 16 The results are presented in Table 2, with results for PASOK in the left column.
Hypothesis 1: quasi-Poisson model of the number of parliamentary questions by party

PASOK=Panhellenic Socialist Movement; ND=New Democracy.
N=53. Standard errors in parentheses.
*P<0.1; ***P<0.001.
The results of the statistical model show that, as we would expect, opposition parties use PQs much more extensively relative to periods in which they lead the government. This finding applies to both PASOK and ND. However, the important finding is the coefficient of the ‘junior member in coalition’ variable. This coefficient is positive and significant for both PASOK and ND. Substantively, this means that relative to being a government leader, junior coalition members in these governments actually behave in an ‘oppositional’ way, utilizing PQs to a larger extent.
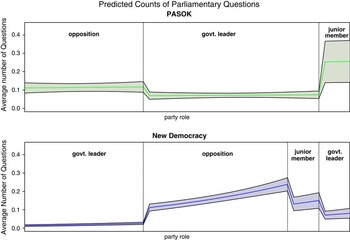
To provide a better overview of the magnitude of this finding, Figure 2 presents the statistical model’s predicted counts of the PQs, along with 90% confidence intervals. The top panel presents the results for PASOK, with vertical lines capturing the elections in October 2009 and June 2012. Examination of the results for PASOK provides strong support for the first hypothesis. Based on the model’s results, the figure demonstrates that not only do PASOK MPs ask significantly more PQs when their party is a junior coalition member than when it is leader of government, they actually ask more questions when the party is a junior coalition member than when it is in the opposition. Specifically, when in the opposition, the monthly average number of questions asked by a PASOK MP is 0.11, while when the party is leading the government the expected monthly average of questions is 0.07. These estimates are significantly <0.25, the respective estimate for the period when the party is in the governing coalition as a junior member.Footnote 17
Predicted number of questions for Panhellenic Socialist Movement (PASOK) and New Democracy (ND). Predicted counts obtained from fitting the quasi-Poisson model. Shaded areas represent 90% confidence intervals. In the top panel the left section depicts the October 2007–October 2009 period, in which PASOK was in opposition. The central section depicts the period in which PASOK led the government, both as a leader of a one-party government and a senior partner of a national unity government (November 2009–May 2012). The right section depicts the period in which PASOK is a junior coalition member. Moving from left to right, in the bottom panel the first section depicts the period in which ND was the government party (October 2007–October 2009). Next, its period in opposition is depicted (November 2009–November 2011). The third section represents the period in which it was a junior coalition member (November 2011–May 2012). The final section captures the period in which the party is leading a grand coalition.

The bottom panel presents the results for ND, with vertical lines capturing the 2009 and 2012 elections, as well as November 2011, when ND joined the PASOK-led government as a junior member. The estimates for ND show that while the PQ count is extremely low when it is leader of the government (0.02), the monthly average of PQs asked as members of coalition or junior members of the government are 0.16 and 0.14, respectively, which are statistically indistinguishable. Thus, while not quite as striking in terms of their magnitude, as a junior coalition member ND behaves ‘as if’ it is in the opposition.
Finally, the 2012 (June–December) coalition included an additional party, the moderate left-wing Democratic Left (DL). Since the party was founded in June 2010 and first participated in the May 2012 election, we cannot compare its performance while serving in the coalition to other periods. However, one way to make an approximate inference about its behavior is to subject it to a difficult test, by comparing its behavior as a junior coalition member to that of all parties while in opposition. The monthly average for DL is 0.57 PQs, while the mean of all parties in opposition during the 2007–12 period is 0.31 PQs (which is of course much higher than that of governing parties). Thus, also in the case of DL, behavior during membership in the austerity government is characterized by increasing rates of PQs. Specifically, on average, it asks twice as many questions as members of the official opposition.
These results demonstrate that parties who are junior members in unpopular austerity governments behave in an oppositional way. PQs serve as a way for these parties to highlight their disagreement with their coalition partners, and in austerity governments, the data demonstrate that PQs are used by junior parties to an extent that rivals their use by members of the opposition.Footnote 18
However, while it is clear that junior members increase their PQ use, regardless of their ideology, the second hypothesis focuses on an additional important aspect: How do these parties use their PQs? Do all parties use their PQs to minimize the blame that might be associated with austerity policies, or do their economic left-right positions affect blame avoidance behavior?
In order to answer this question, all PQs are classified into topics by the FAT statistical model. A PQ is considered to be about a specific topic if its score for the respective topic is the highest among all the scores assigned to it by the model. Out of the 18 political topics identified by the model as characterizing PQs (see table 1), I focus on two topics that capture MPs’ views on austerity measures. The first is most naturally the welfare topic. This topic covers the implications of the crisis and of government policies on the job market and on economic welfare. In addition, the market topic focuses on an important aspect of austerity measures. PQs that are classified under this topic cover economic aspects such as prices, inflation, and competitiveness. Overall, these topics cover the most immediate and visible implications of the economic crisis and government austerity policies, and offer parties the best opportunity for blame avoidance.Footnote 19
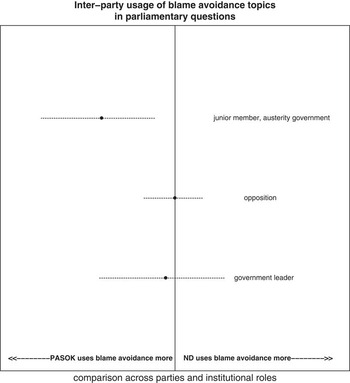
To statistically test the partisan blame avoidance hypothesis, I aggregate the two topics previously discussed into one blame avoidance topic. As suggested by Monroe et al. (Reference Monroe, Rice and Tzelgov2008) and Lowe et al. (Reference Lowe, Benoit, Mikhaylov and Laver2011), in order to compare across parties, I first calculate the odds of using blame avoidance for each party and institutional role. Then, I compute the log of the odds ratio across the two parties, conditional on their institutional role. The results are presented in Figure 3. The figure provides evidence that left-right ideology affects the use of blame avoidance tactics. The difference between parties is large and statistically significant when I compare parties’ behavior during periods when they serve as junior members in austerity governments. Specifically, for each blame avoidance question asked by an ND member of parliament, the average PASOK member asks 2.5. In contrast, when I compare the behavior during periods of other institutional roles (i.e. as opposition members or as leaders of governments), I find that there is essentially no difference in the log odds of using blame avoidance between the parties, as the point estimates (or the confidence intervals) cross the zero point.Footnote 20
Log odds ratio of blame avoidance questions, Panhellenic Socialist Movement (PASOK) relative to New Democracy (ND). Comparison between PASOK and ND usage of the blame avoidance topic. Points represent the log odds ratio across the two parties. Horizontal lines represent 90% confidence intervals. A vertical line is plotted at 0 (i.e. no difference across parties).

As various sources of data have consistently placed PASOK to the left of the conservative ND on economic issues (Baker et al., Reference Baker, de Vries, Edwards, Hooghe, Jolly, Marks, Polk, Rovny, Steenbergen and Vachudova2015; Gemenis and Nezi, 2012; Gemenis and Triga, Reference Gemenis and Nezi2012), the analysis summarized in Figure 3 demonstrates how important the role of economic left-right ideology is in influencing blame avoidance PQ behavior. Serving as junior members of unpopular austerity governments, socialist MPs from PASOK are significantly more likely to bring up blame avoidance issues in their PQs than their conservative peers are. However, as members of the opposition or as leaders of governments, there is no difference between the parties.
Conclusion
The article makes a number of contributions. First, by studying austerity coalitions as an exemplar of unpopular coalitions, I argue that in general, we should observe oppositional behavior within such governments. The results of the analysis demonstrate that although thus far almost unnoticed, PQs are part and parcel of the monitoring mechanisms junior coalition parties use. In particular, I find that in unpopular austerity coalitions, junior coalition parties use these measures to a degree that rivals opposition parties, and at times exceeds them. This finding is important not only because it adds to the coalition-monitoring literature by extending the coalition-monitoring ‘toolbox’ (Thies, Reference Thies2001; Martin and Vanberg, Reference Martin and Vanberg2004, Reference Martin and Vanberg2005, Reference Martin and Vanberg2008; Lipsmeyer and Pierce, Reference Lipsmeyer and Pierce2011; Carrol and Cox, Reference Carrol and Cox2012; Indridason and Kristinsson, Reference Indridason and Kristinsson2013), but also because it shows that oppositional behavior exists within the coalition. This ‘intra-coalition opposition’ phenomenon is an important aspect of coalition politics, and thus, further research should identify the reasons for this oppositional behavior and the exact conditions that lead to it. Moreover, studying ‘intra-coalition opposition’ can have implications on the way we see the government–opposition relationship in parliamentary democracies.
Second, the analysis reveals a nuanced aspect of ‘intra-coalition opposition’, relevant to the politics of austerity and blame avoidance (Weaver, Reference Weaver1986; Pierson, Reference Pierson1996; Giger and Nelson, Reference Giger and Nelson2011; Schumacher et al., Reference Schumacher, Vis and van Kersbergen2013). Specifically, while both right- and left-leaning parties increase their use of PQs when they serve as junior members in unpopular austerity coalitions, I find that during austerity, this effect is stronger for left-leaning parties. A new method of text analysis is utilized to classify the questions into topics, in order to test whether left-right economic ideology affects the use of PQs. The analysis demonstrates that the socialist PASOK uses its PQs in order to avoid or minimize the blame that its voters associate with its membership in the austerity coalition, while the conservative ND does not. Put differently, while both parties behave in an oppositional way because they are part of an unpopular government, the Socialists strategically choose to use their PQs for blame avoidance purposes. This finding provides additional support for recent studies of parties’ blame avoidance behavior (Giger and Nelson, Reference Giger and Nelson2011; Jensen and Mortensen, Reference Jensen and Mortensen2014) that focus on their electoral prospects after austerity, but not on their legislative behavior.
Overall, the case of Greece provides an impetus for further research into the delicate balancing act faced by coalition members, especially when the coalition is unpopular, and future elections loom large in parties’ calculations. In addition, the Greek case highlights the high degree to which context and party ideology matter in studying ‘intra-coalition opposition’. As this research has shown, austerity politics is more dangerous for left-leaning parties and leads to a greater degree of dissent from the left, but intra-coalition dissent depends on the type of policies pursued by the government, and in turn, on the electoral considerations of forward-looking coalition members.
Acknowledgments
This work was supported by the National Science Foundation under Grant Nos. SES-1024190, SES-0924260, BCS-0714688, and OCI-0821527. The author thank Burt Monroe, Sona Golder, and the participants of the Quality of Government 2013 Annual Meeting for their comments. The author also thank Periklis Papadopoulos for his excellent research assistance. Finally, The author thank the anonymous reviews and the editors.
Supplementary Material
To view supplementary material for this article, please visit http://dx.doi.org/10.1017/S1755773915000284