

The study of mood disorders after stroke has largely focused on depression, which is the most common emotional consequence of stroke (Carod-Artal, Reference Carod-Artal2006; Dafer, Rao, Shareef, & Sharma, Reference Dafer, Rao, Shareef and Sharma2008). A recent meta-analysis of 61 cohorts (N = 24,488 patients) reports that 31% of patients developed depression within 5 years after stroke (Hackett & Pickles, Reference Hackett and Pickles2014). This is similar to an earlier meta-analysis (Ayerbe, Ayis, & Wolfe, Reference Ayerbe, Ayis and Wolfe2013) of 43 studies (N = 20,293) that reported a 29% pooled prevalence of post-stroke depression (PSD). The prevalence of PSD across various settings (i.e., community, hospital and outpatient) is lower, ranging from 14% to 24%, when structured diagnostic interviews are used, as opposed to symptom rating scales (Robinson & Jorge, Reference Robinson and Jorge2016). Longitudinal work in the area suggests differing predictors of PSD at different time frames post stroke (Åstrom, Adolfsson, & Asplund, Reference Åstrom, Adolfsson and Asplund1993; Whyte & Mulsant, Reference Whyte and Mulsant2002{Robinson, 1984, #1074}).
Anxiety is also a common emotional symptom following stroke, though it is much less studied in general, and longitudinal studies of its presence are absent (Angelelli et al., Reference Angelelli, Paolucci, Bivona, Piccardi, Ciurli and Cantagallo2004; Barker-Collo, Reference Barker-Collo2007). Most studies report a prevalence of post-stroke anxiety (PSA) as being similar to or slightly lower than that of PSD (Barker-Collo, Reference Barker-Collo2007). However, one large analysis (N = 4079) reported symptoms suggestive of probable PSA in 29% of patients, as compared to PSD in 24% of the sample (Broomfield, Quinn, Abdul-Rahim, Walters, & Evans, Reference Broomfield, Quinn, Abdul-Rahim, Walters and Evans2014).
A number of risk factors for PSD and PSA have been described in the literature including socio-demographic factors (i.e., female gender, age), stroke specific factors (i.e., increased stroke severity) and prior history of mood disorder (Barker-Collo, Reference Barker-Collo2007; Broomfield et al., Reference Broomfield, Quinn, Abdul-Rahim, Walters and Evans2014; De Ryck, Brouns, & Geurden, Reference De Ryck, Brouns and Geurden2014; Johnson, Minarik, & Nystrom, Reference Johnson, Minarik and Nystrom2006; Kutlubaev & Hackett, Reference Kutlubaev and Hackett2014). Although various factors have been reported to be associated with PSD, the results have been inconsistent. A recent systematic review included 23 studies with 18,374 participants, and reported that demographic characteristics (age and sex) were not consistently associated with PSD (Kutlubaev & Hackett, Reference Kutlubaev and Hackett2014). There was also no consistent association between hemisphere of stroke, lesion location, or stroke pathological subtype, and depression. A history of depression before stroke was associated with PSD in four of seven studies. Based on the literature, the most consistent factors associated with PSD are severe stroke, and early or late physical disability. For example, in a recent study (Kim et al., Reference Kim, Lee, Chang, Park, Ahn, Cha and EMOTION investigators2017), depression scores were well-correlated with improvements in neurological impairment.
In a recent review, it was reported that PSA is closely associated with PSD, with early studies proposing that PSA with PSD is associated with left hemisphere cortical infarcts, while following right hemispheric strokes, PSA without PSD is associated with posterior infarcts (Campbell Burton et al., Reference Campbell Burton, Murray, Holmes, Astin, Greenwood and Knapp2010). However, a recent meta-analysis (Campbell Burton et al., Reference Campbell Burton, Murray, Holmes, Astin, Greenwood and Knapp2010) showed that there is no association between PSA and lesion location, nor was it associated with age or sex. Thus, the factors associated with anxiety in patients with stroke without PSD remain unknown (Kim, Reference Kim2016).
Stroke populations are heterogeneous and descriptions of patterns of mood in large populations remain of value, particularly when examined over time (Broomfield et al., Reference Broomfield, Quinn, Abdul-Rahim, Walters and Evans2014). A better understanding of factors that increase risk of depression and anxiety after stroke could further help inform research and the targeting of preventive efforts and management. The purpose of this study was to describe the prevalence of depression and anxiety symptoms across the first year following ischemic stroke, and to examine the impact of socio-demographic, stroke and baseline mood factors that predict ongoing symptoms.
Methods
Patients with ischemic stroke and who had been enrolled in the ARCOS-IV study were eligible for inclusion. ARCOS-IV was a prospective population-based study of stroke incidence, prevalence and outcomes in the Auckland region of New Zealand from 2011–2012 (Krishnamurthi et al., Reference Krishnamurthi, Jones, Barber, Barker-Collo, McPherson and Bennett2014). The methods are described in detail elsewhere (Krishnamurthi et al., Reference Krishnamurthi, Jones, Barber, Barker-Collo, McPherson and Bennett2014). Briefly, this study included all incident strokes in residents of the Auckland Region aged ≥16 years. Complete case ascertainment was assured by multiple overlapping sources of information on all new hospitalised or non-hospitalised cases (‘hot pursuit’ method). Daily searches were made of admissions data for all public hospitals, with weekly checks of hospital discharge and outpatient clinic data. Regular checks of private hospitals, rest homes and community health services were conducted. New Zealand Health Information Systems data of all fatal and non-fatal stroke cases in the study population (‘cold-pursuit’ methods) were also examined. Residents meeting the inclusion criteria but with stroke that occurred outside the Auckland Region were also included.
Stroke was defined according to the WHO classification (Aho and colleagues, Reference Aho, Harmsen, Hatano, Marquardsen, Smirnov and Strasser1980). A diagnostic review committee comprising four stroke physicians met fortnightly to confirm the diagnosis and classification of all stroke cases. The committee used medical history, hospital discharge summaries, clinical and laboratory findings (including vascular and cardiac imaging) or necropsy results when available. Cases without imaging or pathological necropsy confirmation of subtype were classified as stroke of undetermined type.
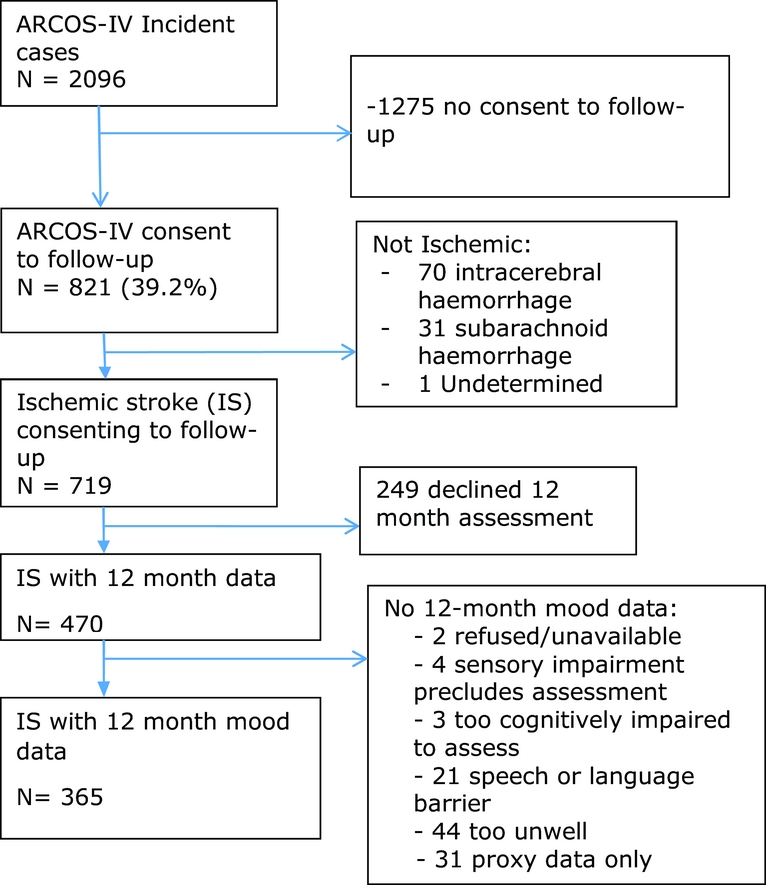
These analyses included all ARCOS-IV cases who (1) provided written informed consent; and (2) had outcome data from 12-month assessment. Figure 1 shows selection of cases for these analyses.
Study recruitment summary.

As can be seen in Figure 1, the majority of consenting individuals who did not complete the 12-month assessment declined to participate in that assessment. In addition, some individuals were excluded due to sensory deficits (N = 4) or cognitive deficits (N = 3) which precluding their participation in the assessment, whilst 21 individuals had speech/language deficits precluding assessment, 44 were medically too unwell and there were 31 individuals who were too unwell to participate and for whom only proxy data was available.
Each assessment took 2 hours to complete, and was conducted face-to-face by a trained research assistant in hospital or participants’ primary place of residence. Assessments occurred at baseline (within 2 weeks of stroke), 1-, 6- and 12-months post stroke. The primary reason for selecting self-report measure of depression and anxiety for this study was practicality. With an incidence sample of 2132 strokes and assessment potentially occurring at four time points for each individual, it was just not possible to fund administration of structured interviews. Also considered was the potential burden of completing a 14-item questionnaire when compared to the potential for a lengthy structured interview. The greatest pitfall of self-report methodology is its reliance on accurate reporting from participants which can be negatively impacted by factors such as their understanding of the items, ability to introspect, image management and response bias. However, as noted below, the measures selected have good indications for both reliability and validity which increases our confidence in their use.
Assessments
Depression and anxiety were assessed using the Hospital Anxiety and Depression Scale (HADS) (Zigmond and Snaith, Reference Zigmond and Snaith1983). The HADS contains 14 statements (e.g., I have lost interest in things); seven relating to anxiety and seven to depression. Prior to completing the scale, patients are asked to complete it to reflect how they ‘. . .have been feeling during the past week’ (Zigmond and Snaith, Reference Zigmond and Snaith1983) (p. 366). For each statement, the participant chooses one of four responses (e.g., ‘definitely as much’, ‘not quite as much’, ‘only a little’, ‘hardly at all’) considering the last week. In this study, a cut-off score of >7 was used for identifying symptoms outside the normal range (caseness), as a systematic review identified this as having specificity and sensitivity for depression (0.79 and 0.83, respectively); and for anxiety (0.78 and 0.90)(Bjelland, Dahl, Haug, & Neckelmann, Reference Bjelland, Dahl, Haug and Neckelmann2002). Scores for each subscale (anxiety and depression) range from 0 to 21 with scores categorised as follows: normal 0–7, mild 8–10 and moderate to severe 11 and over (Zigmond and Snaith, Reference Zigmond and Snaith1983).
Barthel Index (BI) (Granger, Dewis, Peters, Sherwood, & Barrett, Reference Granger, Dewis, Peters, Sherwood and Barrett1979). The BI, often used as an indicator of stroke severity, assesses ability to perform 10 activities of daily living (ADL) associated with personal care (e.g., feeding, bathing) and mobility (e.g., chair/bed transfers). The BI takes up to 10 minutes to complete, and maximum score (20) indicates full independence. The BI is sensitive to minimal, yet clinically significant changes in physical functioning (Hsueh, Lin, Jeng, & Hsieh, Reference Hsueh, Lin, Jeng and Hsieh2002). Its test–retest and inter-rater reliability are high (weighted κ = 0.98; and ≥0.88, respectively) (Wolfe, Taub, Woodrow, & Burney, Reference Wolfe, Taub, Woodrow and Burney1991). Compared to other measures of disability, the BI demonstrates high construct validity (r ≥ .92) (Hsueh et al., Reference Hsueh, Lin, Jeng and Hsieh2002). Acute BI scores are related to post-stroke recovery (Huybrechts & Caro, Reference Huybrechts and Caro2007).
Activity restrictions, which have also been linked to PSD, were evaluated by the Modified Rankin Scale (MRS), a commonly used scale for measuring the degree of disability or dependence in the daily activities of people who have suffered a stroke or other causes of neurological disability (Wilson et al., Reference Wilson, Hareendran, Grant, Baird, Schulz, Muir and Bone2002). The MRS is used to categorise level of functional independence with reference to pre-stroke activities rather than on observed performance of a specific task. Scores range from 0 (No symptoms at all) to 5 (Severe disability; bedridden, incontinent and requiring constant nursing care and attention).
Analyses
Descriptive demographic information is presented for the ARCOS-IV cohort who did and did not consent to follow-up assessments. Parametric and non-parametric tests were used as appropriate to compare these groups to ensure our sample could be considered representative.
Performance across HADS item and total scores at each time point are presented as means and standard deviations to allow examination of absolute levels of anxious/depressed symptoms. Within subject change from baseline to 1-month, 1- to 6-months and 6- to 12-months post stroke for each HADS items and total score is examined using within subject repeated measures ANOVA. The proportion meeting and not meeting the cut-off for probable caseness (≥7) on HADS anxiety and depression subscales is also presented.
Regression analyses were then performed to determine if baseline demographic (age, education) and stroke-related factors (stroke severity) and baseline mood were predictive of either depressive or anxious symptomatology (HADS scale scores) at 6- and 12-months post stroke. For all analyses, cases with missing data were excluded listwise. Standardised beta coefficients are presented. These refer to how many standard deviations a dependent variable will change, per standard deviation increase in the predictor variable, which allows determination of which independent variable has a greater effect on the dependent variable in a multiple regression analysis, when the variables are measured in different units of measurement.
This study was conducted in accordance with the Helsinki Declaration. Ethical approval was obtained from the New Zealand Northern Y Regional Ethics Committee.
Results
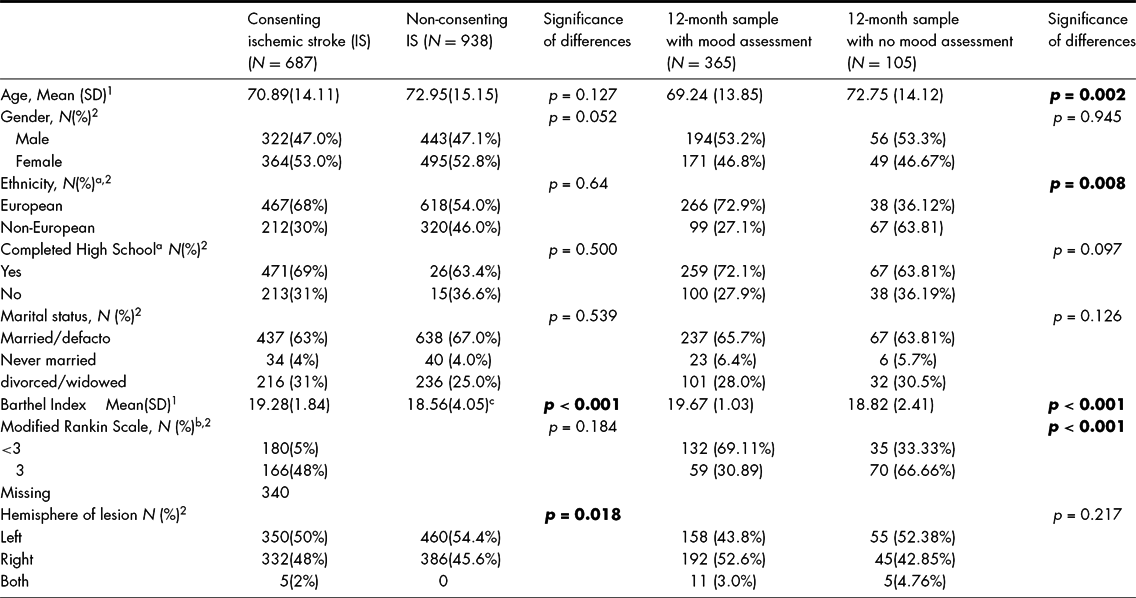
The sample was a subset of 1275 ARCOS-4 participants who consented to follow-ups of whom with ischemic stroke of whom 719 had ischemic stroke (Figure 1). There were 365 ischemic stroke survivors (171 (46.8%) women, mean age 69.24 years (SD = 13.85)) who consented to 12-month follow-up and who had mood assessments at that time (Table 1). The 365 ischemic stroke participants had a greater proportion of right and bilateral hemisphere strokes and had less severe stroke as measured by the BI than those who were not included in these analyses (Table 1). That those with left hemisphere stroke were less likely to participate may have been due to a greater prevalence of aphasia in this group. It should be noted that though this was significant, the absolute difference in BI mean scores between the groups was quite small. Those who consented to follow-up did not differ from those who did not consent in terms of age, gender, ethnicity, completion of high school, marital status or MRS score (p > .05). Those who had 12-month follow-up and completed the mood assessment were younger, more likely to be of European ethnicity, and had less severe stroke than those with follow-up but who did not complete the mood assessment. In describing the clinical picture for those who participated, when first presenting to hospital 47% had facial weakness, 69.7% were experiencing limb weakness, 33.2% were experiencing sensory deficits and 35.4% were experiencing difficulties with speech.
Demographic and Stroke Characteristics of Consenting vs. Non-Consenting Ischemic Stroke (IS) Patients, and of Consenting Participants, those Completing 12-month Assessment vs. those Not Completing

a Variables missing significant data for those not consenting (i.e., data not recorded in medical notes). bMeasures administered at baseline with consenting participants only. cFor non-consenting individuals, only pre-morbid BI was available. 1Comparison made using F statistic. 2Comparison made using chi-square statistic.
Performance on Mood Assessment over Time
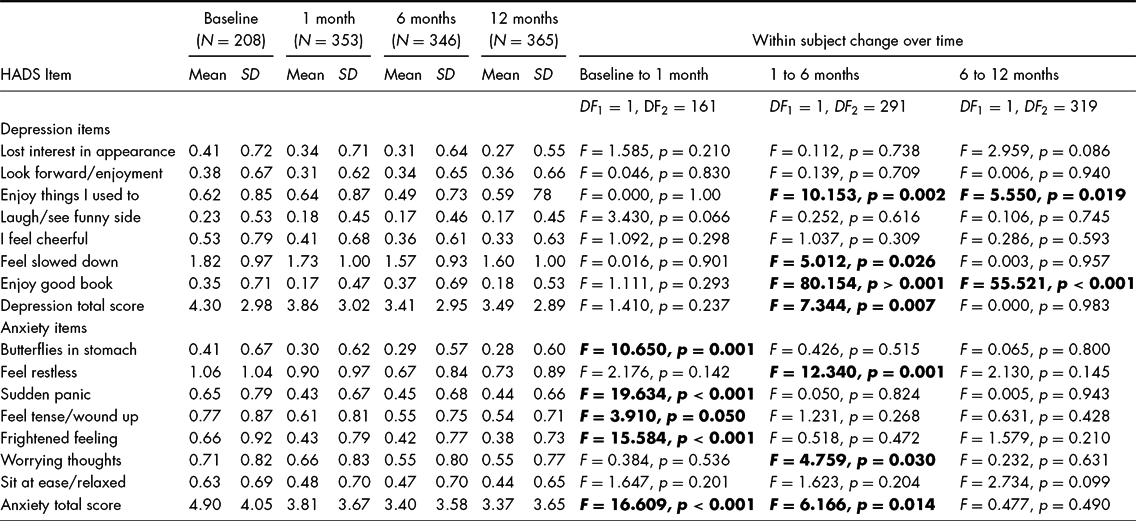
Anxiety and depression symptoms generally improved over time, with the mean score of the sample not exceeding the normal range for either depression or anxiety at any point in time (Table 2). Individual items are examined alongside the total scores as this provides more in depth information on where change is occurring and interpretation of how this is influenced by the timing of these changes. The greatest contributors to overall anxiety scores and overall depression scores at each time of measurement were feeling restless and feeling slowed down, respectively. Both of these symptoms improved significantly from 1 to 6 months. While both could be seen to be a direct consequence of stroke, their improvement may also reflect the timing of this improvement in relation to trajectories for stroke care which see the majority of individuals discharged from hospital and return home and to previous roles within the 1- to 6-month time frame.
Performance on HADS Items at Each Assessment and Significance of Change Between Assessments

Note: Individual item ratings range from 0 to 3, Anxiety and Depression total scores range from 0 to 21. Bold face text is used to highlight significant differences.
The greatest change in anxiety occurred from baseline to 1-month post stroke with a significant reduction in four of seven symptoms but with ongoing improvement for two symptoms until 6 months. In contrast, depression symptoms remained stable over the first month and then improved between 1 and 6 months in three of seven symptoms and on-going improvement in two areas (enjoy things and enjoy a good book) until 12 months.
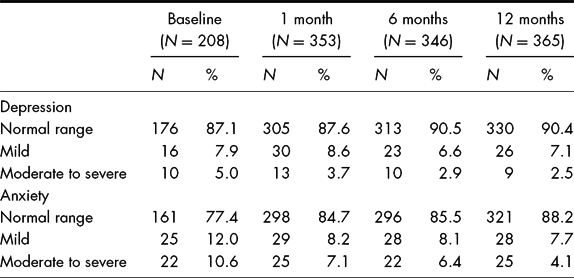
Approximately twice as many individuals had moderate to severe scores, indicating caseness, for anxiety (range 10.6% to 4.1%) as compared to depression (range 5.0% to 2.5%) at each assessment (Table 3). Most participants (>87%) had depression scores within the normal range (total score < 7) throughout the first year post stroke. Most participants (>77%) also had anxiety scores within normal range across assessments. In regards to comorbid caseness for anxiety and depression, these rates were quite low with four, six, three and four individuals meeting caseness criteria for both at baseline, 1, 6 and 12 months, respectively.
Proportion of Participants Meeting HADS Cut-offs for Non-clinical, Mild or Moderate to Severe (i.e., Case) Levels of Depression and Anxiety at Each Assessment

In looking further at trajectories within the data, 395 individuals produced scores below the threshold for ‘caseness’ for anxiety across all assessments. Of the 34 who met the threshold for caseness within the first month post stroke, 18 had a drop in anxiety to within the normal anxiety range by the end of the study, 8 had a drop to the ‘probable anxiety’ range and 8 remained above the cut-off for caseness.
In looking at those whose anxiety increased over time, five individuals had anxiety levels which increased from the normal range to the probable anxiety range, whilst eight had anxiety which increased from the normal range to above the cut-off for caseness. One individual began the study with normal range anxiety which increased to the level of caseness at 6 months post stroke (concomitant with return home), but then returned to the normal range by 12 months.
Alongside this, 416 individuals had scores below the threshold for caseness for depression across all assessments. In regards different trajectories, 15 individual's scores moved from above the caseness threshold to below that threshold across the study; whilst 8 individuals met the threshold for caseness across all assessments. An additional four individuals reported no depression at the start of the study but developed case level depression at 12 months, and the final eight individuals developed caseness at 6 months post stroke, but had below case levels of depression both at the start of the study and at 12 months.
Prediction of Mood Outcomes
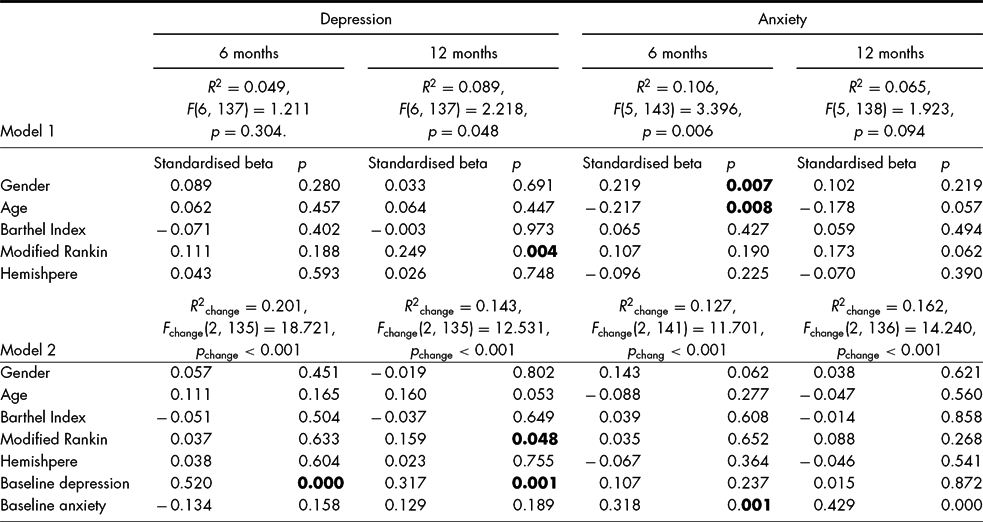
Stepwise linear regression was used to examine the impact of demographic and stroke-related factors (i.e., age, gender, ethnicity, stroke severity (BI), hemisphere of lesion and disability (MRS) at baseline) and baseline anxiety and depression in predicting level of depressed or anxious symptoms at 6 or 12 months post ischemic stroke.
As seen in Table 4, depression scores at 6 months were not significantly predicted from the demographic or stroke-related factors. Once baseline anxiety and depression were added to the equation, prediction of depression was significant. The only factor contributing significantly to prediction of depression at 6 months was baseline depression. In contrast, depression at 12 months was significantly predicted from stroke and demographic factors, with the Modified Rankin predicting depressive outcome. When baseline anxiety and depression were added into the equation, prediction of depression was significantly improved. Contributing to prediction of depression at 12 months were baseline Modified ranking score and depression.
Summary of Regression Analysis Findings

Demographic and stroke characteristics together predicted anxiety scores at 6 months post ischemic stroke; with female gender, and younger age predictive of increased anxiety at 6 months. When baseline anxiety and depression were entered into the equation, prediction of anxiety at 6 months improved. The only factor significantly contributing to prediction of anxiety at 6 months was HADS anxiety at baseline. That demographic characteristics were no longer predictive likely reflects that these demographics variable share variance with baseline anxiety (correlations between baseline anxiety and age r = −.3528, p < .001; and with gender rho = .109, p = .004), but share less unique variance with 6-month anxiety.
Anxiety scores at 12 months were not predicted by demographic- and stroke-related factors alone. However, when baseline anxiety and depression were added to the equation, anxiety at 12 months could be predicted, with anxiety at baseline significantly contributing to prediction.
Discussion
The greatest proportion of individuals did not experience depression or anxiety across the year post stroke. While depression is the most commonly studied mood disorder following stroke, approximately twice as many individuals produced moderate to severe scores for anxiety (range 4.1% to 10.6%) compared to depression (range 2.5% to 5.0%) at each assessment. These prevalence rates are much lower than that previously reported (Barker-Collo, Reference Barker-Collo2007; Broomfield et al., Reference Broomfield, Quinn, Abdul-Rahim, Walters and Evans2014).
There are two possible reasons for the lower rates presented here. First, the population-based nature of the sample is likely to have resulted in a greater range of outcomes. Second, people who completed the follow-up mood assessments had a lower risk of mood disorders due to younger age (Health, Reference Health2013), being more likely to be European (Health, Reference Health2013; Sachdev, Reference Sachdev1989), and also due to less severe stroke (Hackett & Anderson, Reference Hackett and Anderson2014), when compared to those who did not complete the assessment. Further, use of different measurement tools/methods may have contributed. For example, the HADS does not include items which reflect the more physiological aspects of depression (e.g., changes in sleep, psychomotor retardation, weight, etc.), and therefore may have resulted in lower rates of depression being identified. Correct attribution of such somatic symptoms to either PSD or stroke is a very relevant problem, because such symptoms may affect rating scales and diagnostic criteria which were designed to measure depression severity in primary depressive illness, rather than to diagnose depression in comorbidity; as is the case here. Similarly, the exclusion of participants who were identified as too medically unwell (e.g., those with comorbid diagnoses of cancer) may have resulted in exclusion of those who were more likely to be suffering from anxiety and/or depression.
It should also be noted that a large number of individuals in the incidence sample did not participate in the follow-up assessment. Those who did participate had a greater proportion of right and bilateral hemisphere strokes and had less severe stroke than those who were not included in these analyses, and this may also have been reflected in the lower prevalence of depression and anxiety. Despite an abundant literature, it is still difficult to define the real prevalence rate of PSD, essentially because of the weak concordance across studies. This variability arises from methodological problems of the investigations (differences in study populations and the timing of assessments), but also from the complexity in recognition, assessment and diagnosis of depression.
Recent studies confirmed that PSD is generally observed in nearly one-third of cases (Lindén, Blomstrand, & Skoog, Reference Lindén, Blomstrand and Skoog2007; Paolucci et al., Reference Paolucci, Bragoni, Coiro, De, Fusco, Morelli and Pratesi2006; Townend et al., Reference Townend, Whyte, Desborough, Crimmins, Markus, Levi and Sturm2007; Vataja et al., Reference Vataja, Leppävuori, Pohjasvaara, Mäntylä, Aronen, Salonen and Erkinjuntti2004; Verdelho, Henon, & Lebert, Reference Verdelho, Henon and Lebert2004). However, a certain degree of variability in the percentages is observed in these reports. For example, the percentage of depression observed in the Sidney Stroke Study was lower than in the previous ones (Brodaty, Withall, & Sachdev, Reference Brodaty, Withall and Sachdev2007). Moreover, recent longitudinal studies report that PSD increases in prevalence over the initial 3 months from stroke, despite an improvement in disability (Aben et al., Reference Aben, Verhey, Strik, Lousberg, Lodder and Honig2003; Paolucci et al., Reference Paolucci, Bragoni, Coiro, De, Fusco, Morelli and Pratesi2006); but also that patients with early onset PSD are not necessarily affected later and vice versa, indicating the dynamic nature of PSD in the early stages; a finding replicated here by the varying trajectories found for both depression and anxiety.
The finding that mood symptoms generally improved over time is consistent with earlier studies. However, the timing of this change differed between anxiety and depression symptoms. The greatest improvement in anxiety symptoms occurred from baseline to 1-month post stroke. In contrast, improvement in depression symptoms was most evident from 1- to 6-months post-stroke. This difference in trajectory makes intuitive sense. One would expect to experience anxiety early after stroke when confronted with one's own mortality, the need for acute medical intervention, and potential for life change. As the medical crisis abates, anxiety can then be expected to reduce. Depression, by contrast, is likely to develop over a period of time with increasing awareness of changes in abilities and coming to terms with changes in life roles; and can then be expected to abate with functional improvement, return to community living, and learning to accommodate any persisting changes. This suggests a need to clarify those interventions that are best suited to treating depression and anxiety in this client group (Hackett, Anderson, House, & Xia, Reference Hackett, Anderson, House and Xia2008), and further suggests the need to target therapeutic interventions at different time points for anxiety and depression.
In regards to the prediction of 12-month mood outcomes, we explored whether demographic (e.g., age, gender) and stroke-related factors (i.e., stroke severity) and baseline mood could predicting who was depressed or anxious at 6- and 12-months post stroke. Depression at 6- and 12-months was predicted by baseline depression; while anxiety at 6- and 12-months was predicted by baseline anxiety. Thus, mood within the first 2 weeks of stroke is the most important factor in predicting later mood disturbances, which is consistent with the previous research (Schepers et al., Reference Schepers, Post, Visser-Meily, van de Port, Akhmouch and Lindeman2009). This suggests the need to screen for anxiety and depression within the first 2 weeks following stroke to identify those at greatest risk who should then be subject to further monitoring as well as provision of interventions for mood.
Depression at 12 months was also predicted from level of disability (Modified Rankin), when only demographic/stroke variables were entered, and was predicted from both disability and baseline depression at 12 months. Having worse scores on the Rankin reflects a more severe disability after stroke. It is possible that more acute depression (at 6 months) is less impacted by stroke severity as during this time frame individuals are likely to be experiencing continued recovery. Upon reaching 12 months post stroke, recovery is likely to have slowed considerably if not stopped all together, and therefore level of initial disability (and therefore likely level of continued disability) may be more likely to come into play.
An essential component of stroke service delivery should be ongoing monitoring and assessment of psychological status. Depression is often undetected in primary care and hospital settings (Simon & VonKorff, Reference Simon and VonKorff1995), and it is likely that other psychological distress may go similarly undetected. Although screening for mood disturbance is often advocated, there is conflicting evidence regarding the benefit of screening and case finding for depression (Gilbody, Sheldon, & House, Reference Gilbody, Sheldon and House2008). However, given that risk of depression and anxiety are heightened after stroke, the use of case finding cannot be easily dismissed. While mood is often assessed in the early stages following stroke, this study suggests that longer term surveillance and interventions may be necessary to facilitate recovery from and to prevent depression. Longer term, less-intensive, community-based services that include mood screening may be beneficial but this requires further research.
This study has a number of limitations to be considered. In regards to generalisability, those who consented to follow-up assessments had a significantly greater proportion of right and bilateral hemisphere strokes, and also had significantly less severe stroke (BI) than those who did not consent. Information on mood prior to stroke was also not available. Of consenters, those who completed the 12-month mood assessment were younger, significantly more likely to be of European ethnicity, and had less severe stroke (BI and MRS). Thus, the present findings may not be generalisable to those with left hemisphere stroke, those with more severe stroke, or those of non-European ethnicity. In addition, pre-stroke mood was not assessed, thus it is not possible to say whether PSA and depression identified here were new concerns or a continuation of prior mood issues. This is an important factor and should be included in future efforts to predict later mood issues.
Conclusion
Prevalence of anxiety and depression in this sample were much lower than suggested by the literature, likely reflecting the population-based sample or a bias in the sample completing the 12-month assessments. That depression reduced later than anxiety is indicative of the need to target anxiety early in the recovery process, whilst depression is likely to require longer term monitoring and intervention.
Financial Support
This work was supported by the New Zealand Health Research Council (grant number 15–570).
Conflict of Interest
None.
Ethical Standards
The authors assert that all procedures contributing to this work comply with the ethical standards of the relevant national and institutional committees on human experimentation and with the Helsinki Declaration of 1975, as revised in 2008.