I. INTRODUCTION
Metallic glasses are a particular class of alloys whose solid phase structure is amorphous, i.e., with no long-range crystalline order, grain boundaries, or crystal defects. Hence, these materials exhibit unique mechanical and thermophysical properties. The structural characteristics and mechanical properties of these materials are still topics of great relevance, and many studies involving atomistic simulation and experimental measurements have been conducted to elucidate their behavior.Reference Miracle1–Reference Yan, Kohara, Wang, Nogita, Schaffer and Qian5
The first metallic glasses, which were developed about 50 years ago, required very high cooling rates (106 K/s) during solidification to prevent crystallization. Therefore, those studies were limited to very thin ribbons or wires. However, over the last few decades, technological advances have enabled the production of bulk metallic glasses (BMGs) of several millimeter or even centimeter in lateral size, leading to renewed interest in this class of material and allowing mechanical testing to be performed in a much wider range of loading conditions.
Although many properties of BMGs are still under active investigation, the unique combination of various properties that are characteristic of these alloys has already made them suitable for many applications ranging from sporting equipment to microelectromechanical systems.
The mechanical properties of metallic glasses have been studied for many years. Due to the lack of the crystalline structure, and hence, the absence of dislocation movement, a deformation model for metallic glasses was proposed by SpaepenReference Spaepen6 based on the concept of free volume adapted from previous works on liquids, polymers, and glasses. Since then, several studies suggest that different levels of free volume lead to differences in the resulting mechanical behavior. For instance, recent reports indicate that metallic glasses in the form of thin ribbons show considerable bending ductility without failure, whereas thicker sizes fail catastrophically, suggesting the strong effect of size on bending ductility.Reference Volkert, Donohue and Spaepen7
Other studies have shown the importance of the free volume in determining the response of the plastic flow of BMGs.Reference Yoo, Park, Lee, Ramamurty and Jang8 In the past few years, nanoindentation has become widely used to investigate the shear band induced plasticity of several Pd-, Pt-, Ce-, Zr-, La-, Nd-, Mg-, Cu-, Ce-, and Ni-based metallic glasses.Reference Wright, Saha and Nix9–Reference Santos, Sort, Fornell, Baro, Suriñach, Bolfarini, Botta and Kiminami18
Although hardness determined by nanoindentation depends on the loading rate and maximum applied load,Reference Concustell, Sort, Alcala, Mato, Gebert, Eckert and Baro17,Reference Peng, Zhang, Liu, Li and We19,Reference Van Steenberge, Sort, Concustell, Das, Scudino, Suriñach, Eckert and Baró20 it is possible to distinguish between different BMG families, depending on the observed range of hardnesses. Rare earth and Mg-based BMGs, for instance, show hardnesses ranging from 1 to 3.5 GPa; Pt-, Pd-, Cu-, and Zr-based BMGs exhibit hardnesses of 6–10 GPa; and Co-, Fe-, and Ni-based BMGs show the highest values, ranging from 13 to 17.5 GPa. Predictions based on Ashby and GreerReference Ashby and Greer21 maps usually show a correlation between hardness (or yield stress) and Young's modulus.
Depending on the testing conditions,Reference Greer, Castellero, Madge, Walker and Wilde22 it is also common to observe discrete displacement bursts (pop-ins or serrated flow) in the loading part of load–depth curves. The nature of such serrated flows depends on the composition and structure of BMGs, and the strain rate and temperature applied during nanoindentation measurements. Schuh et al.Reference Schuh and Nieh10,Reference Schuh, Lund and Nieh11 found that serrated flow is strongly dependent on the indentation strain rate, with lower rates promoting more prominent serrations or displacement bursts. However, Ashby and GreerReference Ashby and Greer21 argued that the absence of pop-in events on load–displacement curves may simply be the result of insufficient instrumental resolution at high strain rates.
More recent studiesReference Van Steenberge, Sort, Concustell, Das, Scudino, Suriñach, Eckert and Baró20,Reference Jang, Yoo and Kim23 have shown that there is a relationship between indentation speed and pop-in events: slow indentations promote pop-in events, whereas more rapid indentations can partially or even completely suppress the appearance of such serrations. Li et al.Reference Li, Wei, Zhang, Xing, Zhang and Wang24 found that the most prominent serrated flow appears at low strain rates and only in the T/T g range from about 0.5 to 0.75, whereas a moderate serrated flow takes place at low strain rates in the T/T g range from 0.4 to 0.5. In the very high T/T g (>0.8) or very low T/T g (<0.35) range, serration does not occur at any strain rate.
Ramamurty et al.Reference Ramamurty, Jana, Kawamura and Chattopadhyay25,Reference Murali and Ramamurty26 demonstrated that reducing the free volume content decreases the density of shear bands in deformed zones. Thus, it is necessary to determine the importance of free volume to the mechanical characteristics of different amorphous metallic samples.
In this paper, we report on the mechanical behavior, measured by nanoindentation under a low deformation rate, of a new glassy alloy, Ni60Nb37B3, processed by both melt spinning and copper mold casting.
II. EXPERIMENTAL PROCEDURE
The Ni60Nb37B3 metallic glass composition was designed based on the λ-criterion combined with the difference in electronegativity among the elements.Reference de Oliveira, Pereira, Bolfarini, Kiminami and Botta27–Reference Santos, Kiminami, Bolfarini, de Oliveira and Botta29 The λ-criterion was used to calculate minimum topological instability maps that indicate the compositions in which topological instability reaches the maximum among the surrounding crystalline phases and which are therefore expected to show better glass forming ability. This criterion was also combined with the difference in electronegativity among the elements (Δe) in each particular composition, which is assumed to be related to the formation enthalpy (ΔH) and glass stability of the corresponding alloy.Reference Kiminami, Sá Lisboa, de Oliveira, Bolfarini and Botta28Figure 1 shows the minimum λ × Δe map for the ternary Nb–Ni–B system. Considering the synergic effect of topological and thermodynamic factors, the white regions in Fig. 1 represent compositions with higher glass forming ability. The Ni60Nb37B3 alloy composition was chosen because it is located in a white area in the minimum λ × Δe map.
Synergic effect of topological and chemical factors (λ × Δe) on the Ni–Nb–B ternary system.

Alloy ingots were prepared by arc-melting high purity constituent elements, Ni (99.99%), Nb (99.8%), and B (99.5%) in a Ti-gettered high purity argon atmosphere. The ingots were remelted four times to ensure chemical homogenization, after which they were induction melted in a high purity argon atmosphere in a quartz tube and injected through a nozzle onto a Cu wheel to produce rapidly solidified ribbons by melt spinning. In addition, a 1-mm bulk sheet sample of the alloy was prepared (hereinafter referred to as BMG sample) by copper mold suction casting in a high purity argon atmosphere.
The structure of the specimens was examined by x-ray diffraction (XRD), using Cu Kα radiation, in step-scan mode with a step width of 0.035° and a sampling time of 7 s per step, and by scanning electron microscopy (SEM) using backscattered electron (BSE) emission. The thermal behavior was examined using a differential scanning calorimeter, applying a heating rate of 40 K/min under an Ar flow.
The mechanical properties (hardness and reduced elastic modulus) of the ribbon and sheet samples were evaluated by nanoindentation at room temperature in the load control mode, using a UMIS indenter (Fischer–Cripps Laboratories, New South Wales, Australia) equipped with a Berkovich pyramidal diamond tip. The sheet sample was subjected to macroscopic compression experiments at room temperature, applying a constant strain rate of 1 mm/s.
Both test specimens were mounted in polyester resin, and the indentations were performed along the cross-section. Prior to indentation, the samples were polished with a diamond paste to a mirror-like appearance, using down to 1-μm diamond particles. In most of the experiments, the indentation function consisted of a loading step of 55 s to a maximum force of 10 mN, followed by a load holding step of 30 s and an unloading step of 50 s. Nanoindentation experiments using higher applied loads (up to 500 mN) were performed on the bulk Ni–Nb–B glassy alloy. To minimize thermal drift, the experimental setup, including nanoindenter and sample, were protected from possible air currents and thermal fluxes by a methacrylate cover and allowed to stabilize for 1 h before beginning the tests. With these precautions, the thermal drift at the beginning of the indentation tests was found to be lower than 0.05 nm/s. Proper corrections were made of the contact area (calibrated with a fused quartz specimen), instrument compliance, and initial penetration depth. The results presented here represent the average of a total of at least 25 indentations on each sample. The hardness (H) and reduced elastic modulus (E r) values were derived from the load–displacement curves at the beginning of the unloading step, using the method of Oliver and Parr.Reference Oliver and Pharr30 Specifically, the unloading parts of the P–h curves were fitted using a power law, as shown in the Oliver–Pharr analysis.
III. RESULTS AND DISCUSSION
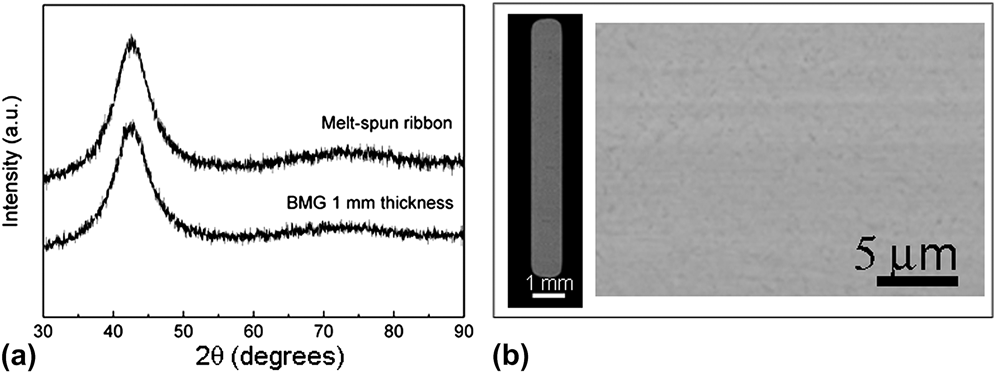
Figure 2(a) shows XRD patterns of the melt-spun ribbon and the BMG sample. Both patterns exhibit broad diffraction maxima at around 2θ ≈ 40°, indicating that the samples possess a single amorphous phase. The absence of crystalline phases in the BMG sample (at least on the micrometer scale) was also suggested by the BSE SEM micrographs shown in Fig. 2(b).
(a) XRD patterns of the melt-spun ribbon and BMG samples of the Ni–Nb–B glassy alloy. (b) BSE-SEM micrographs of the BMG sample.
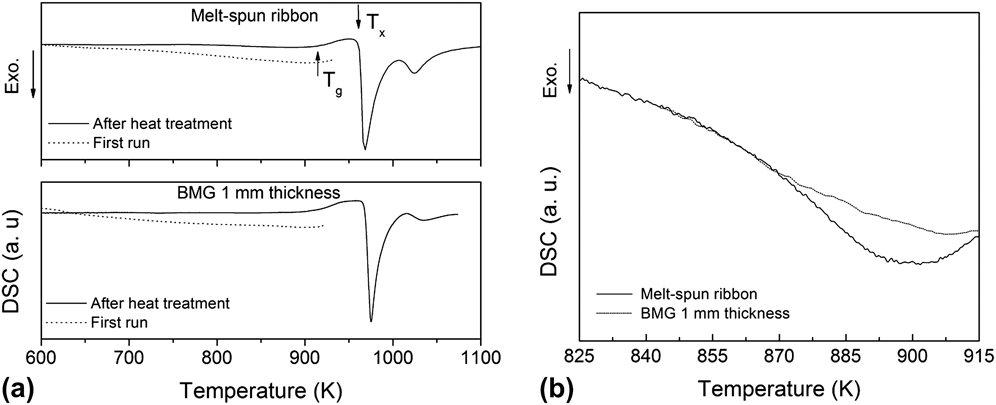
Figure 3(a) shows the differential scanning calorimetry (DSC) curves of the melt-spun and the BMG sample. The two curves are very similar, and both show a clear glass transition temperature, T g, which is not frequently reported in Ni-based alloys.Reference Kühn, Gebert, Gemming, Zinkevich, Wendrock and Schultz31 The difference in the relaxation behavior of the ribbon and the BMG sample, and therefore in free volume, is visible in the expanded region around T g (850–920 K), which is shown in Fig. 3(b). This difference is justified by the higher cooling rate of ribbon processed by melt spinning than in the casting process of the BMG sheet. The crystallization onset temperature, T x, which is indicated in the curve corresponding to the ribbon, is also the same in the two types of samples.
(a) DSC curves of the melt-spun ribbon and BMG samples of the Ni–Nb–B glassy alloy subjected to a heating rate of 40 K/min. (b) A comparison of the DSC signal between the ribbon and the sheet indicates the differences in free volume of the two samples.
On the other hand, the crystallization enthalpy decreases from 62.2 to 57.3 J/g as the sample's thickness increases from 30 μm (ribbon) to 1 mm (sheet). This tendency is mainly due to the structural differences between the two samples. The BMG sample is likely to contain a higher degree of short-range and medium-range ordering or even nanocrystals, which strongly influence the thermal and mechanical properties of metallic glass.
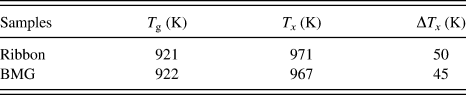
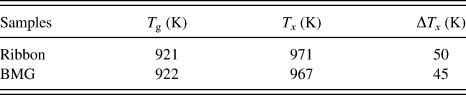
Table I shows the values of T g, T x, and ΔT x, and the supercooled liquid region (ΔT x = T g−T x) for the ribbon and the BMG sample. Note that the two samples show a difference in the supercooled liquid region, but both values are higher than those reported for other Ni-based alloys,Reference Zhou, Johnson and Rhim32 indicating that the supercooled liquid of this composition presents higher resistance to crystallization.
Thermal parameters determined from DSC measurements at a heating rate of 40 K/min.
The compression stress–strain test (curve not shown here) of the Ni60Nb37B3 BMG shows an yield strength of about 1900 MPa, as expected for glassy alloys of the Ni–Nb–B system, and some plasticity is observed in association with several serrated flows before fracture.
Figure 4 depicts typical load (P) versus displacement (h) curves of the ribbon and the BMG samples. Power-law fits, in agreement with the method of Oliver and Pharr,Reference Oliver and Pharr30 are indicated by continuous lines (red and green) in the figure. The two samples show very similar values of maximum depth and hardness. However, there is a difference in the reduced elastic modulus, as suggested by the different slope of the unloading part of the indentation curves. This difference is attributed to the higher fraction of free volume trapped in the ribbon during casting (due to the higher cooling rate), resulting in enhanced atomic mobility and therefore lower E r.
Load–displacement curves obtained by nanoindentation of the ribbon and bulk samples using a Berkovich indenter diamond tip at a constant loading rate of 0.1 mN/s.
The pop-in events associated with the formation and propagation of shear bands, which are typically reported in metallic glasses, cannot be identified from the loading part of the nanoindentation curves. The same behavior has been observed in Ce-, Ni-, and Fe-based BMGs. According to the model proposed by Li et al.,Reference Li, Wei, Zhang, Xing, Zhang and Wang24 which correlates pop-in events with the T/T g ratio, alloys with T/T g < 0.35 do not show pop-in events. This is in agreement with our results. The absence of pop-in events indicates that shear band activity during plastic deformation of this alloy is not very pronounced, as also indicated in the SEM micrographs of the indentation imprints (inset of Fig. 5).
Dependence of hardness, H, and reduced Young's modulus, E r, on the maximum penetration depth during nanoindentation experiments performed on the Ni–Nb–B bulk glassy alloy. The inset shows an indentation imprint performed on the bulk alloy at P max = 100 mN.
In addition to H and E r, Table II shows the values of H/E r ratios, which are indicative of the wear resistance of the metallic glass. Note that the elastic strain to failure, which is related to the H/E r ratio, has been shown to be a suitable parameter to describe the wear resistance of coatings,Reference Leyland and Matthews33 more so, in fact, than hardness alone.Reference Chen, Martin, Luzguine-Luzgin and Inoue3,Reference Rebholz, Leyland, Schneider, Voevodin and Matthews34 The ribbon seems to have slightly higher wear resistance than the bulk alloy because of its lower E r. Table II also shows the values of elastic, plastic, and total indentation energies.
Mechanical properties determined in nanoindentation tests.
The elastic recovery was evaluated as the ratio between the elastic and total (plastic + elastic) energies during nanoindentation, U el/U tot. These energies were calculated from the areas between the unloading curve and the x-axis (U el) and between the loading curve and x-axis (U tot) in the nanoindentation experiments. Elastic recovery is of particular interest in applications such as impact loading because it indicates how much energy is released from the loaded material.Reference Musil, Kunc, Zeman and Poláková35 Note that the ribbon sample showed higher elastic recovery, which is not surprising since U el/U tot has been shown to be proportional to H/E r.Reference Cheng and Cheng36,Reference Pellicer, Pané, Sivaraman, Ergeneman, Suriñach, Baró, Nelson and Sort37
To gain a better understanding of the deformation behavior of Ni–Nb–B metallic glass, the bulk glassy alloy was subjected to nanoindentation experiments under different maximum loads. Figure 5 shows the dependence of hardness and reduced Young's modulus on the maximum penetration depth. Interestingly, the hardness decreased from 15.7 (at 10 mN) to 11.4 GPa (at 500 mN). This decrease according to indentation depth (i.e., about 25%) is similar to that reported for Pd- and Ti-based metallic glasses during nanoindentation.Reference Concustell, Sort, Alcala, Mato, Gebert, Eckert and Baro17 The compressive yield stress (σc = 3.9 GPa) was correlated with hardness at high loads. A constraint factor (between hardness and compressive yield stress) of 2.92 was obtained, which is in good agreement with that reported for other families of metallic glasses and crystalline alloys. Similarly, Young's modulus also decreased with the applied load, from 165 to 125 GPa. Such mechanical softening has been reported for other metallic glasses and attributed to the net creation of free volume during plastic deformation.Reference Concustell, Sort, Alcala, Mato, Gebert, Eckert and Baro17 The value of compressive yield stress obtained here is in good agreement with those reported for binary Ni–Nb or ternary Ni–Nb–Sn metallic glasses.Reference Zhu, Zhang, Pan, Sun and Hu38,Reference Choi-Yim, Xu and Johnson39
Since both the ribbon and bulk samples showed a similar indentation response, finite-element simulation studies were performed only for the bulk sample. The nanoindentation curves were modeled using finite-element analysis software (Strand7, developed by G + D Computing Pty Ltd.). A Poisson's ratio of 0.37 was used, in agreement with the value in other Ni-based metallic glasses reported in the literature.Reference Xu, Duan, Johnson and Garland40 The experimental value of Young's modulus and compressive yield stress of 4.0 GPa were used for the calculations, and frictionless contact between the indenter and the specimen was assumed. In the simulations, the Berkovich indenter was modeled as a conical indenter with a cone half-angle (70.3°) that provides the same area-to-depth ratio as the actual indenter used in our work. This allows for the use of axial-symmetric elastic equations. Although contact solutions for pyramidal indenters have been reported in the literature, the conversion to an equivalent axial-symmetric solution is widely used and accepted.Reference Fischer-Cripps41 Furthermore, due to the axis-symmetric nature of the geometry, only a half-sectional plane of the geometry needs to be considered in the mesh design. A larger density of nodes was designed in the vicinity of the contact so that rapid spatial variations in stress and displacements could be calculated accurately. A very high Young's modulus (1100 GPa), a Poisson ratio of 0.07, and the isotropic pressure-independent behavior are assumed for the diamond indenter. Both the elastic and elastoplastic responses (using conventional Tresca and pressure-dependent Mohr–Coulomb yield criteria—with variable cohesion and friction coefficient) were calculated numerically, and the results were compared with the experimental load–displacement data. The value of the friction coefficient was first estimated from the fracture angle of the compressed specimen. This angle was approximately 40°, leading to a Mohr–Coulomb friction coefficient of 0.176 (keeping in mind that  ${{\rm{\beta }}_{{\rm{M}}-{\rm{C}}}} = {\textstyle{{\cos 2{{\rm{\theta }}_C}} \over {\sin 2{{\rm{\theta }}_C}}}}$, where θC is the fracture angle).
As shown in Fig. 6, the indentation–load curve calculated using the elastic Hertz theory differed significantly from the experimental one. Also, a discrepancy was found between the experimental and simulated curves, using the elastic-perfectly plastic formalism with a pressure-independent (Tresca) yield criterion. In this case, for a given load, the corresponding calculated penetration depth was greater than the experimental value. Conversely, the overall load–displacement indentation response was well reproduced when the Mohr–Coulomb yield criterion with a pressure index of βM–C = 0.176 (which corresponds to θC = 40°, as observed in the fracture of the sample in the compression test) was introduced in the simulations (see Fig. 6). Hence, the simulations revealed that the indentation load at a given indentation depth increased in response to the introduction of a pressure sensitivity index, which is consistent with the behavior of other metallic glasses (e.g., Ti-based glasses, see Ref. Reference Fornell, Concustell, Suriñach, Li, Cuadrado, Gebert, Baró and Sort42).
Experimental and simulated load–unload nanoindentation curves of the Ni-based amorphous alloy measured at a maximum load of 10 mN. Three different numerically simulated P–h curves are shown, using the elastic (Hertz) model, an elastoplastic deformation model based on the conventional Tresca yield criterion, and an elastoplastic model based on the Mohr–Coulomb yield criterion. A good agreement with the experimental curve is obtained in the latter case when a friction coefficient of βM–C = 0.176 and a cohesion of 1.26 GPa are used.
Further outcomes from the numerical simulations can be obtained by plotting the stress (in this case σθθ component) contour maps of the deformed region under the indenter. The contour maps corresponding to maximum load (10 mN) are illustrated in Fig. 7.
Circumferential stress (σθθ) contour on the r–z plane developed under the indenter at P max = 10 mN, based on the Mohr–Coulomb yield criterion.
It is worth mentioning that compressive stresses of up to 14 GPa are obtained underneath the indenter. Moreover, as the plastic zone boundary is approached, σθθ becomes slightly tensile (rather than compressive), thereafter gradually decreasing with increasing distance.
Finite element simulations for yield were also carried out (not shown here), which revealed that the yield of this metallic glass can be modeled using the Mohr–Coulomb yield criterion, in good agreement with other BMGs.
IV. CONCLUSIONS
The main findings reported here can be summarized as follows.
A new ternary glassy alloy with a nominal composition of Ni60Nb37B3was produced in the form of melt-spun ribbons and copper mold-cast wedges. This alloy exhibited good thermal stability (ΔT x ≥ 45 K), high hardness (H > 15 GPa), and a tensile strength of 3.9 GPa, with a fracture angle of approximately 40°. The two types of samples, ribbon and BMG, showed different Young's moduli, which was attributed to the different amounts of free volume accumulated within the amorphous structure of the alloy during solidification at different cooling rates, as evidenced by DSC.
Finite element simulations revealed that the yield of this metallic glass can be modeled using the Mohr–Coulomb yield criterion, showing good agreement with other BMGs and with the values of the fracture angle under compression tests.
ACKNOWLEDGMENTS
This work was financially supported by CNPq and FAPESP (Brazil) and the MAT2011-27380-C02-01 Project of MINECO (Spain). MDB acknowledges partial financial support from an ICREA-Academia Award.