


I. INTRODUCTION
In recent years, electric vehicles (EVs) have attracted attention because these eco-friendly cars run without exhaust gas. However, their batteries must be charged, hence, several types of wireless power transfer (WPT) systems for EVs have been studied to reduce the labor involved in this process [Reference Hori1–Reference Shin4]. One such technology, microwave power transfer (MPT), transmits electricity via microwave by using transmitting and receiving antennas in which the electric power transmission microwave is radiated from a transmitting antenna to a receiving antenna [Reference Shinohara5]. Therefore, MPT technology can transmit electricity with high efficiency for long distances by using appropriate transmitting and receiving antennas.
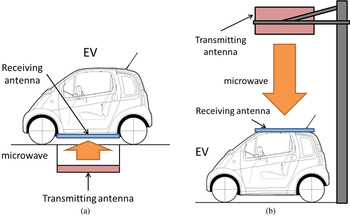
In the previous study, we examined an MPT system that transmits electricity from a transmitting antenna on a road to a receiving antenna on a lower part of an EV [Reference Shinohara, Kubo and Tonomura6]. Figure 1(a) shows a schematic diagram of the MPT system from an on-road antenna. With a distance of approximately 10 cm between the transmitting and receiving antennas, we achieved high transmission efficiency; however, mutual couplings between transmitting and receiving antennas must be considered. Therefore, we propose a different type of MPT system in which electricity is transmitted from a transmitting antenna over an EV to a receiving antenna on the roof of the EV [Reference Shinohara, Kubo and Tonomura6, Reference Kubo, Shinohara and Mitani7]. Figure 1(b) shows a schematic diagram of the MPT system from an overhead antenna. With this system, the distance between the transmitting and receiving antennas is longer than that of the MPT system from an on-road antenna. Large antennas are required to maintain high transmission efficiency in the MPT system from an overhead antenna; however, consideration of mutual couplings is not required.
Schematic diagrams of MPT systems for EVs. (a) MPT system from an on-road antenna; (b) MPT system from an overhead antenna.

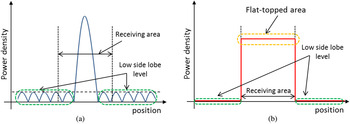
We used a phased array antenna as an overhead transmitting antenna in the MPT system for EVs. When we use aperture antennas as a transmitting antenna and a receiving antenna, we can estimate the transmission efficiency versus the size of a transmitting antenna, the size of a receiving antenna, and the distance between these antennas by using equations, which were described in reference [Reference Brown8]. In this study, we use a phased array antenna as a transmitting antenna. There are some famous beams forming methods for phased array antenna: Gaussian method, Chebyshev method, and Taylor method [Reference Mailloux9]. By using these methods, we can decrease the side lobe level and increase the transmission efficiency. On the other hand, we use a rectenna array as a receiving antenna. The rectenna consists of a rectifying circuit and an antenna and convert the received microwave power to direct current power in the MPT system. The conversion efficiency of the rectenna is affected by the input power level and that of a rectenna array is affected by the input power level distribution [Reference Shinohara5]. We used the rectenna array in the MPT system for EVs; thus, it was necessary to form a flat-topped beam pattern and equalize the input power level of each rectenna element to increase the conversion efficiency of the rectenna array. By using Gaussian method, Chebyshev method, or Taylor method, we can achieve high transmission efficiency; however, we cannot achieve uniform power density at the rectenna array. Because of these reason, beam forming of a phased array antenna for the proposed MPT system has three important targets: to increase transmission efficiency, to decrease side lobe level for safety, and to achieve a flat-topped beam pattern, whose power density is uniform in a power receiving area. Figure 2 shows schematic diagrams of distribution of radiated power density at the power receiving area. Figure 2(a) shows a Chebyshev beam pattern, which has low and flat side lobe level, and Fig. 2(b) shows an ideal beam pattern, which has low side lobe level and uniform power density in a receiving area.
(a) Radiated power density of Chebyshev beam pattern. (b) Radiated power density of ideal beam pattern.

In the previous study, we simulated and optimized the size of a transmitting antenna, the size of a receiving area, distance between these antennas, and pattern synthesis of a phased array. From the results of these simulations, we achieved to form a flat-topped beam pattern and increased the transmission efficiency to 79.1% [Reference Shinohara, Kubo and Tonomura6]. In this paper, we experimentally demonstrated a flat-topped beam forming by using a phased array antenna which was installed at Kyoto University.
II. OUTLINE OF EXPERIMENT AND SIMULATION
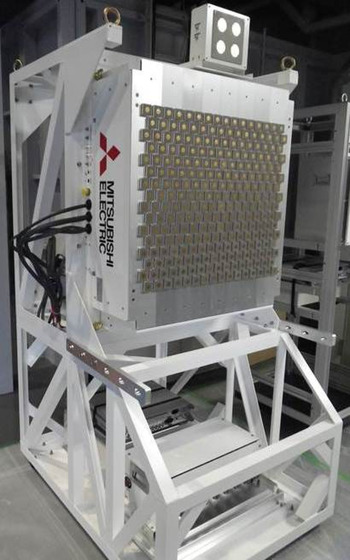
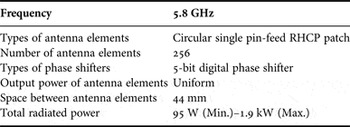
We installed a phased array antenna, which we call Advanced Phased Array System (APAS), to study MPT technology at Kyoto University. We conducted an experiment and formed a flat-topped beam pattern by using the APAS. The APAS is shown in Fig. 3, and the parameters of the system are shown in Table 1. The 256 elements of the APAS are patch antennas, the output phases of which can be controlled with 5-bit digital phase shifters. The total output power of the APAS is controlled from 95 W to 1.9 kW; however, the output power of each antenna element is uniform and cannot be controlled independently. Hence, in this study, we controlled only the output phases of each antenna element and formed a flat-topped beam pattern. We cannot control the output power; thus, the side lobe level is increased, and the transmission efficiency becomes lower than that of previous study. The purpose of this study is to form a flat-topped beam pattern experimentally and to compare the simulated beam pattern and experimental beam pattern.
Photograph of APAS.

Parameters of APAS.

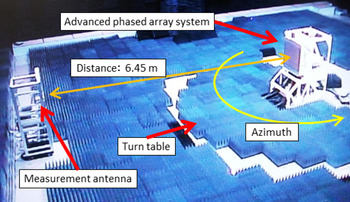
We conducted an experiment with the APAS in an anechoic chamber of the Advanced Microwave Energy Transmission Laboratory at Kyoto University as shown in Fig. 4. The APAS was set at the center of a turntable, and an antenna used for measurement was set close to the wall of the anechoic chamber. We rotated the turntable and measured the receiving power level of the measurement antenna to measure the horizontal beam patterns. The beam angle was represented by the azimuth, and the angle directly in front of the APAS was defined as 0°. The distance between the transmitting antenna and the measurement antenna was 6.45 m. We can decide whether the radiation pattern is near-field pattern or far-field pattern by using the following equation [Reference Kraus10]:
 $$r \gt \displaystyle{{2a^2} \over \lambda},$$
Photograph of experiment conditions.

where r is the distance between a transmitting antenna and a receiving antenna, a is the antenna aperture length, and λ is the wave length. When the parameters satisfy equation (1), the radiation pattern is far-field pattern and we regard the wave front as a plane wave front; however, when the parameters do not satisfy equation (1), the radiation pattern is near-field and we regard the wave front as a spherical wave front. Hence we have to consider phase errors and amplitude errors caused by the transmission paths. In these experimental conditions, the size of antenna aperture was approximately 0.7 m and the parameters do not satisfy equation (1). Thus, the measured beam pattern was a near-field pattern and we have to consider the effect of transmission paths.
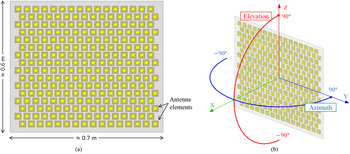
To confirm the experimental results, we simulated the electromagnetic fields and the beam patterns using High Frequency Structural Simulator (HFSS). We simulated a model, shown in Fig. 5(a), and calculated the beam patterns in a spherical coordinate system, as shown in Fig. 5(b). The beam angle is represented by the azimuth and the elevation, and angles directly in front of the APAS were defined as 0°. We calculated the beam patterns on a sphere with a radius of 6.45 m
(a) Simulation model and (b) spherical coordinate system of the beam patterns.

III. OUTPUT PHASES OF FLAT-TOPPED BEAM PATTERN
The target area of equalized power density was set to 1.2 m × 1.2 m because the power receiving area of the proposed MPT system is 1.2 m × 1.2 m. In the previous study, we tried to use Fourier transform method and Woodward-Lawson method [Reference Mailloux9] to form a flat-topped beam pattern; however, we could not form a flat-topped beam pattern, probably because the receiving area is narrow and the distance between a transmitting antenna and a receiving antenna is short, and we decided to use a genetic algorithm (GA). Hence we use a same type of GA, which is used to perform beam forming in the previous study [Reference Shinohara, Kubo and Tonomura6] and other beam forming study [Reference Hashimoto, Niijima, Eguchi and Matsumoto11], to calculate the output phases of the flat-topped beam pattern in this study. In the GA, we calculate the following equations:
 $$ML = {\rm \;} \mathop \sum \nolimits (\alpha - S(x))^2, \quad ( - 0.6\; {\rm m} \le x \le 0.6\; {\rm m}),$$
 $$SL{\rm \;} = {\rm \;} \mathop \sum \nolimits S(X),\quad (x \le - 0.7\,{\rm m},\,\,0.7\,{\rm m} \le x),$$
 $$SUM = 1000ML + SL,$$
where S(X) represents the Poynting vector, α represents the target power density of the flat-topped beam, ML represents the power density of the main-lobe area, SL represents the power density of the side-lobe area, and SUM represents the evaluation function. We calculate the electromagnetic fields radiated from each antenna elements independently, and synthesis the calculated electromagnetic fields. By using synthesis electromagnetic fields, we calculate S(X). Equation (2) evaluates the flatness of the radiated power density of the receiving area, and equation (3) evaluates the power density of unwanted emission to the outside of the receiving area. We cannot control the output power of each antenna elements independently in this study, and it is difficult to decrease the side lobe level. Hence we focus on flat-topped beam forming, and ML is more dominant than SL in equation (4). We can optimize the output phases of a linear array antenna by using these equations; thus, we optimized two types of linear array antennas, which independently correspond to the vertical and horizontal array of the APAS. We combined the types of optimized output phases and calculated the output phases using the following equation:
 $$\left[ {\matrix{ {e^{ja_1}} \cr {e^{ja_2}} \cr \vdots \cr {e^{ja_n}} \cr}} \right]\left[ {\matrix{ {e^{jb_1}} & {e^{jb_2}} & \cdots & {e^{jb_m}} \cr}} \right] = \left[ {\matrix{ {e^{j\left( {a_1 + b_1} \right)}} & {e^{j\left( {a_1 + b_2} \right)}} & \cdots & {e^{j\left( {a_1 + b_m} \right)}} \cr {e^{j\left( {a_2 + b_1} \right)}} & \ddots & {} & \vdots \cr \vdots & {} & \ddots & \vdots \cr {e^{j\left( {a_n + b_1} \right)}} & \cdots & \cdots & {e^{j\left( {a_n + b_m} \right)}} \cr}} \right],$$
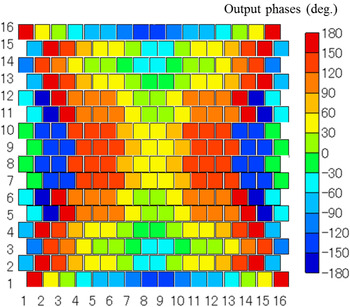
where n and m represent the number of vertical and horizontal array elements, respectively, and a 1, a 2, … , a n and b 1, b 2, … , b n represent optimized output phases of vertical and horizontal arrays, respectively. The calculated output phases for the APAS are shown in Fig. 6, in which squares indicate the positions of the antenna elements and colors indicate the calculated output phases for a flat-topped beam pattern. In the following section, we discuss the experiments and simulation of flat-topped beam formation in which these output phases were used.
Calculated output phases for flat-topped beam pattern.

IV. SIMULATION AND EXPERIMENT RESULTS
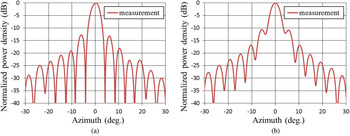
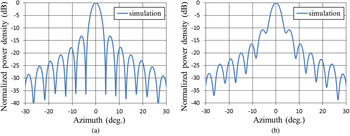
In the experiment with the APAS, we first calibrated the phase shifters of the APAS using the rotating-element electric-field vector (REV) method [Reference Yonezawa, Konishi, Chiba and Katagi12]. The positions of the APAS and the measurement antenna were identical to those described in Section II. The measurement antenna was at near-field in these experiments; thus, we corrected the phase error caused by the difference between the path lengths from each antenna element to the measurement antenna. Figure 7(a) shows the experimental beam pattern in which we attempted to set the output phases in-phase using only the calibration values of the REV method. Figure 7(b) shows a beam pattern in which we used the calibration values of the REV method and the correction values for phase errors caused by the difference between the path lengths from each antenna element to the measurement antenna. The vertical axis represents power density, which was normalized by setting the peak of the beam pattern to 0 dB; the horizontal axis represents the azimuth. The beam pattern in Fig. 7(a) shows some null points; however, that of Fig. 7(b) shows no null points. Figure 8(a) shows the simulated beam pattern in which we controlled the output phases to focus the beam on the measurement antenna position of 0°. Figure 8(b) shows a beam pattern in which we controlled the output phases in-phase. The beam patterns in Figs 8(a) and 8(b) are strongly similar to those of Figs 7(a) and 7(b), respectively. Thus, we controlled the output phases to focus the beam on the measurement antenna position of 0° in Fig. 7(a), and we controlled the output phases in-phase in Fig. 7(b). From these results, we confirmed the calibration of the phase shifters of the APAS.
Experimental beam pattern in which the output phases were attempted to be set in-phase with the calibration values. (a) Pattern with only the calibration values of the REV method; (b) pattern with calibration values of the REV method and correction values for phase error caused by the difference between the path lengths from each antenna element to a measurement antenna.

Simulated beam pattern. (a) Output phase controlled to focus the beam on the measurement antenna position of 0°; (b) output phase controlled in-phase.

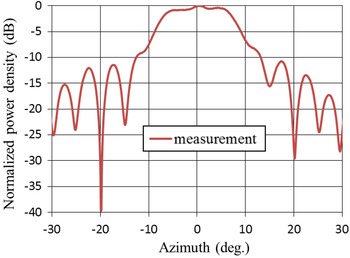
The outline of this experiment to form a flat-topped beam pattern is described in Section II; the output phases for a flat-topped beam are identical to the phases calculated by the GA and described in Section III. The measured beam pattern of this experiment is shown in Fig. 9. In this figure, the vertical axis represents power density, which was normalized by setting the peak of the beam pattern to 0 dB, and the horizontal axis represents the azimuth. The receiving area corresponds to the space in which the azimuth is in the range from −5° to 5°. The difference between the maximum and minimum power density in the receiving area was less than 0.9 dB; thus, we achieved formation of a flat-topped beam pattern by using the APAS.
1D horizontal beam pattern.

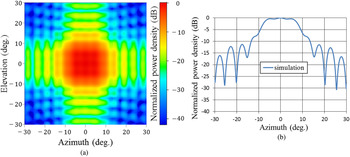
Figure 10 shows the calculated beam patterns achieved in the electromagnetic simulation. Figure 10(a) shows the two-dimensional (2D) beam pattern, and Fig. 10(b) shows the one-dimensional (1D) horizontal beam pattern. In Fig. 10(a), the vertical axis indicates elevation, the horizontal axis represents azimuth, and the color indicates power density, which was normalized by setting the peak of the beam pattern to 0 dB. In Fig. 10(b), the vertical axis represents power density, which was also normalized by setting the peak of the beam pattern to 0 dB, and the horizontal axis indicates azimuth. According to the previous figure, the receiving area corresponds to a space in which the azimuth and elevation are in the range of −5° to 5°. From the result of Fig. 10(a), the beam pattern is flat-topped in the 2D pattern, and the transmission efficiency from the transmitting antenna to the receiving antenna is about 23%. The difference between the maximum and minimum power density in the receiving area was less than 0.6 dB, as shown in Fig. 10(b). According to these results, we achieved formation of a flat-topped beam pattern by using the APAS in the electromagnetic simulation.
Simulated beam patterns showing (a) 2D pattern and (b) 1D horizontal pattern.

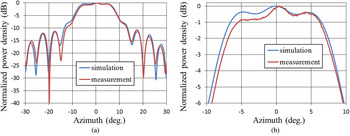
We then compared the results of the experiment and the simulation. Figure 11(a) indicates a comparison between the simulated and measured beam patterns, and Fig. 11(b) shows enlarged beam patterns of Fig. 11(b). The measured beam pattern was approximately identical to the simulated beam pattern on the inside and the outside of the receiving area. Because the output phases required control with high accuracy to form the flat-topped beam pattern, we confirm that we can control the output phases of the APAS with high accuracy and that we can calculate the output phases of flat-topped beam pattern by using the GA.
(a) Comparison between the simulated and measured beam patterns; (b) enlarged beam patterns.

The transmission efficiency was as low as 23% in the simulation because in the APAS it was only possible to control the output phases but not the output power of each antenna element independently. Thus, if we control the output phases and output power of each antenna element independently, we can increase the transmission efficiency as the previous study.
V. CONCLUSION
We examined an MPT system for EVs by using an overhead transmitting antenna, which in this study was a phased array antenna. We used a rectenna array to convert the received microwave power to direct current power in the MPT. The conversion efficiency of a rectenna is affected by the input power level and that of a rectenna array is affected by the input power level distribution. Thus, we formed a flat-topped beam pattern and equalized the input power level of each rectenna element to increase the conversion efficiency of the rectenna array. We used an APAS installed to study MPT technology at Kyoto University. We calculated the output phases for the flat-topped beam pattern by using the GA. We performed an experiment and simulated the APAS and the calculated output phases. From the experiment and simulation results, we determined that the difference between the maximum and minimum power density in the receiving area was less than 0.9 dB in the experiment and 0.6 dB in the simulation.
 Takaki Ishikawa received the B.E. degree in Electrical and Electronic Engineering, the M.E. degree in Electrical Engineering from Kyoto University, Kyoto, Japan, in 2010 and 2012, respectively. He is presently a doctor course student of Electrical engineering in Kyoto University. His present research interests include microwave power transmission system.
 Naoki Shinohara received the B.E. degree in Electronic Engineering, the M.E. and Ph.D (Eng.) degrees in Electrical Engineering from Kyoto University, Japan, in 1991, 1993, and 1996, respectively. He was a Research Associate in the Radio Atmospheric Science Center, Kyoto University from 1998. He was a Research Associate of the Radio Science Center for Space and Atmosphere, Kyoto University by recognizing the Radio Atmospheric Science Center from 2000, and there he was an Associate Professor since 2001. He was an Associate Professor in Research Institute for Sustainable Humanosphere, Kyoto University by recognizing the Radio Science Center for Space and Atmosphere since 2004. From 2010, he has been a professor in Research Institute for Sustainable Humanosphere, Kyoto University. He has been engaged in research on Solar Power Station/Satellite and Microwave Power Transmission system.