Introduction
Early-life undernutrition has been associated with a number of postnatal risk factors with an increased propensity for the development of cardiometabolic disorders including type 2 diabetes, hypertension, and obesity.Reference Martín-Estal, De La Garza and Castilla-Cortázar1 This developmental programming via an adverse intrauterine environment also negatively impacts on reproductive outcomes via changes in the key cellular signaling pathways related to female reproductive development and functionReference Jazwiec and Sloboda2 and associated impairments in ovarian follicular growth and development.Reference Chan, Jazwiec, Gohir, Petrik and Sloboda3-Reference Bernal, Vickers, Hampton, Poynton and Sloboda5
In males, restriction of maternal protein or caloric intake results in early onset of puberty, reductions in the secretion of key reproductive hormones (follicle-stimulating hormone, FSH; testosterone), and, in adulthood, altered activities of key steroidogenic enzymes.Reference Zambrano, Rodríguez-González and Guzmán6 This manifests as fewer spermatogonia, spermatocytes, spermatids, a decrease in Leydig cell numbers, and poor sperm quality.Reference Toledo, Perobelli, Pedrosa, Anselmo-Franci and Kempinas7,Reference Melo, Almeida, Caldeira-Brant, Parreira and Chiarini-Garcia8 This impairment of spermatogenesis is associated with a reduction in Sertoli cell (SC) number,Reference Genovese, Núñez, Pombo and Bielli9 an important observation in the context of developmental programming as SC number is maximized at puberty and is the major determinant of adult sperm production. In other animal models, such as the adult sheep, short periods of undernutrition disrupt the tight junction protein, claudin, in the testis, and lead to retention of characteristics associated with immature SCs, consistent with de-differentiation.Reference Guan and Martin10 Together these data suggest that the proliferation and differentiation of SCs are vulnerable to early-life undernutrition, leading to long-lasting impacts on adult male testicular morphology, spermatogenic capacity, and ultimately fertility.
In the search for mechanistic links between nutrition and testis development, the growth hormone (GH) – insulin-like growth factor (IGF-I) axis – has been shown to play a role in normal testicular development and function. In vitro approaches utilizing Leydig and SC cultures have revealed complex interactions between GH/IGF-I and the gonadotropins affecting differentiated cell functions, for example, steroidogenesis and cell division.Reference Spiteri-Grech and Nieschlag11In vivo studies using rodents with altered GH/IGF status, for example, GH deficiency, have shown that IGF-I can play an important role in the regulation of steroidogenesis and spermatogenesis. The GH–IGF axis is altered by changes in nutrition with undernutrition elevating circulating concentrations of GH but reducing the concentrations of IGF-I.Reference Fazeli and Klibanski12,Reference Smith, Sloboda, Saffery, Joo and Vickers13 In addition, IGF-I concentrations are reduced following early-life treatment with betamethasone, typically used in management of premature birth.Reference Gatford, Owens and Li14 IGF-I is a 70-amino acid peptide that is coded by the Igf1gene. It has sequence homology with IGF-II and insulin, and all three peptides have A and B chains linked by disulphide bonds.Reference Baker, Hardy and Zhou15 Sometimes called somatomedins, IGF-I and IGF-II, are pleiotropic growth factors that were first described in cartilage tissueReference Salmon and Daughaday16 but are known to play key roles in growth and differentiation.Reference Bentov and Werner17,Reference Livingstone18 Indeed, IGF-I deficiency leads to idiopathic short stature in childhood,Reference Dai, Wang and Dong19,Reference Wang, Ji, Shao, Zhang and Ban20 as well as deregulation of lipid metabolism and glucose metabolism, leading to cardiovascular disease and diabetes, and cell proliferation, differentiation, and apoptosis, leading to increased risk of cancer.Reference Aguirre, Ita, Garza and Cortazar21-Reference Leroith, Scheinman and Bitton-Worms23
Although IGF-I is generally seen as an endocrine factor produced primarily by the liver, it is also a paracrine factor produced by other tissues, including the testisReference Puche and Castilla-Cortázar24 where it plays a role in testicular differentiation during embryogenesis, including the proliferation and development of SCs and germ cells.Reference Pitetti, Calvel and Zimmermann25 The proliferation of immature SCs is controlled primarily by FSH but involves other processes that depend on the insulin/IGF signaling pathway.Reference Pitetti, Calvel and Zimmermann25 The IGFs produced by SCs stimulate spermatogenesis, and thus sperm output, and act on Leydig cells in synergism with luteinizing hormone to increase androgen production before puberty.Reference Gelber, Hardy, Chamindrani Mendis-Handagama and Casella26 Leydig cell androgen production is determined by several steroidogenic enzymes, such as 3 beta hydroxysteroid dehydrogenase (3β-HSD), and other factors that maintain cholesterol transport, such as heat shock factor 1 (HSF1) that aids the recovery of steroidogenic acute regulatory protein (StAR) under chronic heat stress.Reference Oka, Shiraishi and Fujimoto27 Most of the actions of IGF-I and IGF-II in reproductive tissues are mediated by the type 1 IGF receptor (IGF1R).Reference Pitetti, Calvel and Zimmermann25,Reference Yoon, Jiang, Chung and Roser28 Moreover, treatment with GH and IGF-I in the GH-deficient rat has been shown to impact on key markers of sperm function including increasing sperm motility and improving morphology of immature spermatozoa.Reference Vickers, Casey, Champion, Gravance and Breier29,Reference Breier, Vickers, Gravance and Casey30
The effects of maternal undernutrition on offspring testicular function including spermatogenesis remain poorly defined. Therefore, in the present study, we utilized a rat model of moderate maternal undernutrition throughout pregnancy and/or lactation to investigate cellular proliferation, spermatogenesis, IGF-I and its receptor (IGF1R), and circulating FSH and inhibin concentrations in adult male offspring.
We hypothesized that maternal undernutrition would alter testicular functions by affecting IGF-I testicular system.
Materials and methods
Animal model
All animal work and experiments were performed and approved under the guidelines of the Animal Ethics Committee of the University of Auckland (R402). In the present study, we used an established model of developmental programming via maternal nutrient manipulation developed previously (Vickers et al. 2000).Reference Vickers, Breier, Cutfield, Hofman and Gluckman31-Reference Howie, Sloboda and Vickers33 Female Wistar rats (120 days old; n = 24) were sourced from the Vernon Jansen Unit at the University of Auckland, where the animal model was developed. Female rats were time-mated using a rat estrous cycle monitor (Fine Science Tools, Foster City, CA, USA) and thereafter were housed individually in standard rat cages with free access to water and kept in the same room with a constant temperature of 25°C and a 12:12 light: dark cycle. Pregnant dams (six dams per group) were randomly allocated among four treatments: (1) CONTROL in which dams were fed ad libitum throughout pregnancy and lactation with a standard diet (protein 18%, fat 5%; digestible energy 3.4 kcal/g; Teklad Global 18% Protein Diet, Diet 2018); (2) Undernourished dams fed 50% of CONTROL intake throughout Pregnancy and Lactation (UNPL); (3) Undernourished dams fed 50% of CONTROL intake throughout Pregnancy only (UNP); and (4) Undernourished dams fed 50% of CONTROL intake throughout Lactation only (UNL).
Body mass and age at puberty
After birth, pups were weighed and litter size was adjusted to eight pups (four males and four females) per litter to ensure standardized nutrition until weaning at day 22. After weaning, male pups were housed in pairs and fed a standard chow diet ad libitum until the end of the trial (160 days). From postnatal day 27, offspring were weighed and checked daily for markers of reproductive maturity balano-preputial separation in males, for onset of puberty.
Tissue processing
At 160 days of age, male offspring (n = 40) were fasted overnight, weighed, and killed by decapitation following pentobarbitone anesthesia (60 mg/kg, intraperitoneally). Blood was collected into heparinized vacutainers tubes and centrifuged (2400×g, 20 min), and plasma was stored at −20°C for future analysis. The values for body mass and total testis mass were used to calculate relative testis mass and gonadosomatic index (the ratio of testis mass to body mass). Right testes were immersed in fixative (4% formaldehyde phosphate buffer, pH 7.4) for 24 h, then dehydrated in increasing concentrations of ethanol (70º, 95º, and 100º), then immersed in chloroform, and paraffin embedded. Subsequently, 5-μm thickness sections were obtained using a microtome (Leica Reichert Jung Biocut 2030, Wetzlar, Germany), followed by staining and immunohistochemistry. The left testes were frozen in liquid nitrogen and stored at –80°C in preparation for molecular analyses.
Image capture
Digital images from hematoxylin–eosin and immunohistochemistry slides were obtained using a light microscope (Model MRP-5000; Premiere Professional Binocular, Manassas, VA, USA) with a digital camera (Dino-Eyepiece, AM-7023X; AnMo Electronics Corporation, New Taipei City, Taiwan) and analyzed with DinoCapture 2.0 software (AnMo Electronics Corporation).
Morphological assessment
In 5-µm thickness sections stained with hematoxylin–eosin, testis morphometry was analyzed by assessing 50 randomly selected fields per animal. The morphometric variables, such as seminiferous tubule diameter (STD), height of seminiferous tubule epithelium (HSTE), and number of SCs per cross section, were measured in 50 transversal cross sections of seminiferous tubules at low magnification for STD (100), or high magnification for HSTE or SC (400), respectively, according to the morphometric variables. In adult rats, it is relatively straightforward to distinguish SCs histologically because they have a very defined cell nucleus, in contrast to germ cells. Spermatogonia have rounded cytoplasm with a round nucleus and are also easy to differentiate.
Stages in the seminiferous epithelial cycle
To assess the effects of undernutrition on spermatogenesis, we analyzed the frequency of stages in the spermatogenic cycle in 200 digital images for each testis. Digital images of all seminiferous tubules within a cross section of the testis were captured and analyzed at 400× and 600× magnification and classified according to stage of cycle (I–XIV), as described previously for the rat.Reference Hess, Schaeffer, Eroschenko and Keen34-Reference Johnston, Olivas, DiCandeloro and Wright37 To reduce systematic random variation, a consensus decision was made by two observers simultaneously examining each section. To improve the power of detecting a treatment difference, we pooled the data across three stages (I–IV, V–VIII, and IX–XIV) but also analyzed specifically stage VII in order to focus on the period when spermiation takes place.
Immunohistochemistry
Fixed testes were progressively dehydrated by immersion in increasing concentrations of ethanol (70%, 95%, and 100%), embedded in paraffin resin (Historesin; Leica, Heidelberg, Germany), and sectioned at 5 µm. Slides were processed for the detection of immunoreactive IGF-I, inhibin, 3β-HSD, HSF1, and Ki-67 (Table 1) using the streptavidin–biotin–peroxidase protocol, as described previously.Reference Pedrana, Viotti and Lombide38 In brief, tissue sections were deparaffinized and rehydrated and then underwent heat-induced epitope retrieval; slides were immersed in 0.01-M citrate buffer (pH 6.0) and Tween 20 (5 ml), heated for 5 min (microwave oven), and then washed with distilled water and phosphate-buffered saline (PBS, pH 7.4); endogenous peroxidases were inactivated with 3% hydrogen peroxide (20 min), followed by washing in PBS and incubation with normal rat serum to block non-specific binding proteins; sections were then incubated for 30 min with each primary antibody on different slides (Table 1), for 30 min with biotinylated secondary antibody, and for 30 min with streptavidin–peroxidase enzyme complex (Kit Rabbit Specific HRP/DAB-ABC-Detection IHC, ab 64261; Abcam, Eugene, OR, USA); 3,3′ diaminobenzidine (DAB) chromogen (30 µl) was added to 1.5-ml DAB substrate, mixed, and incubated for 5 min; testis sections were counterstained with Mayer’s hematoxylin, dehydrated, and mounted with Entellan® (Merck, Darmstadt, Germany) and placed under a glass coverslip.
Primary antibodies used and basic information about these antibodies for immunohistochemistry

Image analyses
A total of 50 seminiferous tubules in transverse cross section were captured with 4 images (final magnification 400×), providing 200 images. The localization of IGF-I, 3β-HSD, HSF1, inhibin, and Ki-67 immunostaining area were described and quantified by ImageJ (Version 1.52b 6 May 2018; Wayne Rasband, National Institutes of Health, Bethesda, MD, USA; http://rsb.info.nih.gov/ij.). Areas of immunopositivity were measured using a locally written macro that included color threshold from RGB images and conversion to binary images and area measurement. The threshold values were verified and normalized with controls carried across several runs for calibration. This process provided quantitative values for the percentage and intensity of immunostained area. A batch mode was performed to apply the macro to all images.
Endocrine assays
Plasma samples were assayed using rat-ELISA (enzyme-linked immunosorbent assay) kits for FSH (Biocode Hycel AER004; Immunodiagnostic Systems, Boldon Colliery, UK) and inhibin B (10-84100; Beckman Coulter, Diagnostic Systems Laboratories, Webster, TX, USA), following the manufacturer’s instructions. All samples were assayed in duplicate.
RNA analyses
Total RNA was extracted using commercially available kits (AllPrep DNA/RNA mini kit; cat 80204; Qiagen, Germantown, MD, USA). Genomic DNA contamination was removed from each sample by treatment with RNase-free DNase (Invitrogen Life Technologies, Auckland, New Zealand) according to the manufacturer’s instructions. RNA quantity and purity were analyzed using a NanoDrop spectrophotometer (ND-1000; BioLab Ltd, San Diego, CA, USA) and NanoDrop software (version 3.1.2). All RNA samples were stored at −80°C until required.
Five micrograms of total RNA was used for first-strand cDNA synthesis using the Moloney Murine Leukaemia Virus Reverse Transcriptase (M-MLV-RT; Promega Corp., Madison, WI, USA) and a standard thermocycler (GeneAmp® PCR System 9700; Applied Biosystems, Carlsbad, CA, USA). A master mix was prepared containing: 5-µl M-MLV 5× buffer (cat M531A; Promega Corp.), 0.5-µl M-MLV-RT (cat M170B; Promega Corp.), and 1.25-µl 10 µM deoxynucleosides triphosphates (cat R0181; Thermofisher, Frederick, MD, USA). We used the following cycling conditions: an initial denaturation stage of 5 min at 96°C, followed by 30 cycles (30 s each) of 96°C (denaturation), 60°C (annealing stage), and 72°C (extension stage). The cDNA was stored at −20°C for later use in quantitative polymerase chain reaction (qPCR) assays.
Testicular gene expression for IGF1R and the endogenous reference (ß-actin) was measured by qPCR using the ABI PRISM® 7900HT Sequence Detection System (Applied Biosystems, Auckland, New Zealand). All primers were designed using Primer 3 software (version 0.4.0, Whitehead Institute for Biomedical Research) manufactured by Invitrogen (Invitrogen Life Technologies). Primer sets were ß-actin forward primer CACCAACTGGGACGATATGGA and ß-actin reverse primer CAGCCTGGATGGCTACGTACAT, 188bp, accession number NM_031144 and IGF1R (commercial purchased Qiagen assay Rn_Igf1r_1_SG; catalogue # QT00178416).Reference Smith, Sloboda, Saffery, Joo and Vickers13
Optimal primer conditions were adjusted to cycling conditions: length 20 bp (range 17–23 bp); Tm 63°C (range 60–65°C); and amplicon length 100–300 bp. Dissociation analyses were performed to ensure specificity, and samples producing a single peak in the dissociation curves were used. Amplified products were visualized on an agarose gel using the E-Gel® CloneWell 0.8% SYBR Safe gel (cat G6618-08; Invitrogen), run on the E-Gel® iBase™ Power System (cat G6400; Invitrogen) and sequenced by spectrophotometry (Allan Wilson Centre, Massey University). The resulting sequences were evaluated using NCBI Basic Local Alignment Search Tool (BLAST) to ensure specificity. Transcript levels were quantified under the following conditions: an initial 2-min hold period at 50°C for normalization (stage 1), followed by enzyme activation at 95°C for 2 min (stage 2); amplification of the gene product through 40 successive cycles of 95°C for 15 s and then 60°C for 1 min (stage 3); followed by a dissociation stage of 15 s at 95°C, 15 s at 60°C, and 2 min at 99°C (stage 4). A standard curve was generated from the mean cycle threshold (Ct) of eight standards (1∶5 serial dilution) of a known concentration in triplicate, while amplification and dissociation curves were generated for all standards and samples (Applied Biosystems). Each sample was run in triplicate.
Statistical analyses
Effects of treatment on area and intensity of immunostaining were assessed by a one-way analysis of variance with nutrition as the main factor. All data are presented as mean ± SEM. All statistical analyses used general linear model, SAS for Windows (San Diego, CA, USA). For post hoc analyses, we used least significant difference (LSD)/Fisher’s LSD. In all cases, the level of significance was P < 0.05.
Results
Maternal undernutrition affected the amounts of testis IGF-I protein and IGF-I receptor transcripts in testis cells in the adult offspring. These effects were associated with changes in testis morphological/morphometric parameters in these animals in adulthood.
Early onset of puberty, body mass at puberty, morphometric parameters, body mass, and testes mass at 160 days old
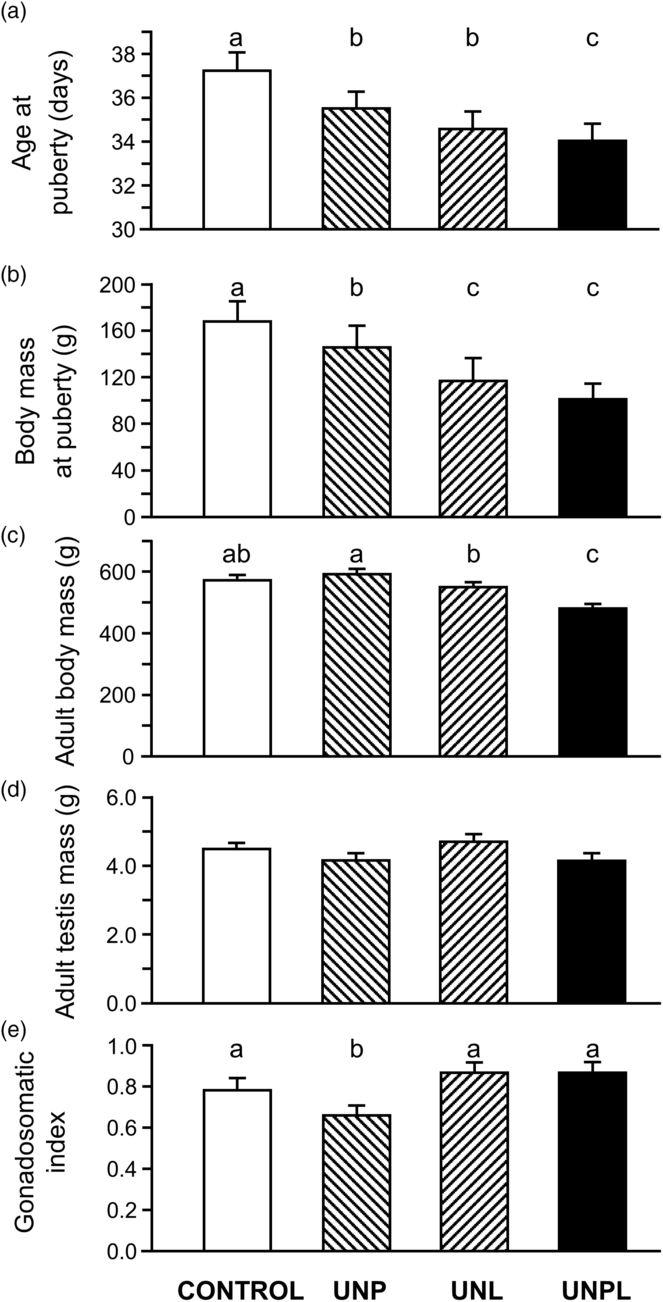
Puberty onset in CONTROL was at 37.4 ± 1.7 days. UNPL had the earliest onset of puberty at 34.1 days. Undernourished groups UNP and UNL also showed an early reach of the puberty earlier than CONTROL (Fig. 1a).
Morphometric data in male rats that were born to mothers fed ad libitum or undernourished: (a) age at puberty; (b) body mass at puberty; (c) adult body mass at age 160 days, (d) adult testis mass at age 160 days, and (e) gonadosomatic index (testis mass/body mass) at 160 days. CONTROL: standard diet. UNP: mothers undernourished during pregnancy. UNL: mothers undernourished during lactation. UNPL: mothers undernourished during both pregnancy and lactation. Values represent mean ± SEM. Different letters among columns indicate significant differences (P < 0.05).

UNPL and UNL groups showed the lowest body mass at puberty. The body weight at the time of pubertal onset was lower in all undernourished groups compared to CONTROL offspring (Fig. 1b).
Body mass at 160-day-old male offspring was lower in UNPL than CONTROL (Fig. 1c). However, testes mass was not significantly different between any of the groups (Fig. 1d). The gonadosomatic index (relative testis weights) was reduced in UNP offspring compared with CONTROL, UNL, and UNPL (Fig. 1e)
Histological and morphometric analyses of testes
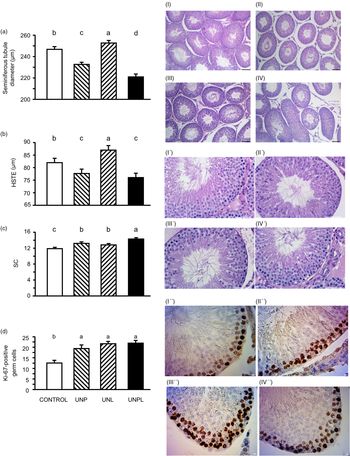
All offspring showed the presence of spermatogenic cycle. UNP and UNPL offspring had smaller STDs (P < 0.0001) (Fig. 2a). Seminiferous tubules from UNPL offspring had the smallest diameter and height of seminiferous epithelium (Fig. 2a). Further, the height of the seminiferous epithelium was decreased in UNP and UNPL compared to the CONTROL and UNL groups (P < 0.0001) (Fig. 2b). Testes from UNP offspring had smaller STDs and increased interstitial area (Fig. 2II, II′).
Effects of maternal undernutrition in adult testis of 160-day-old male rats on morphometric parameters in testis: (a) seminiferous tubule diameter: STD (µm), (b) height of seminiferous tubule epithelium: HSTE (µm), (c) number of Sertoli cells (SC) per seminiferous tubules cross section, and (d) number of Ki-67-positive germ cells in adult. CONTROL: standard diet. UNP: mothers underfed during pregnancy. UNL: mothers underfed during lactation. UNPL: mothers underfed during both pregnancy and lactation. Values are mean ± SEM. Different letters among columns indicate significant differences (P < 0.05). I–IV: low magnification images of microscopic images of adult rat testis parenchyma showing seminiferous tubules transverse cross sections from rats that were born to mothers that were fed ad libitum or underfed, scale bar = 100 µm, (I) CONTROL, (II) UNP, (III) UNL, (IV) UNPL. I′–IV′: high magnification images, scale bar = 10 µm, I′′–IV′′: Spermatogonial proliferation detected by Ki-67 immunostaining, showing intense (dark brown) in the basement of seminiferous tubules, in testis from adult rats that were born to mothers well fed or underfed. Final magnification at light microscope was 400. Scale bar = 10 μm.

SC number
SC number was higher in UNP (P < 0.0001), UNL (P < 0.0019), and UNPL (P < 0.0001) offspring compared to CONTROL, with the highest number of SCs observed in UNPL offspring (Fig. 2c).
Spermatogenesis
Strong immunopositivity of Ki-67 was detected in spermatogonial cells, and moderate immunopositivity was observed in spermatocytes (Fig. 2I′′). Computerized image analyses of strong immunopositive Ki-67 germ cells (taking in account that proliferating cells are spermatogonial germ cells) showed that the number of germ cells was higher in all undernourished groups compared to CONTROL offspring (UNP and UNPL, P < 0.0001; UNL, P = 0.0003) (Fig. 2II′′, III′, IV′′).
Frequency of stages of spermatogenic cycle
Undernutrition during pregnancy and lactation (UNP, UNL, and UNPL) decreased frequency of spermatogenic cycle V to VIII (P < 0.0001) (Fig. 3a). Specifically, stage VII (stage before beginning of spermiation) of the spermatogenic cycle was lower in frequency in male undernourished offspring compared to CONTROL offspring (P < 0.0001) (Fig. 3b).
Effect of maternal undernutrition of spermatogenic cycle: (a) frequency of stages of spermatogenic cycle in seminiferous tubules (pooled stages I–IV, V–VIII, and IX–XIV) and (b) frequencies of stage VII of the spermatogenic cycle (the stage before the onset of spermiogenesis) in testis of 160-day-old adult male rats that were born to mothers that were well fed or underfed. CONTROL: standard diet. UNP: mothers underfed during pregnancy. UNL: mothers underfed during lactation. UNPL: mothers underfed during both pregnancy and lactation. Values are mean ± SEM. Different letters among columns indicate significant differences (P < 0.05).

Localization of IGF-I immunoexpression
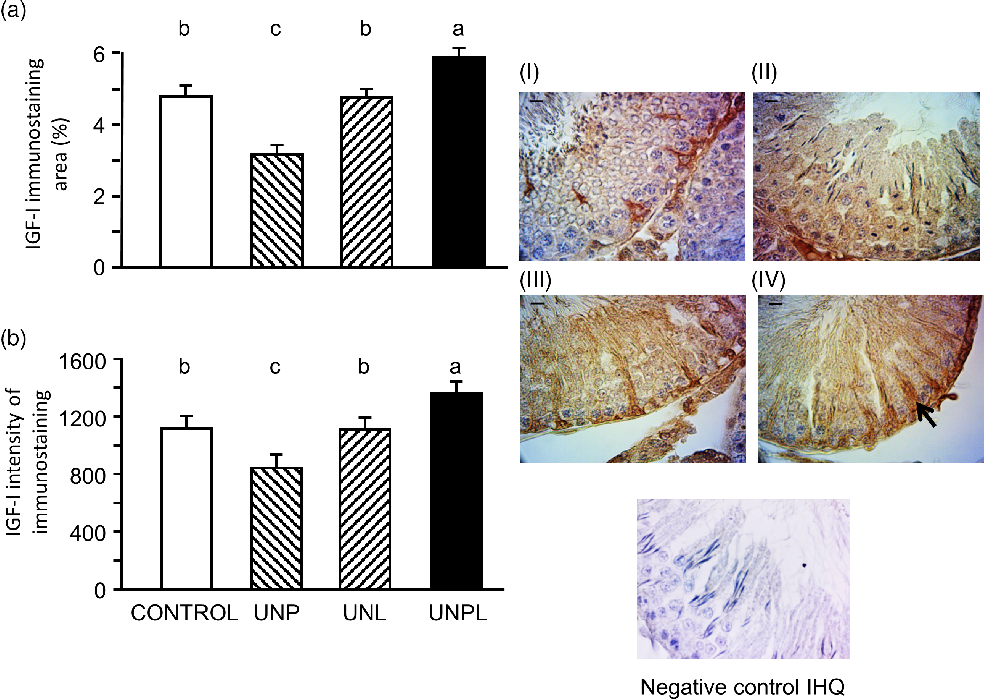
Immunoreactive IGF-I was detected in the seminiferous tubules, primarily in SCs, in spermatogonia and in elongated spermatids (but at lower intensity) in all offspring. In CONTROL offspring, IGF-I was localized in the perinuclear cytoplasm of SCs (Fig. 4a).
Effect of maternal undernutrition in IGF-I in testicular cells of adult male rats: (a) IGF-I immunostained area I (%) and (b) IGF-I immunostaining intensity (gray value pixels × 1000). Values are mean ± SEM. Different letters among columns indicate significant differences (P < 0.05). I–IV: Localization of IGF-I immunostaining in testis parenchyma in adult rats that were born to mothers that were well fed or undernourished. (I) CONTROL: standard diet, (II) UNP: mothers underfed during pregnancy, (III) UNL: mothers underfed during lactation, (IV) UNPL: mothers underfed during both pregnancy and lactation. SC immunostaining in males born to underfed mothers during pregnancy and lactation was intense from the basal region to the adluminal compartment (black arrow). Scale bar = 10 μm. Negative control of immunohistochemestry (IHQ).

In UNP, UNL, and UNPL offspring, IGF-I was also observed in the cytoplasm but extended in SC cytoplasm that extends from the basal region of the seminiferous tubules to the adluminal compartment (Fig. 4II, II, IV)
Within the interstitial tissue, IGF-I immunostaining was observed in the periphery of seminiferous tubules and in surrounding peritubular cells that showed weaker staining than SCs. IGF-I was also localized in interstitial cells, and weak staining was observed within Leydig cell cytoplasm compared to SCs in all undernourished groups (Fig. 4IV).
IGF-I immunostaining area and intensity
Overall, testicular IGF-I immunostaining area and intensity of immunostaining were greater in UNPL offspring (P = 0.0003) but lower in the UNP offspring compared to CONTROL (P < 0.0001) (Fig. 4a,b). Sertoli IGF-I immunostaining and intensity of immunostaining in UNL offspring were greater than UNP but less than UNPL and like CONTROL offspring (P < 0.0001) (Fig. 4III).
Immunoexpression of HSF1
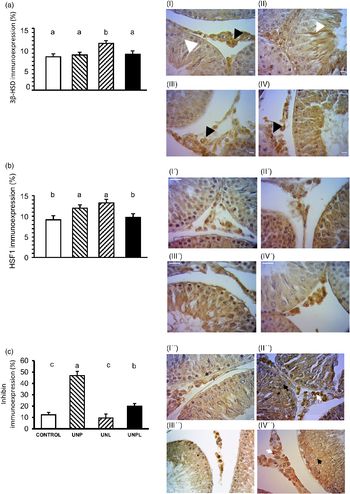
Quantification of steroidogenic enzyme 3β-HSD immunostaining area showed an increase in UNL offspring (P < 0.0001) (Fig. 5a). As well, an increase in the HSF1 was detected in UNL (P = 0.01), as well as in UNP offspring (P = 0.01) (Fig. 5b). Inhibin immunostaining was higher in UNP (P < 0.0001) and UNPL (P = 0.01) offspring compared to CONTROL (Fig. 5c).
Effects of maternal undernutrition in steroidogenic enzyme, heat shock protein, and inhibin in adult testis. Results of image analyses of immunostaining area for (a) 3β-HSD immunoexpression; (b) HSF1 immunoexpression; and (c) inhibin. Values are mean ± SEM. Different letters among columns indicate significant differences (P < 0.05). I–IV: immunohistochemistry images showing immunostaining for 3β-HSD. White arrow head shows intense immunostaining in SCs, and black arrow head shows intense Leydig cells immunostaining. I′–IV′: heat shock transcription factor protein HSF1. I′′–IV′′: Inhibin immunoexpression in Leydig cell (white arrow) and intense immunostaining in SCs in UNP group (black arrow). CONTROL: standard diet I, I′, I′′. UNP: mothers underfed during pregnancy II, II′, and II′. UNL: mothers underfed during lactation III, III′, and III′′. UNPL: mothers underfed during both pregnancy and lactation IV, IV′, and IV′′. Scale bar = 10 µm.

Immunoexpression of 3β-HSD
Positive immunostaining of steroidogenic enzyme 3β-HSD was observed in SCs as well as Leydig and spermatid cells (Fig. 5I, II, II, IV) in all offspring. HSF1 was found in Leydig cells as well as moderate immunostaining in SCs (Fig. 5I′, II′, III′, IV′).
Immunoexpression of inhibin
Inhibin immunostaining showed intense immunoexpression in SCs and Leydig cell cytoplasm in UNP and UNPL groups. A weaker inhibin immunostaining was detected in UNL and CONTROL groups (Fig. 5I′′, II′′, III′′, IV′′).
Transcript levels of IGF-I receptor (IGF1R) in the testis
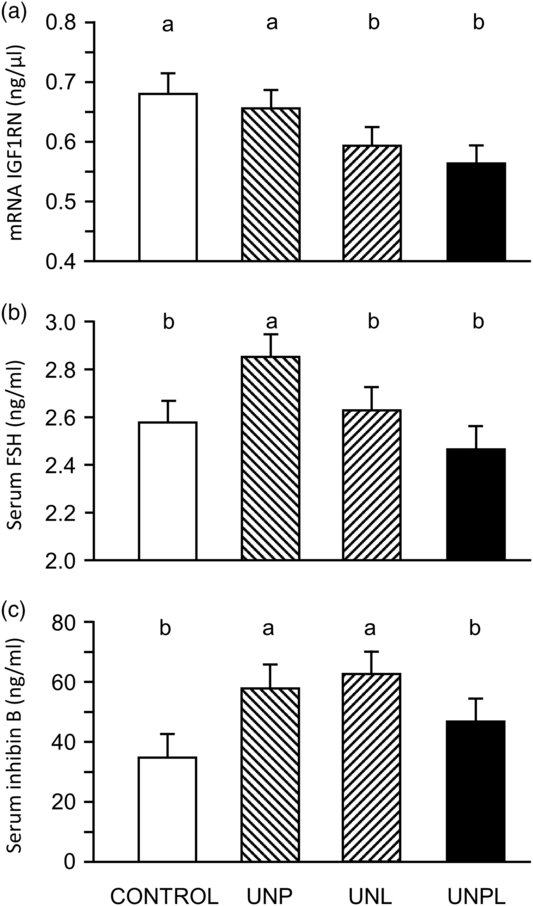
insulin-like growth factor I receptor (IGFIR) transcript levels were lower in UNPL and UNL offspring (P = 0.01) compared to CONTROL, but not UNP offspring (Fig. 6a).
Effects of maternal undernutrition in molecular parameters: (a) RNA IGF-I receptor transcript in testis (IGF1RN), (b) serum concentrations of FSH, and (c) serum concentrations of inhibin in adult (age 160 days) male rats that were born to mothers that were well fed or underfed. CONTROL: standard diet. UNP: mothers underfed during pregnancy. UNL: mothers underfed during lactation. UNPL: mothers underfed during both pregnancy and lactation. Values are mean ± SEM. Different letters among columns indicate significant differences (P < 0.05).

Plasma concentrations of FSH and inhibin beta
Plasma FSH concentrations were highest in UNP offspring, which were higher than CONTROL, UNPL, and UNL offspring (P = 0.05) (Fig. 6b). Plasma inhibin beta levels were highest in UNP (P = 0.01) and UNL (P = 0.003) offspring compared to CONTROL group and UNPL offspring. (Fig. 6c). UNPL and CONTROL offspring inhibin beta levels were similar.
Discussion
In the present study, we report that in male offspring of adult age, the effects of undernutrition of their mothers on the testicular IGF-I system depended on the timing of the exposure to the nutritional challenge.
Neonatal testicular development in the rat is vulnerable to changes in IGF-I concentration because IGF-I directly affects the proliferation and differentiation of germ cells, SCs, and Leydig cells. The source of testicular IGF-I is known to be SCs,Reference Hansson, Billig and Isgaard39 so the intratesticular milieu is significantly affected by IGF-I. The mitotic activity of SCs in the rat is most intense shortly before birth, around day 20 of gestation, and decreases steadily until 21 days after birth,Reference Orth40 after which proliferation ceases. It therefore seems likely that maternal undernutrition during pregnancy disrupts the most important period of SC development. Undernutrition during lactation, on the other hand, might have less marked effects because the SC proliferation is already in decline.
Maternal undernutrition during pregnancy (UNP) and both during pregnancy and lactation (UNPL) led to the greatest compromise of adult testis in the offspring. Undernutrition during prenatal development had greater effects on testicular IGF-I than undernutrition during either pregnancy + lactation or lactation alone. These observations are consistent with reports showing that maternal undernutrition decreases IGF-I serum concentrations.Reference Fazeli and Klibanski41,Reference Hawkes and Grimberg42 It seems that the neonatal testis is vulnerable to a decrease in maternal undernutrition during pregnancy and that the effects persist into adulthood. By contrast, when undernutrition was limited to lactation alone, with a return to adequate nutrition after weaning, there was no effect on testis IGF-I levels, although there was potential for a reduction in testicular responsiveness to IGF-I, as evidenced by a decrease in the amount of receptor IGF1R transcript.
Interestingly, the reduction in STD was more pronounced in the UNPL group, concomitant with high levels of IGF-I and low IGF receptor expression. Our view is that this reflects altered IGF-I sensitivity in this group, leading to so smaller testis size and related structural effects.
SC IGF-I is thought to regulate spermatogenesisReference Griffeth, Bianda and Nef43,Reference Neirijnck, Calvel and Kilcoyne44 through autocrine actions on its own receptors and through paracrine actions on germ cells,Reference Froment, Vigier and Negre45 so a reduction in IGF1 levels caused by maternal undernutrition would likely have negative consequences for sperm production in the offspring. Indeed, we observed reductions in all stages of the spermatogenic cycle in all undernourished groups, with the greatest effect at stage VII in males born to mothers underfed during pregnancy. Moreover, the height of spermatic epithelium and STD were also reduced by undernutrition during in pregnancy and pregnancy–lactation. Stage VII of the spermatogenic cycle, before the onset of spermiation, is the most frequently observed stage in the rat,Reference Hess, Schaeffer, Eroschenko and Keen34 although a 44% food restriction has been shown to affect stage VIII.Reference Horn, Ramos, Winkelmann, Matte, Goldani and Silveira46 Consistent with this observation is the improvement by exogenous IGF-I of spermatozoa morphology and motility in GH-deficient rats.Reference Vickers, Casey, Champion, Gravance and Breier29
Our observations of IGF-I immunostaining in germ cells are also consistent with its role in the regulation of germ cell proliferation and survival.Reference Borland, Mita and Oppenheimer47 Moreover, the increase in germ cell proliferation (evidenced by Ki-67) in offspring from underfed mothers suggests that, in the developing testis, germ cell mitotic activity increases to overcome the possible loss of spermatogenic capacity.
The implication of increased IGF-I observed in the UNPL group on testicular parameters may suggest an increase in testicular growth, but the testis actually showed a decrease in morphometric parameters. In the progeny from the UNPL group, the increased IGF-I intensity in the testis would be expected to promote testicular growth, yet there was a decrease in STD. The most logical explanation is that the responsiveness of the testicular cells to IGF-I was reduced by the low levels of IGF-I receptor expression.
Maternal undernutrition during pregnancy or lactation led to an increase in the number of SCs per cross section of seminiferous tubule. A feasible explanation is that, because the seminiferous tubules were shorter in both the UNP and UNPL groups, allowing more SCs to be detected per cross section, as previously reported for mice.Reference Jiang, Yin and Fan48
Finally, there is evidence of endocrine consequence of maternal undernutrition, especially during lactation, after which we observed increases in testicular immunostaining for 3β-HSD and HSF1, suggesting an elevation of steroidogenic capability. These observations are consistent with the role of IGF-I in the production of testosterone by Leydig cells.Reference Baker, Hardy and Zhou15,Reference Froment, Vigier and Negre45,Reference Moore and Morris49
In the offspring born to undernourished mothers, the onset of puberty was advanced, as seen previously with low birth weight humans and rats.Reference Sloboda, Howie, Pleasants, Gluckman and Vickers50 In adult offspring born to mothers that had been underfed during both pregnancy and lactation, body mass was reduced at age 160 days as well as at puberty, demonstrating the long-term programming effect of maternal undernutrition. In rats, puberty was defined as balano-preputial separation, it was detected earlier puberty in all groups from underfed mothers (UNP, UNL, and UNPL), but was most precocious in the offspring from the UNPL females. Indeed, in humans, both low birth weight and rapid weight gain between birth and 24 months were independently associated with an early onset of puberty, in both boys and girls. Moreover, rapid weight gain increased adiposity, thus increasing IGF-I concentration and eliciting insulin resistance, perhaps triggering early pubertal development by promoting the activity of the gonadotropin-releasing hormone (GnRH) pulse generator.Reference Chadio and Kotsampasi51,Reference Chadio, Katsafadou and Kotsampasi52 The link between early puberty and IGF-I is very strong in undernourished animals – in addition to determining testis morphology in later life, IGF-I regulates the onset of puberty through actions at brain level. In boys, these links might have major health consequences because the risk of testicular cancer is lower with late puberty.Reference Maule, Malavassi and Richiardi53
IGF-I signaling is intimately involved in the proliferation and differentiation of SCs and is therefore a major determinant of the number of SCs at puberty,Reference Pitetti, Calvel and Zimmermann25 itself a crucial determinant of adult fertility.Reference Monteiro, Luz, Castro, Paula and Loss54 We found that early-life undernutrition increased the number of SCs, suggesting that, under non-optimal conditions, SC proliferation can be stimulated and possibly contribute to a late-stage surge in testis mass and sperm output. However, we need to keep in mind that an increase in SC number does not necessarily translate to a healthy testis and may be associated with pathologies such as Sertolioma.Reference Sharpe, McKinnell, Kivlin and Fisher55,Reference Ciaputa, Nowak, Kiełbowicz, Antończyk, Błasiak and Madej56
When undernutrition was restricted to the prenatal period, there was a decrease in testicular IGF-I immunoexpression in the adult offspring. It is interesting that when maternal undernutrition continued throughout pregnancy and lactation, we found the opposite consequences and show an increase in IGF-I immunoexpression in testis.
As discussed above, IGF-I signaling is intimately involved in proliferation and differentiation of SCs and is a major factor regulating the number of SCs at pubertyReference Pitetti, Calvel and Zimmermann25 and their response to FSH,Reference Griffeth, Bianda and Nef57 two crucial determinants of adult fertility.Reference Monteiro, Luz, Castro, Paula and Loss54 It is therefore interesting that the consequences of maternal undernutrition during pregnancy or lactation were opposite to those of undernutrition during both pregnancy plus lactation where we observed an increase in IGF-I immunoexpression accompanied by an increase in the number of SCs in the testis. These findings suggest a compensatory effect of persistent undernutrition, with the activity of the IGF-1 system reduced, as evidenced by a decrease in transcript levels for IGF1 receptor. It is possible that the testis can show IGF-I resistance, as suggested by studies with GH and insulin resistance in models of undernutrition.Reference Fazeli and Klibanski41,Reference Friedrich, Thuesen and Jrøgensen58,Reference Belfiore, Frasca, Pandini, Sciacca and Vigneri59
The next step in this area should be a complete evaluation of offspring fertility, accompanied by a comprehensive analysis of IGFs and androgens in the circulation of males born to underfed mothers, and the molecular signaling pathways that might explain the effects on testicular IGF-I.
Conclusions
In the rat, pre- and postnatal undernutrition have window-dependent effects on testicular IGF-I in the offspring that cause long-term consequences in testis morphology including alteration in stages of spermatogenic cycle. Prenatal undernutrition has long-lasting effects decreasing testicular IGF-I, whereas the combination of pre- and postnatal undernutrition increases testicular IGF-I and decreases IGF-I receptors transcripts. Maternal undernutrition decreases the frequency of stage VII seminiferous tubules, showing clear morphological evidence of compromised spermatogenesis.
Author Contributions
DMS and MHV conceived and designed the experiments. GP and HV performed laboratory analyses and analyzed the data. GBM, GP, DMS, HV, MHV, and PL contributed reagents/materials/analysis tools. GP, GBM, MHV, DMS, and DC wrote the manuscript.
Acknowledgment
To Mónica Viqueira to her support and her laboratory help in our Department.
Financial Support
This research was supported by the Health Research of New Zealand, Gravida: Research Centre for Growth and Development and the CSIC Foundation, CSIC financial support grant 2016, University of the Republic, Uruguay. DMS hold a Canada Research Chair in Perinatal Programming.
Conflicts of Interest
The authors have no conflict to declare.
Ethical statement
The authors assert that all procedures contributing to this work comply with the ethical standards of the relevant national guides on the care and use of laboratory animals of the Animal Ethics Committee of the University of Auckland and has been approved by the institutional committee.