I. INTRODUCTION
Toxic ion pollution has become one of the most serious and urgent global concerns due to the highly toxic and great damage to the environment and the human health even at low concentrations. Reference Manez and Sancenon1–Reference Ulrich, Ziessel and Harriman7 As an example, a long-term exposure to Cu2+ with high concentration is highly toxic to the living organisms. Reference Sun, Yang, Wang, Shen, Xu, Sun, Li, Chen, Jiang, Ding, Kang, Xie and Jiang8–Reference Wu, Oo and Fan10 Excess Cu2+ in take may cause a mass of diseases, such as Alzheimer’s or Wilson’s disease. Reference Wood and Thompson6 With the aggravation of environmental pollution, people pay more attention to the analysis of the toxic ions in the environment. The design and development of ultra-sensitive detection methods for toxic ions have been an active area due to their potential applications in clinical biochemistry, chemistry, life sciences, medicine, and environmental detections. Reference Sun, Yang, Wang, Shen, Xu, Sun, Li, Chen, Jiang, Ding, Kang, Xie and Jiang8,Reference Yang, Zhao, Lu, Xu, Xu, Dong and Yu11–Reference Sun, Gao, Wu, Ren, Wei and Qu13 Moreover, it is an urgent task for us to establish a set of rapid detection methods of toxic ions in environmental samples.
A portable dry chemistry test paper provides a simple, convenient, rapid, method with sensible reaction and high accuracy Reference Sun, Yang, Wang, Shen, Xu, Sun, Li, Chen, Jiang, Ding, Kang, Xie and Jiang8,Reference Taki, Iyoshi, Ojida, Hamachi and Yamamoto9 compared with traditional detection methods, such as inductively coupled plasma atomic emission spectrometry (ICP-AES), inductively coupled plasma mass spectrometry (ICP-MS), flow injection-atomic absorption spectrometry (FI-AAS), electrochemical detection, and fluorescence probe methods. Reference Yang and Wang14–Reference Gholivand and Rashidi Nassab22 Portable dry chemistry test paper methods are suitable for the real-time detection of toxic ions. The detection method based on the fluorescence turn-off response shows a high signal-to-noise ratio. Reference Liu and Lin19,Reference Struss, Pasini, Ensor, Raut and Daunert23 In addition, fluorescence assays have some other advantages, such as high sensitivity, fast analysis, and high selectivity. Reference Pei, Zhu, Yang, Kong, Zheng and Qu24–Reference Zhao, Zheng, Kong, Xia and Qu30 More importantly, the detection ranges are wide with tunable limits.
In our previous work, we have demonstrated a fluorescent o-phenylenediamine-m-phenylenediamine copolymer sensing system for the detection of chromium(VI) ion (Cr6+). Reference Song, Sun, Yang, Zhao and Liao31 We also found that the o-phenylenediamine-m-phenylenediamine copolymer dots (omCPs) can serve as a very effective fluorescent probe for the detection of Cu2+ ions. What’s more, the detection limit can be modulated easily by adjusting the surface groups of these dots through the monomer dose control before co-polymerization. Due to the different doses, reactivity, and polymerization process of m-phenylenediamine and o-phenylenediamine, the amount of –NH2 groups in omCPs can be easily controlled (Scheme 1). The increased m/o ratio results in the increasing amount of –NH2 groups in omCPs. Most importantly, based on both the solid state photoluminescence (PL) and large linear detection range for Cu2+, a simple, rapid semiquantitative detection system for Cu2+ is developed based on the fluorescence turn-off response. This detection system can be facilely used like a pH testing paper and can determine the Cu2+ concentration within 1.0 s with a high signal-to-noise ratio and wide detection range (5–7 orders of magnitude). Moreover, we demonstrated that this new technological approach is suitable for the semiquantitative determination of other ion pollutants (i.e., Na+, K+, Cu2+, Pb2+, Hg2+, and NO2 −) in environmental water. Through contrast experiments with a national standard method, it is proved that the sensibility of the test paper is reliable. Six categories of o-phenylenediamine based copolymer dots can be used as fluorescent sensing platforms for the sensitive and selective detection of both the cation and anion. Based on the solid state PL and tunable detection limit, the solid simultaneous detection system for Na+, K+, Cu2+, Pb2+, Hg2+, and NO2 − was developed and demonstrated for the natural river water testing.
A schematic diagram of the structure of omCPs.

II. EXPERIMENTAL
A. Chemicals
NaCl, o-phenylenediamine (oPD), m-phenylenediamine (mPD), cysteine, KCl, (NH4)2S2O7, MgCl2, CaCl2, ZnCl2, CoCl2, NiCl2, CdCl2, Cu(NO3)2, Hg(NO3)2, Pb(NO3)2, Al(NO3)3, Fe(NO3)3, NaNO3, Na2SO4, Na2HPO4, NaH2PO4, and Na2CO3 were supplied by Aladdin Reagents (Shanghai, China) Co., Ltd. All chemicals are analytically pure and used as received without further purification. Deionized water (resistivity ∼18.2 MΩ cm, 25 °C) obtained through a Milli-Q system (Shanghai Mosu Science Instrument Co. Ltd., Shanghai, China) was used throughout all experiments.
B. Preparation of omCP-95
Typically, a 1.0 mL, 0.01 M oPD aqueous solution was added into a 19 mL, 0.01 M mPD aqueous solution. The mixture was transferred into a 25 mL Teflon-lined autoclave and heated and kept at 200 °C for 24 h cooled down to room temperature naturally. The product was filtered by a 0.02 µm microporous membrane, a yellow transparent filter solution was contained, and the black precipitates were wasted. The yield was about 73%. The solvent of suspension was removed with the aid of a rotary evaporator. And the omCP has an excellent solubility in many polar organic solvents or water with different pH levels.
C. Characterization methods
Transmission electron microscopy (TEM) measurements were carried out on a Hitachi H-8100 EM (Hitachi, Tokyo, Japan) with an accelerating voltage of 200 kV. Atomic force microscopy (AFM) measurements were carried out on a Bruker Dimension Icon AFM microscope (Bruker, Berlin, Germany). MALDI-TOF mass spectra were recorded on an ABI Voyager De pro spectrometer (Applied Biosystems, Tokyo, Japan). X-ray photoelectron spectra (XPS) were carried out on a PHI Quantera II system (Ulvac-PHI, Inc., Tokyo, Japan). Fourier transform infrared (FTIR) was performed on a Vertex 70 (Bruker; resolution 0.4 cm−1) infrared spectrometer and samples were dispersed in potassium bromide and compressed into pellets. The UV–vis spectra were obtained on a UV5800 spectrophotometer (YIMA Electrooptical Technology Co., Ltd., Shanghai, China). PL and photoluminescence excitation (PLE) spectra were recorded on a PerkinElmer LS55 luminescence spectrometer (PerkinElmer Instruments, Chicago, Illinois) at room temperature in an aqueous solution. Time-resolved fluorescence behavior was measured via the time-correlated single-photon counting (TCSPC) technique (Hydra Harp 400, Pico Quant, Wuhan, China). The samples were excited by a frequency-doubled titanium:sapphire oscillator laser with approximately a pulse duration of 150 fs and a repetition rate of 80 MHz (Chameleon, Coherent Inc., Santa Clara, California). Fluorescence emission was sent to a spectrometer (iHR550, Horiba Jobin Yvon, Paris, France) with 300/mm grating and then detected by a photomultiplier tube. The time-resolved PL curves were fitted with a bi-exponential decay.
As the most direct and important index, the quantum yield (φ) of omCP was calculated according to Eq. (1),
 $${\rm{\varphi }} = {{\rm{\varphi }}_{\rm{R}}} \times {I \over {{I_{\rm{R}}}}} \times {{{A_{\rm{R}}}} \over A} \times {{{{\rm{\eta }}^2}} \over {{\rm{\eta }}_{\rm{R}}^2}}\quad,$$
where I is the measured integrated emission intensity, η is the refractive index of the solvent, A is the optical density, and the subscript R refers to the reference standard with a known φ (RhB in ethanol solution, φR = 0.68). To minimize reabsorption effects, absorbance was kept under 0.1 at 360 nm excitation wavelength in a 10 × 10 mm fluorescence cuvette.
III. RESULTS AND DISCUSSION
A. Structural characterization
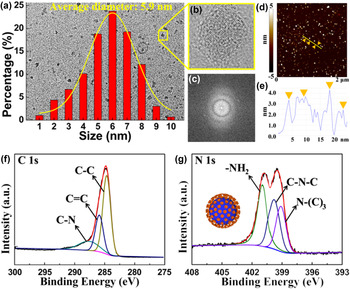
Figure 1(a) shows the low magnification TEM image and corresponding size distribution histogram of the omCPs (m/o = 95:5, omCP-95) thus formed. Homogenous dots with a size distribution of 1–10 nm and an average diameter of 5.9 nm are found according well to Gaussian distribution. Figures 1(b) and 1(c) show a representative high-resolution TEM image and the corresponding fast Fourier transform (FFT) result of an individual omCP-95 particle. It is clear that there are no crystalline structures and diffraction patterns, which indicate that there are the amorphous structure of omCP-95 particles. Reference Liu, Tian, Wang, Zhang, Qin, Luo, Asiri, AlYoubi and Sun2 AFM observations [Figs. 1(d) and 1(e)] show highly dispersed omCP-95 on the silicon substrate with a typical topographic height of 2.5–4.5 nm. The AFM data indicate that the omCP-95 is a nano-sized sphere or ellipsoid. The small size of omCP-95 can be due to the high concentration of phenylenediamine (total concentration is 10 mM).
(a) Low magnification TEM image and corresponding size distribution of omCPs. (b) High-resolution TEM image of a single omCP particle in (a). (c) FFT of a single omCP particle in (a). (d) AFM topography image of omCPs on a mica substrate in the tapping mode (Bruker Dimension Icon AFM microscope), (e) height profile analysis along the line shown in the image. High-resolution (f) C 1s and (g) N 1s XPS spectra of omCPs.

The XPS and FT-IR spectra were conducted to verify the structure of omCP-95. The XPS survey spectrum [Fig. S1(a)] shows a predominant narrow C 1s peak at approximately 284 eV, along with a N 1s peak at approximately 399 eV. The N/C atomic ratio was 29.62%. Figure 1(f) shows the well-fitted high-resolution C 1s XPS spectrum of omCP-95, which confirms the presence of C–N bonds (285.2 eV). Reference Li, Liu, Yang, Wang, Zhang and Zhu32–Reference Li, Yang, Sun, He, Xu and Ding35 In addition, the high-resolution N 1s spectrum of omCP-95 [Fig. 1(g)] reveals the presence of –NH2 (NAm, 401.5 eV), C–NH–C (NPa, 399.8 eV), and N–(C)3 (NAr, 398.9 eV), Reference Li, Liu, Yang, Wang, Zhang and Zhu32,Reference Song, Yang, He, Yan and Liao36,Reference He, Sun, Tian, Yang, Ding, Ding, Xie and Jiang37 with atom percentages of 47.8% (NAm/N), 30.4% (NPa/N), and 21.8% (NAr/N), respectively.
The FT-IR spectrum of omCPs is shown in Fig. S1(b). The adsorption peaks at 3321, 3240, and 3210 cm−1 correspond to the NAm stretching mode, which implies the presence of NPa. Reference Dai, Long, Wang, Wang, Gu, Jiang, Wang, Li, Zeng, Sun and Zeng38 The strong peaks at 1601 and 1536 cm−1 are assigned to C–N and C–C stretching vibrations in a phenazine structure, respectively. The peaks at 1239 and 1370 cm−1 are associated with the C–N stretching in the benzenoid and quinoid imine units. Reference Dai, Long, Wang, Wang, Gu, Jiang, Wang, Li, Zeng, Sun and Zeng38–Reference Yano and Nagaoka40
MALDI-TOF-MASS spectra were carried out for further understanding of the structure of the products thus obtained. As shown in Fig. S1(c), the peaks located at m/z = 211.54, 215.38, 321.33, 317.84, 423.97, 427.65, 419.67, 510.88, 529.91, 616.94, 636.01, 727.21, 741.61, 844.29, and 847.29 can be attributed to the oligomers of o-phenylenediamine-m-phenylenediamine copolymer in omCP-95 (the corresponding molecular structures of these amide compounds are shown in Fig. S2). This result is consistent with the previous results about poly-(o-phenylenediamine) and poly-(m-phenylenediamine). Reference Jeroschewski, Steuckart and Kuhl41–Reference Yang and Liao43 Thus, it is clear that the omCP-95 is comprised of intertwined polymer chains of oligomers (Scheme 1). The intertwined polymer chains result in the amorphous structure of omCP-95. Moreover, the XPS and FT-IR results show that there are three kinds of nitrogen-containing groups: –NH2, C–N–C, and N–(C)3, with atom percentages of 47.8%, 30.4%, and 21.8%, respectively.
B. Optical characterization
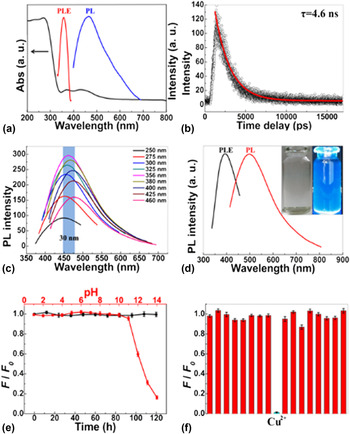
The UV–vis absorption (black curve), PLE (red curve), and PL (blue curve) spectra of omCP-95 are shown in Fig. 2(a). The UV–vis spectrum shows that there are three absorption peaks. The peak at 200–270 nm can be ascribed to the π–π* transition of the conjugate structure of omCP-95. Reference Zhang, Yang, Sun, Li, He, Yan, Kang, Hu and Liao44 The significant absorption peak at approximately 360 nm indicates that there are the n–π* transition of NAm in the conjugate structure. Reference Liao, Yang, Li, Yang, Xie, Hu, Yan, Ren and Liu45 Moreover, the absorption peak at approximately 434 nm can be attributed the n–π* transition of NAr. Reference Dai, Long, Wang, Wang, Gu, Jiang, Wang, Li, Zeng, Sun and Zeng38,Reference Li, Wu, Yang, Peng, Zhao and Zhu46,Reference Gokhale and Singh47
(a) Normalized UV–vis absorption (black curve), PLE (red curve λem = 460 nm), and PL (blue curve λex = 356 nm) spectra of omCP-95 aqueous solution. (b) PL decay curves of omCP-95 aqueous solution measured at room temperature with λem = 460 nm. (c) PL spectra of omCP-95 aqueous solution at room temperature when λem is 250, 275, 300, 320, 356, 380, 400, 425, and 450 nm, respectively. (d) PLE (black curve) and PL (black curve) spectra of omCP-95 in the solid state, inset: photographs of omCP-95 aqueous solution under visible light (left) and 365 nm UV light (right). (e) Photostability (black curve) of omCP-95 under UV light (150 W Xe lamp with a center wavelength of 320 nm). F 0 and F are initial (t = 0), and specific time, PL intensities, respectively. Red curve shows the pH-stability of omCP-95; F 0 and F are initial (pH = 7.0), and specific pH, PL intensities, respectively. (f) The difference in the PL intensity of omCP-95 between the blank and solutions containing different metal ions (F 0 and F are PL intensities in the absence and presence of these ions, respectively). The ions are Na+, K+, Mg2+, Ca2+, Zn2+, Co2+, Ni2+, Cd2+, Hg2+, Pb2+, Al3+, Fe3+, Cl−, NO3 −, SO4 2−, and CO3 2− (left to right). The concentration of ions and omCP-95 is 0.5 M and 0.5 mg mL−1, respectively.

The PLE spectrum shows one peak at 356 nm, which corresponds to the n–π* transition of amino-groups in a UV–vis peak at 360 nm. For the PL spectroscopy, the maximum emission wavelength (λem) is 460 nm. The quantum yield (φ) of omCP-95 is 0.94, which is much higher than carbon based “quantum dots” and could be matched with fluorescent dyes or semiconductor quantum dots (Table S1, 2). The Stokes shift (ΔνSt) and full-width half-maximum (FWHM) were 0.59 and 0.71 eV, respectively. This indicated that the omCP-95 had a weak self-absorption effect and low energy loss. Reference Li, Liu, Yang, Wang, Zhang and Zhu32,Reference Yang, Liu, Liao, Guo, Wu and Zhang48,Reference Li, Hu, Zhao, Shi, Deng, Hou and Qu49 Moreover, the narrowing of FWHM (which was smaller than that in graphene quantum dots, carbon dots, or polymer dots) indicated the presence of unified chromophores (NAm) in omCP-95.
The PL decay of omCP-95 was measured by a time-correlated single photon counting technique and fitted well with a bi-exponential decay as shown in Fig. 2(b). The lifetime (τ) is dominant with a long decay component 4.8 ns (93%) plus a small contribution from short decay 1.9 ns (7%); the weighted-average lifetime is about 4.6 ns. We can obtain the radiative rates κr to combine φ and τ by κr=φ/τ. Reference Liao, Yang, Li, Yang, Xie, Hu, He, Kang, Song and Ren50,Reference Mao, Zheng, Long, Du, Hao, Wang and Zhou51 The fluorescence radiative rate κr is 2.04 × 10⁸ s−1. The high κr implies a high electronic transition probability in the omCP-95, which confirms that the aforementioned transition is an n–π* transition model. Previous reports suggested that the excitation wavelength dependence is a common phenomenon of carbon based quantum dots which can be due to the diversified chromophores. However, when λex increased from 250 to 450 nm, the emission peak of omCP-95 just had a maximum red shift of 30 nm [Fig. 2(c)]. This phenomenon also confirmed that the omCP-95 have unified chromophores. Reference Taki, Iyoshi, Ojida, Hamachi and Yamamoto9
The omCP-95 also shows strong fluorescence in a solid state at room temperature. As shown in Fig. 2(d), the PL spectrum in the solid state shows the maximum λem at 392 nm and λex at 497 nm, which is red-shifted compared with that of the omCP-95 aqueous solution. This can be due to the aggregation of omCP-95 in the solid state. Reference Anilkumar, Wang, Cao, Sahu, Liu, Wang, Korch, Tackett, Parenzana and Sun52 This indicates that the omCP-95 has a good prospect of applications in solid PL sensors.
The stability and anti-jamming performance of omCP-95 are also very important in practical applications. The omCP-95 showed an excellent stability after continuous excitation under ultraviolet radiation [150 W Xe lamp with center wavelength at 320 nm, 120 h, see the black curve in Fig. 2(e)]. Moreover, the omCP-95 also shows a good stability when pH is 1–11 [see the red curve in Fig. 2(e)]. The significant quenching behavior when pH is 12–14 can be attributed to the destroying effect of the molecule structure in strong alkali conditions. The anti-jamming performance of omCP-95 is shown in Fig. 2(f). The PL intensity of omCP-95 shows no change with the presence of various ions (Na+, K+, Mg2+, Ca2+, Zn2+, Co2+, Ni2+, Cd2+, Hg2+, Pb2+, Al3+, Fe3+, Cl−, NO3 −, SO4 2−, and CO3 2−). The dramatic quenching behavior can be observed with the presence of Cu2+, which indicates the omCP-95 can be used as a PL sensor for the detection of Cu2+.
C. Tunable sensing performance
Based on above results, we explore the feasibility of using omCP-95 for Cu2+fluorescence detection. It is obvious that Cu2+ can strongly quench the intrinsic fluorescence of omCP-95 [Fig. 3(a)]. The fluorescence quenching data follow the Stern–Volmer equation,
 $${{{F_0}} \mathord{\left/ {\vphantom {{{F_0}} F}} \right. \kern-\nulldelimiterspace} F} - 1 = {K_{{\rm{sv}}}}c\quad ,$$
where K sv is the Stern–Volmer quenching constant, c is the analyte (Cu2+) concentration, and F 0 and F are PL intensities of omCP-95 in the absence and presence of Cu2+, respectively. The plot shown in inset of Fig. 3(a) fits a linear equation over the concentration range 2.0 × 10⁻¹³ to 3.0 × 10⁻¹² M. The correlation coefficient (r 2) is 0.9979 when determining Cu2+ over the linear concentration range 2 × 10⁻¹³ to 3 × 10⁻¹² M. The detection limit is estimated to be 5 × 10⁻¹⁴ M at a signal-to-noise ratio of 3. This detection limit is much lower and the quenching behavior is rapid. As shown in Fig. 3(b), the PL intensity decreases after the addition of Cu2+ within 1 s, and no obvious fluorescence change is observed after 1 s. The rapid response can be due to the fast mass transfer process in omCP-95 with a small size.
(a) PL spectra of the omCP-95 aqueous solution with different concentrations of Cu2+ (2 × 10⁻¹³ to 2 × 10⁻¹¹ M) with λem = 460 nm at 25 °C and pH = 7. The concentration of omCP-95 was 0.5 mg mL−1. Inset: linear fitting of the Stern–Volmer plot of the PL intensity at 460 nm for different Cu2+ concentrations (2 × 10⁻¹³ to 3 × 10⁻¹² M). (b) PL intensity of omCP-95 and omCP-NS in a 460 nm aqueous solution in a different time after Cu(NO3)2 was added (the concentration of Cu2+ was 1 × 10⁻¹² M). F 0 and F are initial (t = 0), and specific time, PL intensities, respectively. Inset: partial enlarged plot of omCP-95. (c) The lifetime of omCP-95 plotted against the concentration of Cu2+, where τ0 and τ are the fluorescent lifetimes in the absence and presence of Cu2+, respectively. (d) The PL spectra of omCP-95 (black curve), omCP-95 and Cu2+ (concentration of Cu2+ was 2 × 10⁻¹¹ M, red curve), and mixture of omCP-95, Cu2+, and EDTA (concentration of Cu2+ was 2 × 10⁻¹¹ M, concentration of EDTA was 1 × 10⁻⁹ M, blue curve). (e) Photographs of omCP-95, omCP-80, omCP-65, omCP-50, omCP-35, omCP-25, omCP-20, and omCP-05 aqueous solution with different concentrations of Cu2+ (concentrations of Cu2+ were 5 × 10⁻¹³, 5 × 10⁻¹², 5 × 10⁻¹¹, 5 × 10⁻¹⁰, 2 × 10⁻⁹, and 2 × 10⁻⁸ M) 365 nm UV light. The concentrations of omCP-95, omCP-80, omCP-65, omCP-50, omCP-35, omCP-25, omCP-20, and omCP-05 are all 0.5 mg mL−1. (f) A diagram of the detection limit (red) and linearity range (blue) of omCP-95, omCP-80, omCP-65, omCP-50, omCP-35, omCP-25, and omCP-20.

The mechanism of quenching progress is presumably via electron or energy transfer. Reference Yang, Huang, Liu and Liao53 The binding ways between Cu2+ and omCP-95 may be the strong coordination interactions between Cu2+ and –NH2 groups, which is the character of static quenching. Lifetime measurements with different amounts of Cu2+ are carried out for evidence of the quenching mechanism. In static quenching, τ does not change (τ0/τ = 1) where τ0 and τ are the fluorescence lifetimes in the absence and presence of Cu2+, respectively. Reference Zhao, Zhang, Han, Qiao, Li, Jian, Shen and Yu54–Reference Cheng, Silvester, Wang, Kalyuzhny, Douglas and Murray57 Fig. 3(c) shows typical results for the effect of Cu2+ concentration on the τ of omCP-95. The τ of omCP-95 did not change (τ0/τ = 1) upon Cu2+ addition over the concentration from 2 × 10⁻¹³ to 7 × 10⁻¹¹ M. This suggests that the quenching behavior is static quenching. Moreover, when a strong Cu2+ chelator (such as EDTA) is added, Cu2+ is removed from the surface of omCP-95, which results in the PL recovery of omCP-95 [Fig. 3(d)]. This efficient PL recovery strongly confirms the above-mentioned quenching mechanism.
All above results show that the omCP-95 can be used as an ultrasensitive rapid fluorescent probe for Cu2+ with good stability and anti-jamming performance. However, the concentration of Cu2+ is diversified in the practical application. Then the arrow linear concentration range makes the omCP-95 have poor adaptability for samples with a wide concentration range of Cu2+.
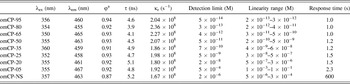
We further developed a detection system based omCPs with different detection limits and linear concentration ranges via changing the proportion of reactants in preparation progress. Figure 3(e) shows the digital images of omCPs with different detection limits in aqueous solutions with the presence of different concentrations of Cu2+ (10−13–10−8 M) under UV-light (365 nm). When the m/o ratio is 95:5, the PL of obtained omCPs (omCP-95) can be quenched when the concentration of Cu2+ is 10−13 M. However, when the m/o ratio is 80:20, 65:35, 50:50, 35:65, 25:75, 20:80, and 5:95, the PL of obtained omCPs (omCP-80, omCP-65, omCP-50, omCP-35, omCP-25, and omCP-20) can be quenched when the concentration of Cu2+ is 10−12, 10−11, 10−10, 10−9, 10−8, and 10−7 M, respectively. Moreover, the omCP-05 (m/o ratio is 5:95) shows a low detection limit (5 × 10⁻⁴ M). The PL properties of these omCPs are shown in Table I and Fig. S3–S8. The detection limit of omCP-95, omCP-80, omCP-65, omCP-50, omCP-35, omCP-25, and omCP-20 is 5 × 10⁻¹⁴, 3 × 10⁻¹³, 4 × 10⁻¹², 5 × 10⁻¹¹, 7 × 10⁻¹⁰, 5 × 10⁻⁹, and 2 × 10⁻⁸ M, respectively, which covers 7 orders of magnitude in turn. The linear concentration range of these omCPs is continuous (from 2 × 10⁻¹³ to 3 × 10⁻⁶ M), which covers 8 orders of magnitude [Fig. 3(f)]. The broad linear concentration range indicates that these omCPs have good adaptability for various samples with a different concentration of Cu2+. We also prepared the poly(m-phenylenediamine) (omCP-100) and poly(o-phenylenediamine) (omCP-0) dots. The omCP-100 is non-fluorescence which can’t be used as a fluorescent probe due to its flexibility molecular structure. Reference Yano and Nagaoka40,Reference Jeroschewski, Steuckart and Kuhl41 On the other hand, the omCP-0 shows a low detection limit (3 × 10⁻⁴ M) in accordance with the above law.
PL performances of omCP-95, omCP-80, omCP-65, omCP-50, omCP-35, omCP-25, omCP-20, omCP-05, and omCP-NS.

a Quantum yield was calculated using those of Rhodamine B (φ = 0.68) in EtOH as a standard.
D. Mechanism of tunable sensing performance
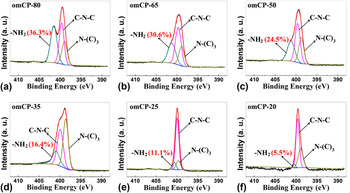
The XPS was used to further understand the change of detection limits. All these omCPs have the same N/C atomic ratio (25%) since both monomers have the same nitrogen content in their molecules. Figure 4 shows the high-resolution N 1s spectra of omCP-80, omCP-65, omCP-50, omCP-35, omCP-25, and omCP-20. All these well-fitted spectra can be divided into three different peaks, which are assigned to NAm at 401.5 eV, NPa at 399.8 eV, and NAr at 398.9 eV. The NAm/N ratio of omCP-80, omCP-65, omCP-50, omCP-35, omCP-25, and omCP-20 is 36.3%, 30.6%, 24.5%, 16.4%, 11.1%, and 5.5%, respectively. The change of NAm/N ratio can be due to the different reactive of o-phenylenediamine and m-phenylenediamine, as shown in the sketch map of Scheme 1. It is clear that the detection limit is lower when the NAm/N ratio decreased. The detection limit is 2 × 10⁻⁸, 5 × 10⁻⁹, and 7 × 10⁻¹⁰ M when the NAm/N ratio is 5.5%, 11.1%, and 16.4%, respectively (Fig. 4). These results confirm that NAm can dramatically improve the detection limit of omCPs.
High-resolution N 1s spectrum of (a) omCP-80, (b) omCP-65, (c) omCP-50, (d) omCP-35, (e) omCP-25, and (f) omCP-20.

We also studied the effect of NPa on the detection limit. The omCPs with a different NPa/N ratio and same N/C and NAm/N ratio are synthesized for comparison [see red curve in Fig. 4(a)]. The omCPs with a different NPa/N ratio and same N/C and NAm/N ratio are synthesized by changing the reaction time with the same m/o ratio (65:35, same with omCP-65). When the reaction time is longer (72 h), the obtained omCPs have a lower NPa/N ratio (15.8%). On the other hand, when the reaction time is 2 and 6 h, the NPa/N ratio is 41.6 and 36.9%, respectively, which is much higher than omCP-65. The detection limits of these products show an obvious change. The detection limit is 5 × 10⁻¹², 3 × 10⁻¹², 4 × 10⁻¹², and 3 × 10⁻¹² M when the reaction time is 2, 6, 24, and 72 h, respectively.
Based on the results of the quenching mechanism, XPS, and standard comparison experiments, the working mechanism of omCPs is as follows. Rapid strong coordination interactions between Cu2+ and the surface groups of omCPs result in the static quenching of omCPs. The rapid response can be due to the fast mass transfer process in omCPs in small sized particles. The NAm is an active surface group in the quenching mechanism which has a great effect on the detection limit. Due to the different reactivity and polymerization process of m-phenylenediamine and o-phenylenediamine, the amount of NAm in omCPs can be easily controlled by changing the m/o ratio (Scheme 1). The increased m/o ratio results in the increasing amount of NAm in omCPs. The omCPs can be easily quenched by Cu2+ with low concentration, with the increasing amount of NAm (47.8–5.5%). Thus the detection limit increased obviously (5 × 10⁻¹⁴–2 × 10⁻⁸ M). The detection limit of omCPs is low conversely. Moreover, the NPa and NAr groups have no effect on the detection limit.
E. Construct and application of rapid semiquantitative detection system
All above detection progresses of omCPs are based on the standard curve method and fluorescence spectrophotometers, which are the same as traditional fluorescent probes. Here, we explored a simple, rapid semiquantitative detection system for Cu2+ based on the fluorescence in the solid state of omCPs and their tunable detection limits. First, a water sample was dropped on the test papers for 10 s with different detection limits. Then, the water sample was removed. Finally, the dried test papers were put under UV light and show the concentration range of Cu2+. As shown in Fig. 5(a), first 1.0 mL, 0.2 mg mL−1 various omCPs aqueous solutions are dripped on the filter papers (the size is 2 × 2 cm), then the content of omCPs is 50 μg cm−2 after drying. The obtained test papers show the bright blue-green fluorescence and same quenching behavior as omCPs aqueous solutions. The fluorescence of the test paper with omCP-95 can be quenched effectively when the concentration of Cu2+ is 3 × 10⁻¹⁴ M. Moreover, the fluorescence of test papers with different omCPs (omCP-80, omCP-65, omCP-50, omCP-35, omCP-25, and omCP-20) can be quenched effectively when the concentration of Cu2+ is 3 × 10⁻¹³, 2 × 10⁻¹², 1 × 10⁻¹¹, 2 × 10⁻¹⁰, 3 × 10⁻⁹, and 2 × 10⁻⁸ M, respectively. This indicates that these test papers can be used in the semiquantitative detection of Cu2+. As shown in Fig. 5(b), 7 different kinds of test papers (omCP-95, omCP-80, omCP-65, omCP-50, omCP-35, omCP-25, and omCP-20) with different detection limits (3 × 10⁻¹⁴, 3 × 10⁻¹³, 2 × 10⁻¹², 1 × 10⁻¹¹, 2 × 10⁻¹⁰, 3 × 10⁻⁹, and 2 × 10⁻⁸ M) are cleaved on the slide. Then, the slide is put into the sample (river water). The fluorescence of test papers with omCP-95, omCP-80, and omCP-65 is quenched, which indicates that the concentration of Cu2+ is 3 × 10⁻¹³–2×10⁻¹² M. This detection system is based on fluorescence turn-off response which has a high signal-to-noise ratio. Moreover, the detection range (7 orders of magnitude) is much wider than previous reports.
(a) A scheme of detection progress of the semiquantitative detection system for Cu2+ based on the fluorescence in the solid state of omCPs and their tunable detection limits. First, the water sample was dropped on the test papers for 10 s with different detection limits. Then, the water sample was removed. Finally, the dry test papers were put under UV light and show the concentration range of Cu2+. (b) Photographs of test papers loaded with omCP-95, omCP-80, omCP-65, omCP-50, omCP-35, omCP-25, and omCP-20 with different concentrations of Cu2+ (concentrations of Cu2+ were 2 × 10⁻¹³, 2 × 10⁻¹², 2 × 10⁻¹¹, 2 × 10⁻¹⁰, 2 × 10⁻⁹, 2 × 10⁻⁸, and 2 × 10⁻⁷ M, respectively) and 365 nm UV light. (c) and (d) Practical application of the semiquantitative detection system for Cu2+ of river water. (e) A map of the Jialing River in Nanchong, China and the concentrations of Cu2+ in different place were showed. (f) A map of the Suzhou River in Shanghai, China and the concentrations of Cu2+ in different place were showed.

Next, the rapid semiquantitative method and standard curve method are used in combination for practical applications and compared with the results of flame atomic absorption spectrometry (FAAS). 12 river water samples from the Jialing River (Nanchong, Sichuan, China) and the Suzhou River (Shanghai, China) without pretreatments are chosen to evaluate the accuracy of this detection system [Figs. 5(c) and 5(d)]. Clearly, the concentration of Cu2+ downstream is higher than that upstream. Moreover the concentration of Cu2+ in the Suzhou River is 2 orders higher than the Jialing River’s. The error margin of this semiquantitative method is ±1.5 % compared with the results of FASS.
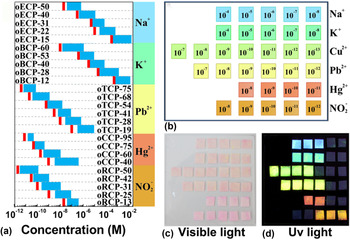
We provided this new technological approach for the fast and convenient detection of other ions. Five categories of o-phenylenediamine based copolymer dots were synthesized. The o-phenylenediamine-bis (2-chloroethyl) ether (oECP), o-phenylenediamine-1,2-bis(2-chloroethoxy) ethane (oBCP), o-phenylenediamine-thiourea (oTCP), and o-phenylenediamine-cysteine (oCCP) dots can be used as a fluorescent turn-off sensor for Na+, K+, Pb2+, and Hg2+, respectively. Moreover, the o-phenylenediamine-Rhodamine B copolymer (oRCP) dots display a fluorescence turn-on response to NO2 − which indicates that oRCPs also can be used as a fluorescent sensor for nitrite. Reference Zhu, Zhang, Tang, Qiao, Wang, Wang, Liu, Li, Li, Yu, Wang, Sun and Yang58 When the mole ratio of substrates changed, the obtained products show different detection limits and linearity range [Fig. 6(a)]. The linear concentration ranges of oECP, oBCP, oTCP, oCCP, and oRCP cover 6, 7, 6, 4, 5, and 6 orders of magnitude, respectively. Thus, the solid simultaneous detection system for Na+, K+, Cu2+, Pb2+, Hg2+, and NO2 − was build based on oECP, oBCP, omCP, oTCP, oCCP, and oRCP with tunable detection limits and fluorescent in the solid state [Fig. 6(b)]. Then, the slide with test papers was put into the sample. The fluorescence of test papers with oECP-22, oECP-15, oBCP-28, oBCP-12, omCP-95, omCP-80, omCP-65, oTCP-28, oTCP-19, oCCP-60, and oCCP-40 was quenched [Figs. 6(c) and 6(d)], which indicates that the concentration of Na+, K+, Cu2+, Pb2+, and Hg2+ is 5 × 10⁻⁷–5 × 10⁻⁶, 4 × 10⁻⁷–2 × 10⁻⁶, 3 × 10⁻¹¹–2 × 10⁻¹⁰, 2 × 10⁻¹¹–2 × 10⁻¹⁰, and 3 × 10⁻¹⁰–4 × 10⁻⁹ M, respectively. The fluorescence of test papers with oRCP-31, oRCP-25, and oRCP-13 was enhanced, which indicates that the concentration of NO2 − is 3 × 10⁻¹⁰–2 × 10⁻⁹ M.
(a) Diagram of the detection limit (red) and linearity range (blue) of oECP, oBCP, oTCP, oCCP, and oRCP. (b) Diagram of the solid simultaneous detection system for Na+, K+, Cu2+, Pb2+, Hg2+, and NO2 −. Digital photos of the solid simultaneous detection system under (c) visible light and (d) 365 nm UV light.

IV. CONCLUSION
In summary, omCPs with designed surface groups are synthesized. Based on the solid state PL and tunable detection limit, the solid simultaneous detection system for Cu2+ with a high signal-to-noise ratio and wide detection range (5–7 orders of magnitude) was developed and verified by the natural river water testing. Our new technological approach is suitable for the fast and convenient detection of other toxic ions. Moreover, this work provides a new technological approach for sensors with tunable limits.
Supplementary Material
To view supplementary material for this article, please visit https://doi.org/10.1557/jmr.2017.90.
ACKNOWLEDGMENTS
Shizhen Zhao and Siwei Yang contributed equally to this work. We are grateful to the open project fund of Chemical Synthesis and Pollution Control Key Laboratory of Sichuan Province (CSPC2016-1), National Science and Technology Major Project (2011ZX02707), and the Chinese Academy of Sciences (KGZDEW-303) for generous support of this work.