Introduction
Radiotherapy (RT) plays an important role in the local treatment of some cancer diseases. The optimal treatment plan is established according to volume and localisation of the tumour for the treatment. The best way to achieve this goal is to direct the radiation dose to the target volume and to ensure that normal tissues are affected by radiation to a minimum extent.
The developments in RT procedures in the recent years have increased the survival rates of the patients, so the presence of late side effects of the dose given to normal tissues has become an increasing matter of concern.Reference Marks, Ten Haken and Martel 1 A better understanding of the side effects of RT is important not only for the high doses given to targeted volumes but also for the control of undesirable but unavoidable low doses other than the target. The studies conducted for estimating out-of-field doses until today have focused on photon bundles.Reference Xu, Bednarz and Paganetti 2 , Reference Taylor and Kron 3 Following treatment of the breast with photon tangents, the tumour bed and surgical scar are often boosted with electrons. However, electron beams are important components of RT for the treatment of superficial tumours (depth <5 cm),Reference Gerbi, Antolak and Deibel 4 such as breast RT. An applicator is used to direct and limit the beams at the targeted area in the high-energy electron beam at RT (4–25 MeV). Various electron applicators are used in clinical routines. The design and materials of these applicators differ according to the manufacturer. Applicators are designed to minimise the leakage of the scattered electrons and transmitted radiation from the treatment site as little as possible. In addition to this, it is known that the part of the scattered and transmitted radiation that cannot be neglected leaks from the applicators and causes undesirable doses outside the treatment area.Reference Huizenga and Storchi 5– Reference Yeboah, Karotki, Hunt and Holly 11 The accuracy and efficacy of treatment in breast RT should involve accurate measurement of target and local surrounding tissue doses. Due to the excellent dosimetric properties, for example, the wide range of linearity of dose characteristic, the good lowest detection limit, near tissue equivalence and the low energy dependence the BeO detectors are predestined for dosimetric use. The dosimetric properties of the material BeO were already examined in previous investigations.Reference Sommer, Jahn and Henniger 12 Furthermore doses in experiments with various particle radiation, for example, β and 12C, were investigated with BeO detectors.Reference Moeckel, Mueller, Pawelke, Sommer, Will and Enghardt 13
It is very important to accurately determine the dose that the patient receives in treatments performed using ionising radiation. Therefore, it is necessary to determine the dosimetric material and the method to be used correctly. Today, luminescence techniques, thermoluminescence (TL) and optically stimulated luminescence (OSL), have effective use in applications.
Recent studies show that commercially available BeO material, with the tissue equivalent closer than anticipated up to now and the lower cost, has great potential. Following the successful results of carbon-doped aluminium oxide (Al2O3: C) in this area, the availability of BeO’s as a radiation dosimetry via OSL technique was noted. A study was conducted by Sahin et al.Reference Şahin, Tanır, Meriç and Aydınkarahaliloğlu 14 regarding the measurement of the dose using RANDO phantom (Radiology Support Devices, Inc., Long Beach, CA) via BeO dosimeters in RT applications performed with photons. This study showed that targeted and non-targeted doses can be accurately calculated for applications at doses ranging from 207·33 to 9·09 cGy.
OSL method causes the trapped electrons to transfer to deeper traps. This photo-transfer signal may be a problem for BeO dosimeters that are previously irradiated in high doses.Reference Bulur and Göksu 15 The studies show the need for a firing process after irradiation and reading in order to remove the source of the photo-transfer charges. For example, Bulur and GöksuReference Bulur and Göksu 15 show that heating to 650°C is sufficient for this purpose, while Tochilin et al.Reference Tochilin, Goldstein and Miller 16 and Busuoli et al.Reference Busuoli, Lembo, Nanni and Sermenghi 17 showed a 15-minute procedure at 400 or 600°C. In this study, 1 hour at 600°C as an annealing temperature and a heating procedure of 200°C in increments of 2°C/second for the preheating temperature were used in the reader determined as the result of the performed experiment.
Analyzing the dose–response graph mathematically in a proper manner is extremely important in the stage of calibration of the dosimeters. Determination of the doses outside the treatment area as well as the doses delivered to the treatment area is critical in terms of patient health and continuity of treatment especially in RT applications. In particular, to make calculation on a single graph for the low-dose region outside the field can give different results depending on the dose-linearity properties of the dosimeters used. Therefore, it is necessary to examine the graph according to the doses given in terms of dose intensity in the form of regions. In this study, the dose–response graph was divided into four regions in terms of the variation of the luminescence intensity behaviour against the doses given and it was observed that the doses measured from the dosimeters with this technique gave results consistent with treatment planning system (TPS).
Materials and Method
This study was carried out by Ankara University Nuclear Science Institute and Republic of Turkey Ministry of Health, Saglık Bilimleri University, Doctor Abdurrahman Yurtaslan Ankara Oncology Training and Research Hospital and Radiation Oncology Clinic; the existing instruments and equipments in the institute and clinic were used.
Trilogy linear accelerator
The irradiations were made with a Varian Trilogy linear accelerator (Varian Medical Systems) producing 6–22 MeV electron energies. The device has a double scattering plate (foil) to create a wide and uniform electron beam profile. The location of the jaws is optimised to minimise the electrons scattered from the collimator. Applicators are used to shape the electron beams. Electron applicators are diaphragm collimator shaped to limit the bundle and consist of several layers containing high-density material (a mixture of 1/3 lead, 1/3 tin and 1/3 bismuth).
RANDO phantom
RANDO phantom contains soft tissue (fat and muscle), lung tissue, bone tissue and cavities in the human body. It consists of a special plastic with an effective atomic number of 7·30 ± 1·25% and a mass density of 0·985 ± 1·25 g/cm3. It consists of 32 horizontal slices, each 2·5 cm in thickness, in order to place the phantom dosimeters and holes in diameter of 5–6 mm located within the slices.
In our study, 12 slices of female Rando phantom manufactured by Alderson company for dose measurements in RT centres were used.
Beryllium oxide
The effective atomic number of beryllium oxide (BeO) (Z eff = 7·2) sensitive to ionising radiation is close to the water (Z eff ≈ 7·51). Its density is 2·85 g/cm3. Ceramic form of BeO is used as OSL dosimeter. It can be used as a square chips in dimensions of 4·7 × 4·7 × 0·5 mm. For the square dosimeters linear dose characteristic beginning at some micro Gray up to some Gray allows dose measurements in the common dose ranges for personal, environmental and medical dosimetry.Reference Jahn, Sommer, Ullrich, Wickert and Henniger 18 The low variation coefficient leads to measurements with low uncertainties and the absence of fading allows measurements over longer periods.Reference Jahn, Sommer, Ullrich, Wickert and Henniger 18
Ceramic BeO has been investigated as an OSL material and it has been noted that it can be used as both TL and OSL dosimeters.Reference Sommer and Henniger 19 In our study, among the 48 dosimeter chips the same luminescence sensitivity to the given test dose (100 cGy) with 5% difference 33 BeO dosimeters were used.
Luminescence measurement system
Both TL and OSL measurements can be made with Risø TL/OSL measurement system. It consists of a light detection system, photomultiplier tube and appropriate optical filters. The luminescence excitation system includes optical stimulation and heating components. These two components can be used together or separately. Forty-eight dosimetries can be placed in the sample holders and reading process can be performed. Measurements were made with Risø TL/OSL system (model TL/OSL-DA-20).
Method
The calculations were done with two different algorithms in the Eclipse Treatment Planning system (Varian Medical Systems): Electron Monte Carlo (eMC) and Generalised Gaussian Pencil Beam (GGPB). Dose distribution calculations done with electrons are quite complicated, particularly in multiple scattering, where the internal heterogeneity is present.
The GGPB model, which is a three-dimensional (3D) algorithm used in the clinics, calculates the radial dose distribution as three Gaussian sums. The electron field is divided into evenly distributed squares that the narrow beam bundles (pencil beam) will pass through, and all narrow beam bundles that has contribution to the point dose are considered.Reference Samuelssonyx, Hyödynmaaz and Johanssony 20 The bundle parameters required by the algorithm are mean electron energy on the phantom surface, virtual source-reference plane distance and central deep dose curves that are open and close for large areas.
Monte Carlo algorithm: models radiation transfers throughout different environments and geometries. Studies regarding the expected dose in this method have been carried out.Reference Ding, Duggan, Coffey, Shokrani and Cygler 21 – Reference Aubry, Bouchard, Bessières and Lacroix 24 Especially Zhang et al.Reference Zhang, Wen, Nurushev, Burmeister and Chetty 25 have presented a comprehensive evaluation of the Eclipse eMC algorithm. In general, the TPS algorithm starts with homogeneous water equivalent phantom and standard geometry. Complex scenarios are added later. It has been shown in Eclipse eMC calculations that it gives results with 2·5% accuracy in the 6–22 MeV energy range at 100 cm standard Source Surface Distance (SSD) and in areas smaller than 3 cm.Reference Xu, Walsh, Telivala, Meek and Yang 26
To give a dose of 200 cGy was planned by selecting 12 MeV electron energy in a way that the left breast on the phantom remains within the treatment area. The same plan is repeated for two different algorithms. The gantry and collimator angle of the device is set to 0° during irradiation. Irradiated dosimeters were read by the OSL method.
OSL procedure begins with ionisation of the valence electrons of the radiation material and formation of electron/hole pairs. The defects present in the material determine the position of the free electrons and holes throughout the non-radiative trap transitions. The subsequent stimulation of the irradiated materials with a light of appropriate wavelength leads to the absorption of the energy by the trapped electrons and the transition from the localised trap to the delocalised conduction band. The recombination of free electrons with the localised holes results in luminescent emission. This is an OSL signal and this signal is proportional to the absorbed radiation dose.Reference Bøtter-Jensen, Bulur, Duller and Murray 27
Results and Discussion
Calibration of BeO dosimeters
BeO dosimeters (48 pieces) were placed in an oven at 600°C for about 60 minutes for zeroing. The dosimeters are embedded in a specially prepared solid phantom. Setup conditions for calibration process are designated as:
(a) 6 MV photon energy
(b) 10 × 10 cm × cm area
(c) Source Surface Distance (SSD): 100 cm
(d) d mak = 1·5 cm
(e) Dose Rate: 300 MU/minute
(f) Dose: 100 cGy (100 MU)
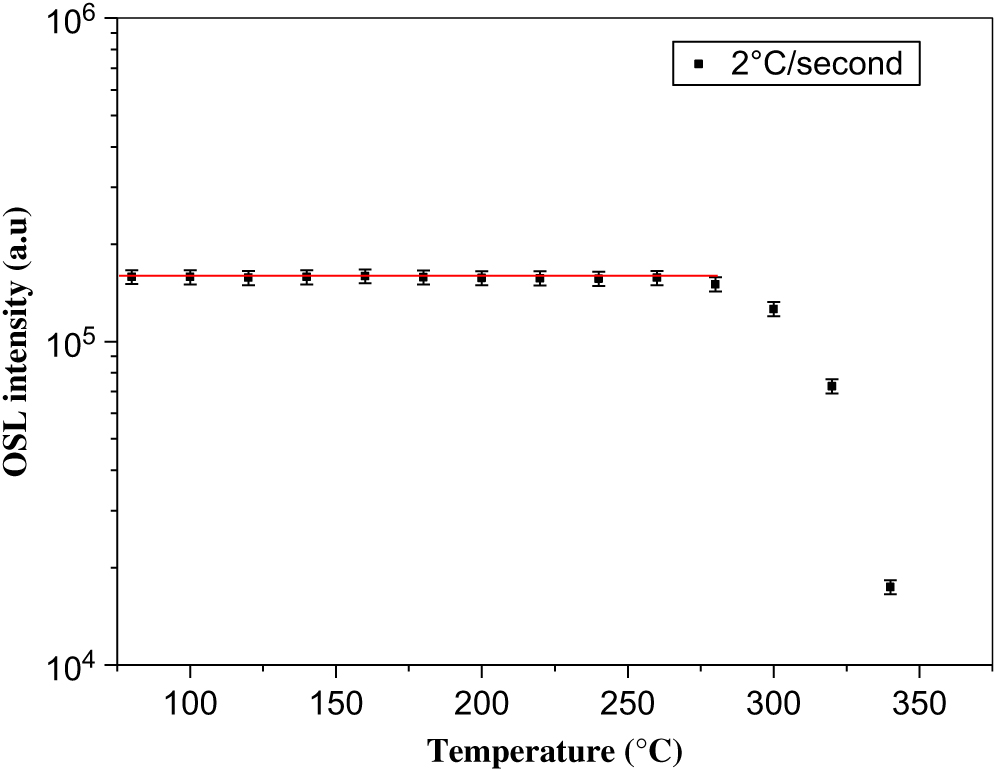
To determine the dosimeters to be used, a dose of 100 cGy was given to the 48 BeO dosimeters with Trilogy linear accelerator device. The OSL signal intensities of 1 second of the dosimeters were evaluated and 33 dosimeters were selected for use in the measurements with 5% error limit with one another. A dose of 300 cGy was given with 90Sr/90Y beta source in order to determine the preheating temperature of BeO dosimeters. They were read by OSL method between 80–340°C at intervals of 20°C with a rate of 2°C/second. Luminescence intensity versus temperature graph was obtained and the preheating temperature was determined as 200°C (Figure 1).
OSL intensity versus the increasing temperature.

Setup conditions for obtaining the dose–response graph in the second phase of calibration are designated as:
(a) 12 MeV electron energy
(b) 10 × 10 cm × cm applicator
(c) SSD: 100 cm
(d) d mak = 2·7 cm
(e) Dose Rate: 300 MU/minute
(f) Dose: 1 cGy (1 MU)–400 cGy (400 MU)
Thirty-three BeO dosimeters were read in the Risø TL/OSL system after irradiation. The order of operations applied in the system is as follows.
(1) Dosimeters were preheated to 200°C at a rate of 2°C/second.
(2) They were left 20 second without performing any procedure.
(3) Luminescence (OSL) measurements were obtained by stimulation with 200 second of blue light.
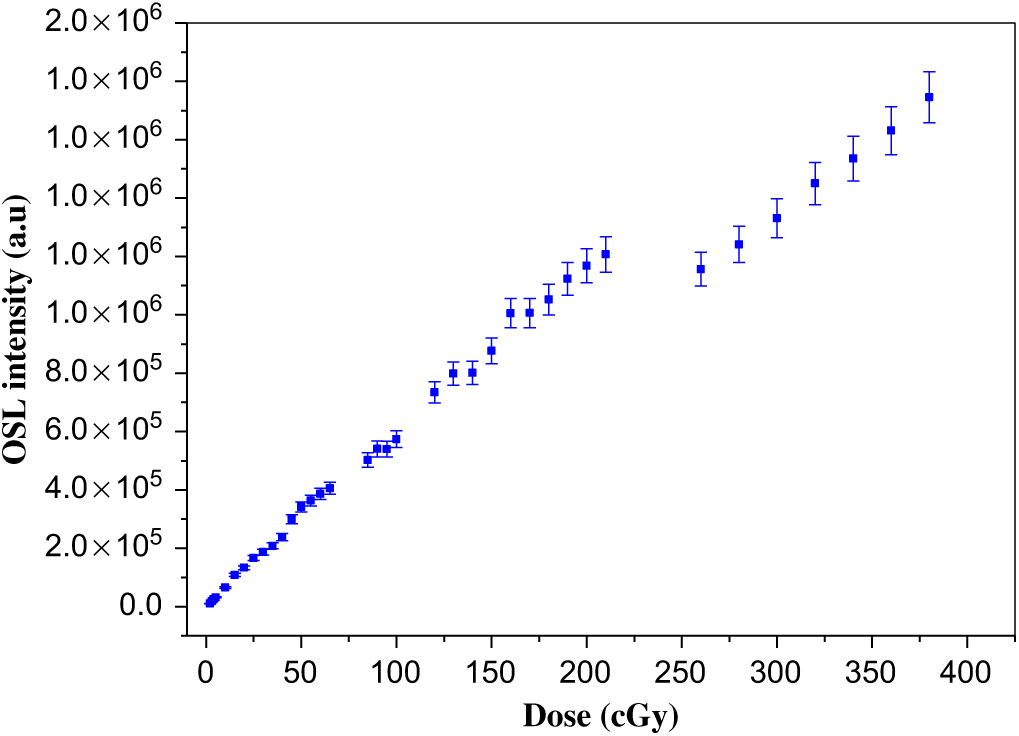
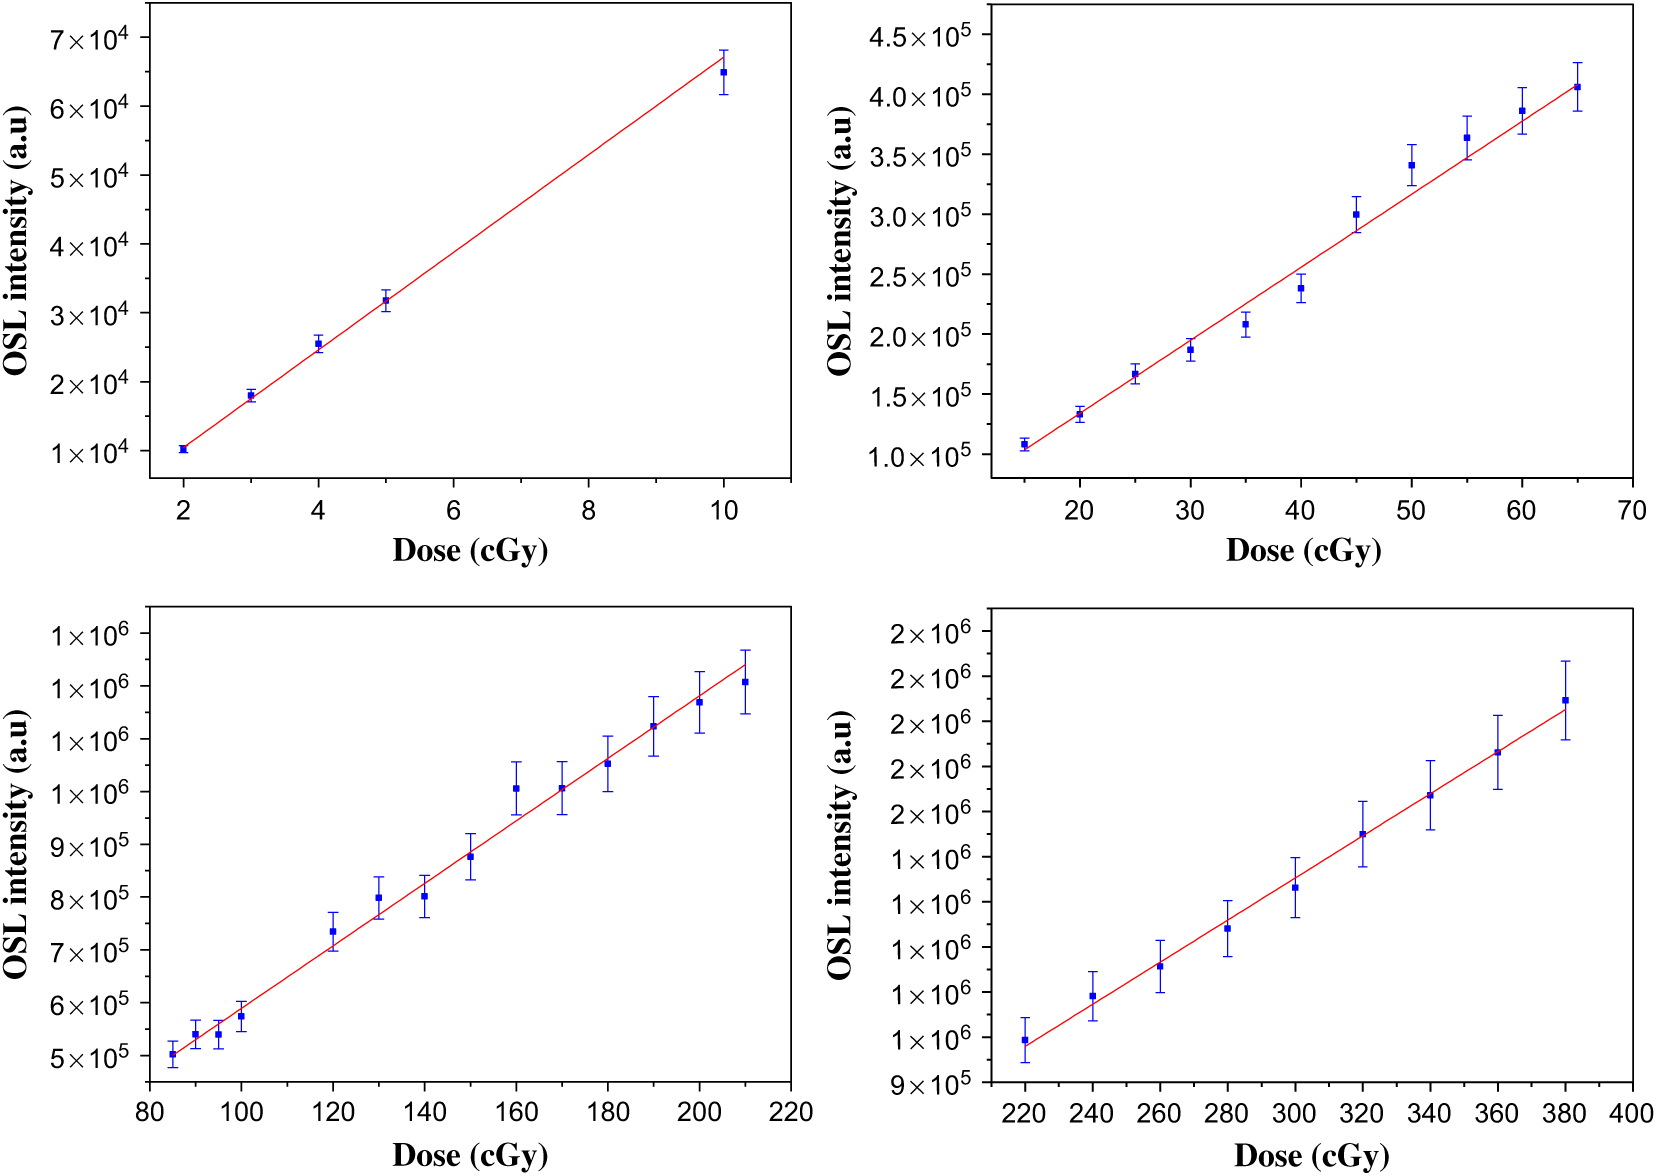
The dosimeters were placed in an oven at 600°C for about 60 minutes after each irradiation. A dose–response graph was drawn after reading procedure (Figure 2). The graph was analyzed by dividing into four regions (1–10 cGy 1st Region, 15–70 cGy 2nd Region, 75–210 cGy 3rd Region, 220–400 cGy 4th Region) (Figure 3).
Dose–response graph.

Dose–response graphs for four regions. (a) Region 1. R2 = 0 ± 99, y = −3712 + 7083x. (b) Region 2. R2 = 0 ± 98, y = 12170 + 6090x. (c) Region 3. R2 = 0 ± 99, y = −2720 + 5919x. (d) Region 4. R2 = 0 ± 99, y = −46884 + 4666x.

Measurements made with BeO dosimeters in female RANDO phantom
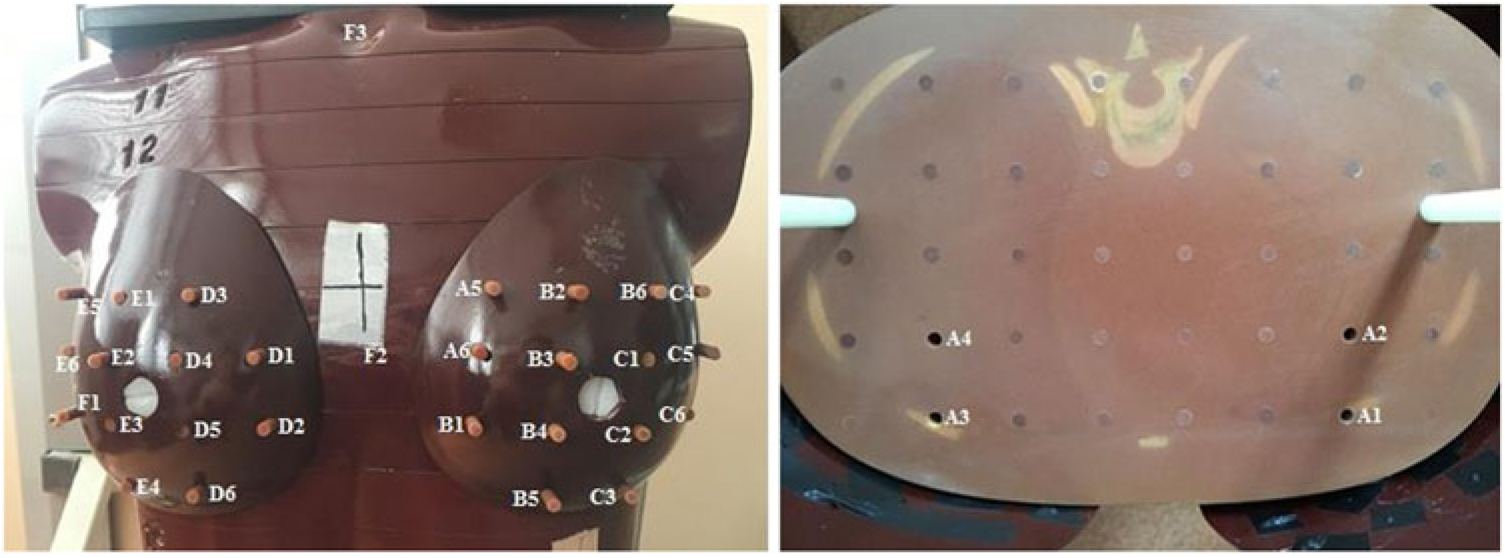
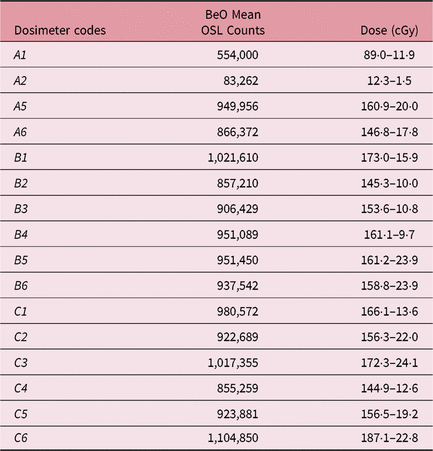
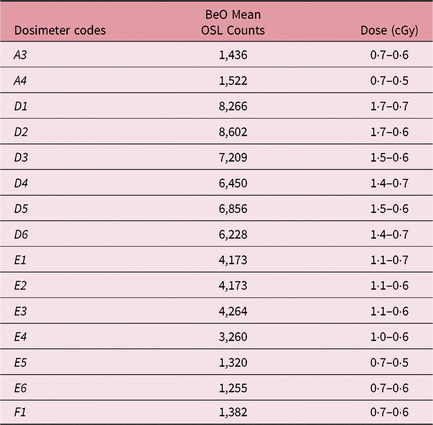
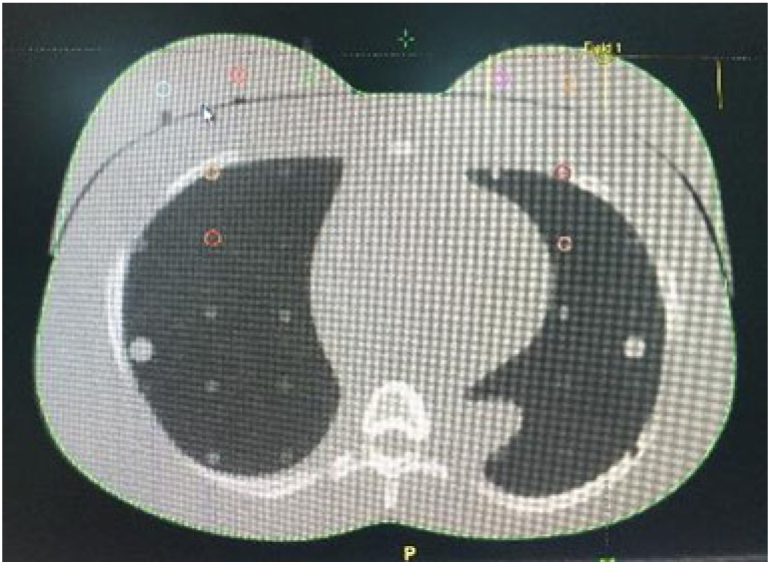
The whole phantom was scanned with Philips Big Bore 4DCT (Philips Healthcare, Cleveland, OH, USA) with 3-mm slice intervals. CT images of the phantom were uploaded to Eclipse treatment planning software v11.4.1 (Varian Medical Systems). Two different treatment plans were made for the GGPB and eMC algorithms in the system. The left breast was chosen as the target. A total of 33 BeO dosimeters, 14 to the target, 2 (with codes A1 and A2) to the left breast side of the 16th slice, 13 to the right breast, 2 (with codes A3 and A4) to the right breast side of the 16th slice, 1 (with code F2) to the midline and 1 (with code F3) to the throat part, were placed (Figure 4). Irradiation was done three times on different days. Dosimeters were read after irradiation by OSL method using Risø TL/OSL system. The results are given in Tables 1–3.
Dosimeter addresses.

Left breast dosimeter reading results

Right breast dosimeter reading results

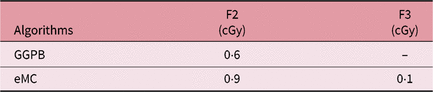
Dosimeter reading results for the two selected regions

As seen on Figure 3, the 2nd region of the dose–response graph was used for the A1-coded dosimeter; the 1st region was used for the A2-coded dosimeter and the 3rd region was used for the A5-C6-coded dosimeters. The 1st region of the dose–response graph was used for the A3-F1-coded dosimeters. The 1st region of the dose–response graph was used for the A3-F1-F2-F3-coded dosimeters.
In TPS, the point dose was read over the regions determined for the left and right breast (Figure 5), midline (with code F2) and throat part (with code F3).
The regions determined for the point dose in TPS.

The dose results according to two different algorithms in the TPS are given in Tables 4–6.
Dose results for the left breast calculated in TPS

Dose results for the right breast calculated in TPS

Dose results for the two selected regions in TPS

Discussion
The mean dose measured from the dosimeters placed in the left breast, which was accepted as the target, (with code A5-C6) was 160·3 ± 17·6 cGy; the mean doses in TPS for the four determined regions were 173·6 and 163·6 cGy according to GGPB and eMC algorithms, respectively. Klein et al.Reference Klein, Hanley, Bayouth, Yin and Simon 28 reported in the published The American Association of Physicians in Medicine(AAPM) Report Number 142 that the calculated dose and the measured dose should be within the ± 5% accuracy. When the mean dose calculated for the target (left breast) in TPS is compared with the mean dose calculated with OSL method by using the BeO dosimeters, the difference for the eMC algorithm is 2·0% while it is 7·7% for GGPB. If the standard deviations are also considered, it is calculated that this algorithm is also within the ± 5% accuracy. It was measured that the A1-coded dosimeter behind the left breast received 89·0 ± 11·9 cGy dose while A2 received 12·3 ± 1·5 cGy. For the regions where the A1- and A2-coded dosimeters are located, the GGPB algorithm calculated 73·7 ± 3·3 cGy and 5·5 ± 0·5 cGy, and eMC calculated 71·2 ± 3·8 cGy and 10·6 ± 1·6 cGy doses, respectively. The mean dose measured for the right breast (D1-F1 coded dosimeters) outside the treatment area was 1·2 ± 0·6 cGy; the mean doses in TPS for the four determined regions were 0·2 cGy according to GGPB. It was observed that this algorithm showed the constant same point dose at each region observed on the right breast in the calculation. The other algorithm (eMC) calculated 0·2 cGy. It was observed that it calculated 0·5 cGy close to the target and less dose (0·2 cGy) as the distance increased. Dose of 0·7 ± 0·6 cGy was read from the A3-coded dosimeter and 0·7 ± 0·5 cGy was read from the A4-coded dosimeter behind the right breast. The GGPB algorithm calculated a constant dose of 0·2 cGy for the areas where these dosimeters were present, while the other algorithm did not calculate doses.
The dose measured by the F2-coded dosimeter placed on the midline was 3·3 ± 1·1 cGy, while the GGPB algorithm calculated 0·6 cGy as the point dose and eMC calculated 0·9 cGy. When we examine F3-coded dosimeter, a dose of 1·0 ± 0·6 was measured, while the GGPB algorithm calculated that there was no dose and eMC calculated that there was a dose of 0·1 cGy.
It was observed from the results that eMC algorithm is more compatible with the dosimetric measurements. It has been shown that the Eclipse eMC is superior to the pencil beam algorithm in heterogeneous phantoms containing lung-bone equivalent material.Reference Zhang, Wen, Nurushev, Burmeister and Chetty 25
The BeO dosimeters showed a decreasing dose distribution as moved away from the target appropriate to the algorithm. In addition, the results are also remarkable in low doses. Bulur and GöksuReference Bulur and Göksu 15 have shown that doses as low as 5 mGy can be measured with BeO ceramic disks (Thermalux 995, Brush Wellman, Inc., USA).
Our results can be of importance for electron dose measurement in healthy tissues outside the treatment field for the RT patient, also in studies exploring RT long-term effects. This can be of interest because, out of field doses with electron beams are not fully accounted for by a TPS algorithm.
Conclusions
It was observed that doses can be measured with BeO dosimeters using OSL method in RT applications. It increases the advantage of giving consistent results especially for low-dose regions. In the stage of calibrating the dosimeters, the necessity of examining the dose–response graph by dividing it into sub-regions was observed. As a result of evaluations, it is thought that the use of eMC algorithm in clinical RT applications would be more appropriate.
Acknowledgement
This study is supported with the project numbered 17B0204001 by the Ankara University Coordinatorship of Scientific Research Projects (BAP).