I. INTRODUCTION
Spark plasma sintering (SPS) is recognized now as a convenient means for producing dense compacts by the application of pressure and electric field-assisted heating of materials. Reference Munir, Anselmi-Tamburini and Ohyanagi1–Reference Viswanathan, Laha, Balani, Agarwal and Seal3 The process is generally very fast compared to conventional sintering, and also leads to a fine microstructure. Thus, SPS has been used successfully to produce dense ceramics, intermetallics, and composites. Reference Munir, Anselmi-Tamburini and Ohyanagi1–Reference Viswanathan, Laha, Balani, Agarwal and Seal3 However, most studies on SPS relate to the potentially improved properties of compacts, without a detailed examination of the fundamental mechanisms underlying the densification and creep processes.
We focus below on alumina doped with varying levels of yttria and zirconia to produce solid solutions as well as two-phase composites. The densification rate
 $\dot \rho$
(or the creep rate
 $(\dot \varepsilon )$
) can be expressed as
 $$\dot \rho = {{BDGb} \over {kT}}{\left( {{b \over d}} \right)^p}{\left( {{\sigma \over G}} \right)^n}f\left( \rho \right)\quad ,$$
where the terms have their usual meanings. The diffusion coefficient can be expressed as
 $$D = {D_0}\exp \left( {{{ - Q} \mathord{\left/ {\vphantom {{ - Q} {RT}}} \right. \kern-\nulldelimiterspace} {RT}}} \right)\quad ,$$
where D
0 is the pre-exponential term, Q is the activation energy for the rate controlling process, and R is the gas constant. The densification mechanism can then be identified by comparing the experimental and theoretical values of n, p, and Q, along with their microstructural characterization. The expression for creep rate
 $(\dot \varepsilon )$
is identical to Eq. (1), with a different dimensionless constant A.
Although many complex composites that have been produced successfully using SPS, it is difficult to examine fundamental densification and creep mechanisms in such materials due in part to a lack of information on the various interfacial energies and diffusion coefficient. In this context, it is appropriate to consider densification in alumina-based composites with zirconia or yttrium-aluminum garnet (YAG) as a second phase.
The role of yttria and zirconia on densification, creep, and grain growth in alumina has been well documented. Reference Wakai, Iga and Nagano4–Reference Satapathy and Chokshi12 The larger ionic radius of Y (0.89 Å) and Zr (0.74 Å) compared to Al (0.53 Å) and their limited solubility in alumina leads to their segregation at the grain boundaries, Reference Wakai, Iga and Nagano4,Reference Gruffel and Carry5,Reference Stough and Hellmann10,Reference Yoshida, Ikuhara and Sakuma11 potentially retarding diffusion, creep, and densification in alumina. Although there are contrasting views on the effect of segregation on grain growth, Reference Gruffel and Carry5,Reference French, Zhao, Harmer, Chan and Miller6 it is well established that segregation often leads to a change in deformation mechanisms Reference Wakai, Iga and Nagano4,Reference Wakai, Nagano and Iga13 and increases the activation energy. Reference Wang and Raj14,Reference Wang and Raj15
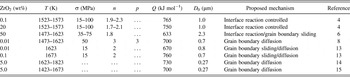
Some of the deformation/densification parameters through conventional creep, sintering and hot pressing on AY and alumina–zirconia (AZ) systems are summarized in Tables I and II, respectively. Inspection of the tables reveals that the stress exponent n ranges from ∼1 to 3 for the alumina–zirconia system and ∼2 to 3 for the alumina–yttria system; in both systems the activation energies are higher than for alumina, with Q value in the range of 600–800 kJ mol−1. There have been only a limited number of studies on SPS in AY and AZ systems. Reference Palmero, Fantozzi, Lomello, Bonnefont and Montanaro16–Reference Jayaseelan, Kondo, Rani, Ueno, Ojhi and Kanzaki21 This limited group of studies relates only to microstructure development and mechanical properties; a comprehensive analysis of the densification mechanisms is not available.
Compilation of creep and densification parameters for alumina–yttria system.

Compilation of creep and densification parameters for alumina–zirconia system.

In view of the difficulty in analyzing densification mechanisms in complex composites and a lack of any systematic study on the densification mechanisms for the AZ or AY system in SPS, the present work was carried out specifically to investigate the effect of Y and Zr concentration on the microstructure development together with densification and creep mechanisms. The focus of the present investigation is an examination of mechanisms involved during creep and densification, and not on the faster kinetics of densification in SPS.
II. EXPERIMENTAL MATERIALS AND PROCEDURE
The materials used in this investigation were alumina powder with a nominal particle size of 100 nm and 99.95% purity (Baikalox BMA 15; Baikowski, Cedex, France), Y2O3-stabilized t-ZrO2 powder (TZ-3Y-E; Tosoh Corp., Tokyo, Japan) with a nominal particle size of ∼30 nm and purity 99.97% and yttria powder with a particle size of 800 nm and purity 99% (Minco Base Metal Corp., Vancouver, Canada). The four compositions were selected for the study: (a) alumina–0.1 wt% zirconia, (b) alumina–9 wt% zirconia, (c) alumina–0.1 wt% yttria, and (d) alumina–2 wt% yttria, designated as AZ0.1, AZ9, AY0.1, and AY2, respectively. The powders were dispersed and the different compositions were prepared following a method outlined previously. Reference Lange and Hirlinger22
A Dr. Sinter 1050 apparatus (SPS Syntex Inc., Tokyo, Japan) was used for carrying out SPS under a vacuum of 6 Pa, with pulse duration 3.3 ms and pulse on:off ratio 12:2. The sintering temperatures ranged between 1173 and 1573 K and the imposed stresses were 25, 50, and 100 MPa, applied before heating commenced. An initial set of experiments was carried out under different SPS conditions to obtain samples of various initial densities and grain sizes. The samples were ramped to the test temperatures in 6 min (7 min for AZ9) and held isothermally for different times to estimate the densities and grain sizes. The total densification was obtained from the displacement of the lower push rod measured by a linear variable differential transformer (LVDT) with a resolution 10 μm. Blank runs (without sample) were carried out under the same SPS conditions to obtain the true densification data, by removing the contributions of the loading system.
The final densities of the sintered compacts were determined by the Archimedes method with deionized water as the immersion medium, following ASTM C 373-88. 23 An intercept method Reference Mendelson24 was used to evaluate grain sizes from micrographs of polished and thermally etched surfaces of samples obtained by scanning electron microscopy (Model S-4300SE/N, Hitachi, Tokyo, Japan) operated at 20 kV. The samples were polished progressively with diamond paste down to 1 μm grit and etched at a temperature 30–50 K below the final sintering temperature. The reported grain sizes are based on the average linear intercept length of around 300 grains obtained using an image analysis software (Analysis 5). X-ray diffraction (Bruker AXS GmbH, Karlsruhe, Germany) was used to analyze the phases in dense AZ9 and AY2 samples using Cu Kα (λ = 0.154187 nm) radiation with step size 0.1° and step time 1 s. Due to limitations in x-ray resolution, the phase identification in AZ0.1 and AY0.1 was carried out from diffraction patterns of the individual particles using a transmission electron microscope (TEM, Model Technai 20T G2, FEI Corp., Hillsboro, OR) and elemental analysis by energy dispersive spectroscopy (EDS) with a spot size of 10 nm, attached to the TEM.
III. RESULTS
A. Microstructural observations
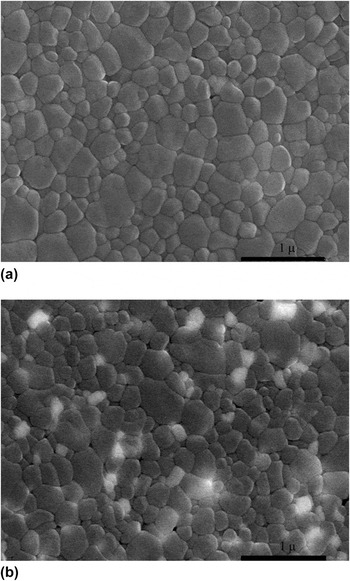
The scanning electron micrographs of dense AZ samples, Fig. 1, show the difference in microstructures with zirconia concentrations. At low solute content, coarse alumina grains were observed with a few isolated pores at the grain boundaries [Fig. 1(a)] whereas at high solute content distinct second phase particles were observed at the grain boundaries of alumina. The measurements of grain sizes in two orthogonal directions indicate that the grains were equiaxed with an aspect ratio of ∼1, and there was no evidence of abnormal grain growth. The final grain size at a density of ∼99% was 210 ± 10 nm in AZ0.1 and was 190 ± 10 nm in AZ9. Similar microstructures and grain sizes were observed for the AY compositions.
Microstructures of (a) SPS AZ0.1 sample T = 1423 K, ρ = 99%, d = 210 ± 10 nm and (b) SPS AZ9 sample T = 1573 K, ρ = 99%, d = 190 ± 10 nm.

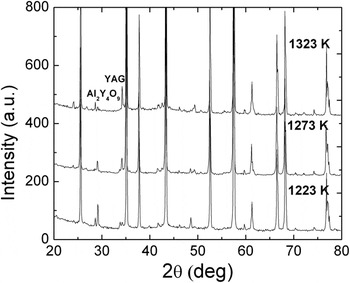
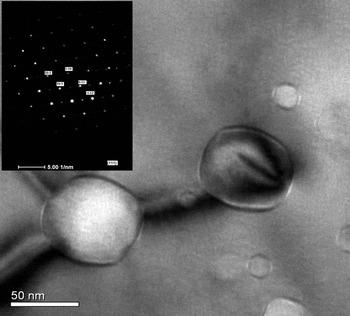
X-ray diffraction of the dense AZ9 and AY2 samples revealed the distinct peaks of t-ZrO2 and YAG, respectively. The YAG phase in Fig. 2 was seen to develop between 1223 and 1273 K and the Al2Y4O9 phase gradually diminished with temperature; the other major peaks corresponded to alumina. The presence of Y and Zr phases in AY0.1 and AZ0.1 could be confirmed only by TEM investigations. For the AZ0.1, TEM revealed discrete nanoparticles at a few alumina grain boundaries (Fig. 3), the diffraction pattern (inset of Fig. 3) from the particles observed in Fig. 3 shows conclusively the presence of t-ZrO2 in AZ0.1. Similar observations were also made in AY0.1 samples.
Evolution of the Y3Al5O12 (YAG) phase with temperature in AY2.

TEM micrograph showing the presence of ZrO2 particles in AZ0.1. T = 1423 K, ρ = 99%, d = 50 nm, dwell time = 15 min. Diffraction pattern in the inset confirms the presence of zirconia in AZ0.1.

B. Densification characteristics
The densification behavior of the AZ and AY compositions was investigated in the temperature range of 1173–1573 K and imposed stresses of 25, 50, and 100 MPa. As noted in a companion study on SPS in alumina, Reference Chakravarty and Chokshi25 a direct approach to identifying the densification parameters involves evaluating them at a constant density.
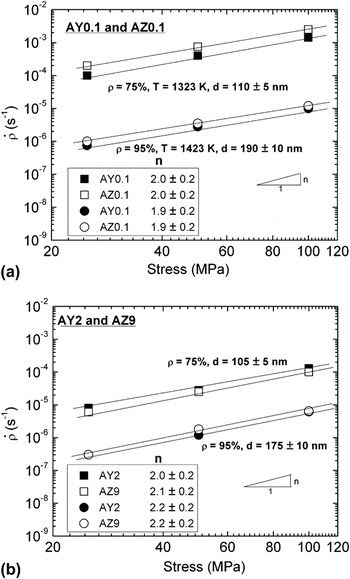
The stress exponents of AZ and AY at densities 75% and 95%, corresponding to the intermediate and final stages of sintering, were obtained from logarithmic plots of the densification rate versus applied stress. The slopes of the straight line in Figs. 4(a) and 4(b) yielded stress exponents of ∼2 for all compositions at both densities, although the densification rates for AZ0.1 and AY0.1 were higher by almost an order of magnitude compared to AZ9 and AY2. The stress exponents are identical to previous reports of Wakai et al. Reference Wakai, Iga and Nagano4,Reference Wakai, Nagano and Iga13 but lower than that reported by French et al. Reference French, Zhao, Harmer, Chan and Miller6
Logarithmic plot of the densification rate versus applied stress at 75% and 95% density for calculating the stress exponents in (a) AY0.1 and AZ0.1, and (b) AY2 and AZ9.

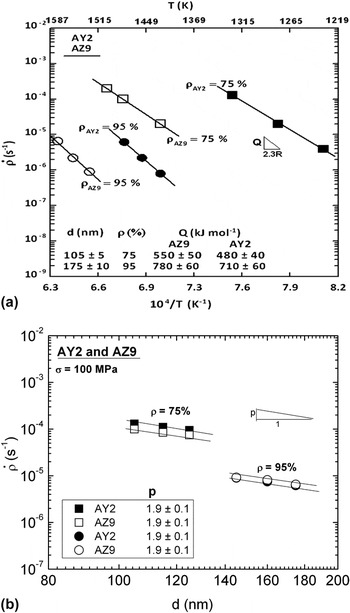
The activation energies for densification were obtained using a similar procedure at densities 75% and 95% from semilogarithmic Arrhenius plots of densification rate versus inverse temperature at a constant stress, grain size, and density. The experimental data yielded at densities 75% and 95%, activation energies of 380 and 600 kJ mol−1 for AY0.1, and 350 and 550 kJ mol−1 for AZ0.1. The corresponding values were 480 and 710 kJ mol−1 for AY2 and 550 and 780 kJ mol−1 for AZ9, as shown in Fig. 5(a). As the AZ9 samples required a higher sintering temperature, the data for AZ9 were obtained at higher temperatures. The activation energies for the final stage sintering are in agreement with previous reports on similar compositions. Reference Wakai, Iga and Nagano4,Reference Cho, Wang, Chan, Rickman and Harmer8,Reference Satapathy and Chokshi12
(a) Semilogarithmic Arrhenius plot for calculating activation energy at 95% density and applied stress 100 MPa in AY2 and AZ9 and (b) logarithmic plot of densification rate versus linear intercept grain size at 95% density for determination of inverse grain size exponents in AY2 and AZ9.

The inverse grain size exponents were determined for AZ0.1 and AY0.1 corresponding to grain sizes 105, 115, 130 nm and 150, 165, 180 nm at 75% and 95% densities; for AZ9 and AY2 the selected grain sizes were 105, 115, 125 nm and 145, 160, 175 nm. A grain growth compensated inverse grain size exponent of ∼1.5 to 2.0 was obtained for both AZ and AY at the intermediate and final stages of sintering, as shown in Fig. 5(b). The value of p in this study involving nanocrystalline grain sizes differs from previous reports Reference Cho, Wang, Chan, Rickman and Harmer8,Reference Satapathy and Chokshi12 of p = 3 for grain sizes between 1 and 3 μm.
IV. DISCUSSION
A. Microstructural analysis
The experimental data show that the absolute rate of sintering is much faster possibly due to retention of finer grain size during SPS, yielding fully dense samples more quickly and at lower temperatures compared to conventional sintering, although the trends of the shrinkage curves in SPS match those in conventional sintering. Localized heating at interparticle contacts during the initial stages of sintering has been considered to be a possible cause for faster densification in SPS. Reference Gao, Shen, Miyamoto and Nygren26 It has also been suggested that an electric field retards grain growth, thereby enhancing the densification rates during SPS. Reference Ghosh, Chokshi, Lee and Raj27 The scanning electron micrographs show equiaxed grains, with no abnormal grain growth or bimodal grain size distribution, possibly due to the fine grain size under consideration and high purity of the powders. The presence of ZrO2 and YAG particles at alumina grain boundaries in AZ9 and AY2 suppressed densification, perhaps by increasing the effective path length for diffusion or increasing the activation energy. Reference Satapathy and Chokshi12 The experimental data also indicate that the nominal alumina grain size in AZ9 and AY2 is smaller than in AZ0.1 and AY0.1, despite a higher sintering temperature required to attain full density in composites with a higher volume fraction of second phases. The second phase particles can retard grain boundary migration in materials following the Zener drag effect, Reference Smith28,Reference Prasad and Chokshi29 with a concomitant reduction in the linear intercept grain size expressed as Reference Prasad and Chokshi29 :
 $${{{d_{\rm{m}}}} \mathord{\left/ {\vphantom {{{d_{\rm{m}}}} {{d_{\rm{p}}}}}} \right. \kern-\nulldelimiterspace} {{d_{\rm{p}}}}} = 1.3{f^{ - 1/3}}\quad ,$$
where d m and d p are the sizes of the matrix and second phase, respectively, and f is the volume fraction of second phase. Thus, calculations for a volume fraction of 5.5% yield a value of d m/d p ∼ 3.4. Identical grain sizes of the second phase particles (80–90 ± 5 nm) and their concentrations (5.5 vol%) yield similar alumina grain sizes (180–190 ± 10 nm) in the dense AZ9 and AY2 samples, broadly in agreement with the Zener criteria to within a factor of ∼2.
Diffraction patterns from the discrete nanoparticles at alumina grain boundaries in AZ0.1 correspond to t-ZrO2. Interestingly, continuous EDS line scans across grain boundaries at the regions devoid of these particles do not show evidence of Zr segregation. Thus, it appears that in the low solute compositions AZ0.1 and AY0.1, the discrete particles are present only sporadically at the grain boundaries without being completely dissolved and uniformly segregated throughout the compacted disk. However, to establish this conclusively would require substantial additional microscopy studies, which is beyond the scope of the present study.
B. Densification mechanisms for AZ and AY
The activation energies for the final stage sintering in the composites with a large volume fraction of a second phase are enhanced substantially over the ∼550 kJ mol−1 noted in alumina. There have also been numerous studies on enhanced activation energies during creep and densification in alumina doped with small levels of zirconia and yttria and also data by Wang and Raj Reference Wang and Raj14 on densification over the entire composition range of alumina–zirconia composites. However, unlike previous observations, the densification rates in the present study were not reduced by several orders of magnitude, possibly due to incomplete dissolution and the differences in stress exponents for SPS in pure and doped alumina. In a doped system, the increase in activation energy can be related thermodynamically to a reduction in the interfacial energy, due to changes in bonding at the interfaces. Reference Arzt, Ashby and Verrall30 The ratio of the interfacial energies of pure alumina and alumina–5 vol% zirconia was previously calculated to be 1.5 ± 0.2. Reference Wang and Raj14 The activation energies obtained for the final stage sintering in the present study for AZ9 (with ∼5.5 vol% t-ZrO2) and alumina are 780 and 525 kJ mol−1, respectively, giving a ratio of ∼1.4, which is in agreement with predictions of Borisov et al. Reference Borisov, Golikov and Shcherbedinski31 and a previous study by Wang and Raj. Reference Wang and Raj14 It has been well established from creep experiments that a suppression of cation grain boundary diffusion by dopants increases the activation energy of a system. Reference Yoshida, Ikuhara and Sakuma7 In the present study, the densification rates in AZ0.1 and AY0.1 are higher by ∼2 orders of magnitude compared to previous creep studies using 100–1000 ppm of the same dopants. Reference Yoshida, Ikuhara and Sakuma7,Reference Cho, Wang, Chan, Rickman and Harmer8 The present enhancement in densification is likely to be related to the finer grain sizes of ∼0.2 μm compared to grain sizes of >1 μm in creep studies.
A higher stress dependence n ∼ 2 is observed in the logarithmic plot of densification versus applied stress, Fig. 4, in both AZ and AY at densities 75% and 95%, compared to values of ∼1 for pure alumina. Reference Chakravarty and Chokshi25 The increased stress exponent and the reduced densification rate are both consistent with approaches related to interface control. Reference Coble32 The current experimental data to determine grain size dependence on densification in both AZ and AY yield values of p between ∼1.5 and 2 from Fig. 5(b). It is interesting to note that interface-controlled diffusion creep models also involve values of p equal to 1 or 2.
Taken together, the present results indicate that second phases lead to a reduction in the densification rates, an increase in the stress dependence and a decrease in the inverse grain size exponent, all of which are consistent with the idea that interface control becomes dominant in these materials, compared to pure alumina. The values of n = 2 and p = 2 obtained in the present study are not normally associated with diffusion creep. However, n = 2 and p = 2 are obtained in a model for interface-controlled diffusion creep by Schneibel and Hazzledine, Reference Schneibel and Hazzledine33 and also models on grain boundary sliding. Reference Sherby and Wadsworth34,Reference Langdon35 Interestingly, doped elements do not increase the activation energy or decrease the diffusivity by as much during oxidation at lower temperatures as they do in creep, implying potentially different mechanisms such as grain boundary sliding in creep and site-blocking in oxidation. Reference Cheng, Caram, Schiesser, Rickman, Chan and Harmer36,Reference Heuer37
C. Comparison with other high temperature rate processes: Compensation effect
High temperature rate (
 $\dot \omega$
) processes such as sintering, creep, grain growth, and cavitation growth depend frequently on the diffusion coefficient
Reference Chokshi, Tzuchiang and Chou38,Reference Chokshi39
:
 $$\dot \omega \alpha D\quad .$$
A simultaneous examination of such processes in a material is likely to shed additional important information that may be difficult to garner from individual processes. Reference Chokshi, Tzuchiang and Chou38,Reference Chokshi39 We examine below creep in dense samples together with densification during SPS.
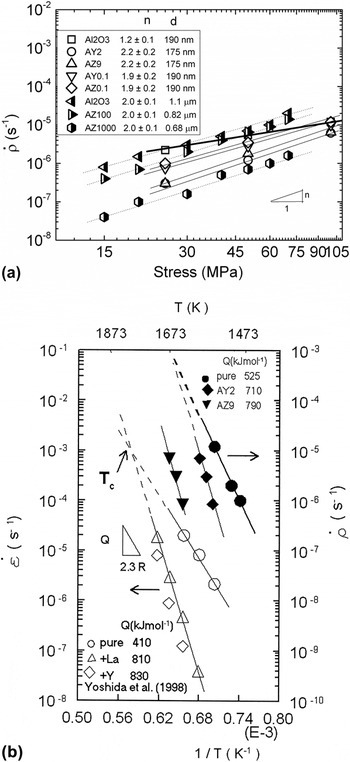
Figure 6 shows with stress (a) or inverse temperature (b) the variation in the densification or creep rate in alumina doped with Y or Zr. Note that, based on approaches developed by Raj for separating strains associated with densification and creep, the creep rates during SPS within a die are expected to be ∼2/3rds that of the densification rates. Inspection of Fig. 6(a) shows that small or large additions of Y or Zr lead to an increase in the densification stress exponent to n ∼ 2 compared to n ∼ 1 for pure alumina in SPS. In contrast, the stress exponent for creep remains at ∼2 in dense samples. Analysis suggests that creep in dense alumina with grain sizes of ≥1 μm occurs by either diffusion creep (n = 1) or interface-controlled diffusion creep (n ∼ 2), with finer grain sizes and lower stresses favoring interface-controlled processes. Reference Cannon, Rhodes and Heuer40 Surprisingly, pure alumina exhibits n ∼ 1 even though it has a finer grain size of <0.2 μm. Since interface-controlled diffusion creep involves control by either vacancy creation or annihilation, and vacancies are already available in porous solids, the data suggest that creep in dense alumina is likely to be controlled by vacancy creation. Note that the stress exponent is ∼2 for all alumina–yttria and alumina–zirconia systems shown in Fig. 6(a), suggesting interface control. However, while 1000 ppm zirconia leads to a decrease in the strain rate by an order of magnitude in the creep of dense alumina at a stress of 30 MPa, it leads to only a factor of ≤3 decrease in the densification rate. This discrepancy arises possibly from incomplete dissolution and the difference in the stress exponents during creep and SPS of pure alumina, as the reduction in the densification rate by zirconia addition depends on the stress used for comparison during SPS.
(a) Comparison of stress exponents for alumina, AZ, AY composites from the present study and previous creep results of Wakai et al. Reference Wakai, Nagano and Iga13 The half open legends represent data from Wakai and the open legends represent the present study data. The bold line corresponds to alumina from the present study. T = 1423 K for the present study and 1523 K for Ref. Reference Wakai, Nagano and Iga13. AZ 100 indicates 100 ppm Zr dopant in alumina. (b) Comparison of activation energies for alumina, AZ, AY composites from the present study and previous creep results of Yoshida et al. Reference Yoshida, Ikuhara and Sakuma7 The solid and open symbols correspond to the data from the present study and Yoshida’s study, respectively.

The activation energy is also enhanced significantly by doping during both creep and SPS as shown in Fig. 6(b) together with data for creep in dense alumina and alumina doped with either Y or La. For clarity, the densification rates during SPS on the right hand Y axis are displaced with respect to the creep rates during creep in dense alumina on the left hand Y axis; also, for SPS, only data from a high additive content are shown. Note that while creep enhances the activation energy at low levels of Y or La addition (≤1000 ppm), the data on SPS indicate that low levels of additives do not increase the activation energy significantly although high activation energies during SPS are noted for larger additive content. The difference arises possibly from incomplete dissolution of the yttria and zirconia particles, so that the solute content at grain boundaries is less than expected. Wang and Raj Reference Wang and Raj15 demonstrated that the activation energy increases significantly during sintering from ∼440 kJ mol−1 in pure alumina to 700 kJ mol−1 alumina composites with >5% zirconia.
Analyses of such data from creep or sintering have focused solely on activation energy changes, which have been attributed variously to grain boundary segregation, changes in bonding and a site-blocking effect of larger ions.
The problem with the above approach is illustrated with the data shown in Fig. 6(b). Based on expressions of the form of Eq. (1), for materials deforming by the same mechanism tested with the same grain size and stress, assuming that doping only influences the activation energy:
 $${{{{\dot \varepsilon }_{\rm{i}}}} \mathord{\left/ {\vphantom {{{{\dot \varepsilon }_{\rm{i}}}} {{{\dot \varepsilon }_{\rm{p}}}}}} \right. \kern-\nulldelimiterspace} {{{\dot \varepsilon }_{\rm{p}}}}} = \exp \left[ {{{\left( {{Q_{\rm{p}}} - {Q_{\rm{i}}}} \right)} \mathord{\left/ {\vphantom {{\left( {{Q_{\rm{p}}} - {Q_{\rm{i}}}} \right)} {RT}}} \right. \kern-\nulldelimiterspace} {RT}}} \right]\quad ,$$
where the subscripts i and p refer to the impure (doped) and pure materials, respectively. Thus, for a temperature of 1473 K, the data in Fig. 6(b) should lead to decrease in the strain rate for the Y-doped alumina to be reduced by a factor of ∼10−16 compared to pure alumina, based on an increase in the activation energy from 410 to 830 kJ mol−1. In contrast, the experimental data indicate that the reduction in creep rate for the Y-doped alumina is only a factor of ∼102.
The implication from the above analysis is that an increase in the activation energy for creep must be compensated by a simultaneous increase in the pre-exponential term D 0. Such a compensation effect has been reported in many rate processes, including grain boundary migration/sliding and diffusion. Reference Gottstein and Shvindlerman41,Reference Divinski and Edelhoff42
A curious aspect of Fig. 6(b) is that the extrapolation of the reported data suggests that the creep rates for the doped and pure alumina would be similar at a critical temperature T c, which is in the vicinity of ∼1800 K. The observed compensation effect implies a relationship between the critical temperature and the values of the pre-exponential terms and the activation energies:
 $${T_{\rm{c}}} = {{\left[ {{Q_{\rm{i}}} - {Q_{\rm{p}}}} \right]} \mathord{\left/ {\vphantom {{\left[ {{Q_{\rm{i}}} - {Q_{\rm{p}}}} \right]} {R\ln \left( {{D_{{\rm{0p}}}} - {D_{{\rm{0i}}}}} \right)}}} \right. \kern-\nulldelimiterspace} {R\ln \left( {{D_{{\rm{0p}}}} - {D_{{\rm{0i}}}}} \right)}}\quad .$$
The above expression reveals a coupling between the entropy (incorporated in the pre-exponential term D 0) and the activation energy Q. Shvindlerman et al. Reference Gottstein and Shvindlerman41 have examined such relationships for diffusion and grain boundary migration, and they have attributed such observations to a first-order grain boundary transition.
It is interesting to note that there appears to be a decrease in T c from ∼1800 K in dense aluminas to ∼1700 K during SPS in porous aluminas. Thus, the SPS process appears to alter the pre-exponential term to increase the diffusion coefficient during SPS, providing a potential additional contribution to enhanced densification during SPS. However, the difference in the stress exponents for SPS in pure and doped alumina limits further analysis of implications of such approaches.
Grain boundary transitions in doped ceramics may include roughening transitions or variations in grain boundary segregation. It is anticipated that such grain boundary transitions will depend upon the grain boundary structure, which influences the grain boundary energy. Nevertheless, it is interesting to note that experiments on Y-doped alumina revealed microstructurally the occurrence of roughening transitions in the temperature range of 1673–1773 K, which is close to the value of T c in Fig. 6(b) (Ref. Reference Kim, Cho and Yoon43). In a similar manner, measurements based on grain boundary mobility suggest that there is a transition from normal to abnormal grain growth at T >1750 K in Y-doped alumina Reference Cantwell, Tang, Dillon, Luo, Rohrer and Harmer44 and <1823K in the two phase region of Zr-doped alumina. Reference Behera, Cantwell and Harmer45
It is important to note that dopants can modify the diffusivities in two different manners: (a) change the diffusion coefficient by altering the pre-exponential term, without changing the activation energy, and (b) change the diffusion coefficient with simultaneous changes in the pre-exponential term and the activation energy. Thus, the recent results by Behera et al. Reference Behera, Cantwell and Harmer45 on grain growth in Zr-doped alumina fall in the first category, whereas the current results relate to the second category. While both sets of data can be related potentially to grain boundary transitions and can be discussed in terms of the recently developed complexion concept, Reference Cantwell, Tang, Dillon, Luo, Rohrer and Harmer44 the compensation effect is relevant only to the second category of dopant/mechanism interactions. An additional possibility to consider is that complexion-transitions involving only changes in the pre-exponential term may lead to a regime with an apparently higher activation energy, Reference Behera, Cantwell and Harmer45 and this factor needs further study.
V. SUMMARY AND CONCLUSIONS
The effect of yttria and zirconia concentration on the densification kinetics for SPS in alumina was investigated over the temperature range of 1173–1573 K and applied stresses ranging from 25 to 100 MPa. The finer grain size in compositions with higher second phase content is consistent with a Zener drag mechanism. In contrast to a stress exponent of n ∼ 1 for pure alumina, the doped aluminas display n ∼ 2 during SPS. The slower densification rates and higher activation energies in AZ9 and AY2 are due to the presence of second phase particles, with the higher activation energies being consistent with measured changes in the interfacial energies. The experimental data reveal stress and inverse grain size exponents ∼2 for the intermediate and final sintering stages for both AZ and AY, consistent with an interface-controlled diffusion process. The influence of low solute content on the densification rates is less than that observed in creep of dense samples due to the differences in stress exponents for pure alumina (n ∼ 1) and the doped alumina (n ∼ 2) during SPS, compared to n ∼ 2 for coarser-grained alumina and doped alumina during creep. Analysis of the SPS data together with data for creep in dense doped alumina suggests that doping leads to a compensation effect, with an increase in activation energy and a simultaneous increase in the pre-exponential term for diffusion.
ACKNOWLEDGMENTS
This work was supported by the Department of Science and Technology. We gratefully acknowledge the support and useful discussions with Dr. G. Sundararajan. One of us (AHC) is also grateful to Professor Laszlo Toth for support during a sabbatical leave at the University of Lorraine, Metz.