

On April 17, 2011, Bloc Québécois (BQ) leader Gilles Duceppe was invited to speak at the Parti Québécois’ (PQ) convention. Duceppe's appearance came in the middle of a federal election campaign where it looked as if the BQ was coasting to another victory in Quebec. Duceppe said, “Avec un Bloc fort à Ottawa, le PQ au pouvoir au Québec, tout redevient possible” [With a strong Bloc in Ottawa, the PQ in power in Quebec, everything becomes possible again] (Nicoud, Reference Nicoud2011). Although welcomed by the audience with applause, Duceppe's words coincided with the beginning of what would turn out to be a drastic change in campaign dynamics (Fournier et al., Reference Fournier, Cutler, Soroka, Stolle and Bélanger2013).
Come election night, the BQ's 47 seats in Quebec were reduced to four—a far cry from the party that had usually won most of the province's seats. Duceppe himself was defeated in his own riding, one that he held for two decades. Historically an afterthought in the province, the New Democratic Party (NDP) won 59 seats, providing the party with almost all of its national electoral gains and allowing it to become the official opposition for the first time. The result left many wondering how the fortunes of the two parties reversed in Quebec. In other words, how was the once-dominant BQ “capsized by the orange wave” (Bélanger and Nadeau, Reference Bélanger, Nadeau, Pammeett and Dornan2011).
Explaining this “orange wave” in all its detail is a complex and intertwined endeavour. We are interested in those who voted for the BQ in 2008 but switched to the NDP in 2011. These vote-switchers constituted roughly 30 per cent of the 2008 BQ vote (Fournier et al., Reference Fournier, Cutler, Soroka, Stolle and Bélanger2013). Thus, we focus on the puzzle of the BQ's decline by looking at what led their voters to choose another party.
We do so by examining voter/party congruence in Quebec during the 2006–2011 Canadian federal elections. Given the nature of electoral politics in Quebec, we propose a model that looks at voter/party proximity on economic, social and federalism dimensions. In essence, this study seeks to understand whether the BQ and NDP “minded the gap” with the electorate in Quebec in 2011. The findings highlight that voter/party proximity contributes to explaining vote choice in Quebec over the period under study. Furthermore, we find that the structure of partisan competition in Quebec can be seen through a three-dimensional framework.
The paper proceeds in three parts. After discussing the role that ideology plays in linking voters to political parties, we touch on the uniqueness of partisan competition in Quebec. Next, we use election survey data and political party manifestos from the 2006–2011 Canadian federal elections to position both parties and voters within the same political space in Quebec. Our empirical analysis then centres on the proximity of the BQ and the NDP to Quebec voters over this period. Our conclusion makes a case for conceiving partisan competition in Quebec differently and highlights the importance of voter/party congruence as a contributor to vote choice.
The Ideological Link
Our study starts from the premise that ideology drives individuals to vote for a party. In general terms, we think of an ideology as a system of beliefs and ideas about the human world. Through the lens of voting behaviour, we borrow Hinich and Munger's definition of ideology being a set of propositions that have “implications for (a) what is ethically good, and (therefore) what is bad; (b) how society's resources should be distributed; and (c) where power appropriately resides” (1994: 11). While parties propose policies according to a particular ideology, voters distinguish between the ideological distinctiveness of political parties to decide which party is closest to their own beliefs (Nie et al., Reference Nie, Verba and Petrocik1979; Rusk, Reference Rusk and Long1987). Thus, ideology is a crucial heuristic shortcut that binds voters to parties by helping them navigate the political landscape using their political likes and dislikes (Budge, Reference Budge1994; Sniderman et al., Reference Sniderman, Brody and Tetlock1993). Furthermore, research has empirically shown ideology to be important and linked to both party identification and vote choice (Abramowitz and Saunders, Reference Abramowitz and Saunders2006; Holmberg, Reference Holmberg, Dalton and Klingemann2007; Medeiros and Noël, Reference Medeiros and Noël2014).
Our assumption that voters cast their ballots for the party that is closest to their own preferences leads us to consider spatial modeling theory, which is generally divided between directional and proximity models. The classic proximity model emphasizes distance between voters and parties (Blais et al., Reference Blais, Nadeau, Gidengil and Nevitte2001; Downs, Reference Downs1957), whereas the directional model highlights the direction and intensity of party positions (Macdonald et al., Reference Macdonald, Listhaug and Rabinowitz1991; Rabinowitz and Macdonald, Reference Rabinowitz and Macdonald1989). In other words, while proponents of the proximity model pay attention to how close a voter is to a party, advocates of the directional model focus on the direction of movement from the status quo (Matthews, Reference Matthews1979) as well as the intensity of policy advocacy (Rabinowitz and Macdonald, Reference Rabinowitz and Macdonald1989). More recently, there have even been attempts to mix elements from both types of spatial models (for example, see Merrill and Grofman, Reference Merrill and Grofman1998). Yet, as Pardos-Prado and Dinas (Reference Pardos-Prado and Dinas2010) demonstrate, a proximity model can better explain voter behaviour in less polarized systems. Since the Canadian party system falls into this category (Dalton, Reference Dalton2008; Rehm and Reilly, Reference Rehm and Reilly2010), we believe that a proximity model is more appropriate than a directional one for analysing voter/party congruence on the federal level.
Our proposed approach does not specifically address the importance of specific issues. However, as Lachat (Reference Lachat2011) states, proximity voting can be seen as a form of issue voting in which voters systematically compare their preferences to parties’ positions on broad issues rather than focusing on one single issue. Our decision to use a proximity model is reinforced by the fact that empirical evidence, in Canada and elsewhere, points to the greater advantage of using an ideology-based proximity model to ascertain voter/party congruence (Blais et al., Reference Blais, Nadeau, Gidengil and Nevitte2001; Wagner and Ruusuvirta, Reference Wagner and Ruusuvirta2011).
Ideology and Dimensionality
Any discussion of using ideology in spatial modelling requires that we turn to the question of dimensionality in the political space. Hinich and Munger (Reference Hinich and Munger1994) present ideology as an abstract notion but one with concrete repercussions in terms of resource distribution. Ideologies help voters translate these notions into a group of specific policy preferences. In this vein, we put forward the notion of dimensions as policy planes upon which ideological positions compete and represent individuals’ preferences. Several studies demonstrate that these dimensions can be measured using scaling methods (Enelow and Hinich, Reference Enelow and Hinich1984; Schofield, Reference Schofield2008; Singh, Reference Singh2010). But while the overall political space may have many dimensions, political debates, such as campaigns, revolve around relatively few.
In spite of this multidimensionality, the classic Downsian spatial model depends on a one-dimensional left/right axis, which is still how ideology is most often presented. Yet, a one-dimensional ideological axis is unable to account for other important cleavages and can lead to a significant loss of political information (Albright, Reference Albright2010; Castles and Mair, Reference Castles and Mair1984; Stokes, Reference Stokes1963). As a result, many researchers use two ideological dimensions (Inglehart, Reference Inglehart1990; Lipset and Rokkan, Reference Lipset, Rokkan and Mair1967). Generally, these two dimensions are presented in terms of a left/right economic dimension and a liberal/conservative social values dimension.
Nonetheless, even a two-dimensional approach might not be sufficient to take into account the specific political idiosyncrasies of a given country or region. This is particularly relevant for electoral landscapes with unique historical, social and geographical particularities (Barnea and Schwartz, Reference Barnea and Schwartz1998). These factors can lead to strong regional identities, which have the potential to be translated into a “centre/periphery” cleavage in politics (Lipset and Rokkan, Reference Lipset, Rokkan and Mair1967). On this dimension, preferences on the constitutional status of a region can range from strong centralized power to complete independence. For example, contemporary movements in areas such as Catalonia and Scotland show how relations between a central state and its regions can be politically salient (Keating, Reference Keating2001). This centre/periphery dimension can provide additional information to voters, allowing them to distinguish between parties that may be similar on economic and social dimensions (Pallarés et al., Reference Pallarés, Lago and Muñoz2006). That being said, parties are not necessarily always similar on economic and social dimensions. Medeiros and colleagues (Reference Medeiros, Gauvin and Chhim2015) push against the common practice of collapsing economic and social dimensions into one left/right ideological axis when incorporating the centre/periphery dimension into analyses of voter behaviour. They make an argument for keeping these three dimensions separate, as collapsing them can blur the distinction between some parties. Furthermore, Wheatley and colleagues (Reference Wheatley, Carman, Mendez and Mitchell2014) find that Scottish voters’ policy preferences in the 2011 Scottish Parliament election coalesce around three separate dimensions that are analogous to economic, social and centre-periphery axes.
Quebec is no exception to these dynamics. The centre/periphery cleavage often manifests itself as a debate between federalism and sovereignty. In recent years, positioning on this “federalism” dimension has been shown to be the strongest determinant of vote choice in Quebec, both at the federal and provincial levels (Bélanger and Nadeau, Reference Bélanger and Nadeau2009; Blais et al., Reference Blais, Gidengil, Nadeau and Nevitte2002; Loewen et al., Reference Loewen, Héroux-Legault and de Miguel2015). Furthermore, Collette and Pétry (Reference Collette, Pétry and Pelletier2012) contend that the sovereignty axis in Quebec is the most ideologically important dimension for distinguishing the parties. Yet, sovereignty is not the only salient dimension in Quebec federal politics; the standard economic and social dimensions also guide voters (Blais et al., Reference Blais, Gidengil, Nadeau and Nevitte2002; Cross and Young, Reference Cross and Young2002). Thus, we propose that all three political dimensions play mutually supporting roles in the relationship between voters and parties in Quebec federal politics.
This might be especially useful for distinguishing between the BQ and NDP, often seen as two “left-wing” parties mainly distinguishable by their position on sovereignty (Gagnon and Hérivault, Reference Gagnon, Hérivault and Gagnon2007). Yet, Cochrane (Reference Cochrane2010) explains that both parties diverge on distinct social and economic dimensions. Thus, disentangling a one-dimensional left/right scale into two separate components provides clearer information on the parties. Adding the federalism dimension, while keeping the other two dimensions distinct, provides a more complete picture of the differences between both parties.
Two to Tango: The 2011 Canadian Election in Context
If we assume that voters tend to choose parties that are ideologically closer to themselves, it follows that political elites would want to maximize their electoral chances by responding to changes in the median voter's position. Frognier (Reference Frognier, Budge, Crewe and Farlie1976) puts forward the idea of a mutual adjustment between parties and voters from one election to another on multiple distinct dimensions. We apply his idea of parties positioning and repositioning themselves to voters in a multidimensional loop of influence to our own three dimensions in Quebec federal politics. Doing so helps us put recent NDP and BQ strategies into perspective over the past few elections.
Over the last decade, voting behaviour in Quebec federal elections has been rife with volatility (Gidengil et al., Reference Gidengil, Nevitte, Blais, Everitt and Fournier2012). While Fournier and colleagues (2013) argue that NDP platforms show little overall change over the last few elections, the party's position toward Quebec has slowly shifted in recent years. Three key events seem to have gradually brought Quebecers and the NDP closer together. First, the party chose Jack Layton, a native Quebecer, as leader in 2003. Layton was more comfortable with the French language than the party's two previous leaders. His ability to speak French and willingness to appear in French-language media boosted his image among Quebecers. Second, the NDP expressly courted Quebec voters with the Sherbrooke Declaration of 2005. In this document, the party distanced itself from its centralizing past, acknowledged the distinctiveness of Quebec and promised to recognize the province's secession if the independentist option received 50 per cent plus one of the votes in a referendum. This was a clear attempt to redefine itself as a party that was on Quebec's side. Finally, in 2007, Thomas Mulcair was elected in a by-election under the NDP banner in the Quebec riding of Outremont. The new NDP MP not only gave the party a new seat, but also increased attention to the party in Quebec. Contrary to its history, the 2000s were a time when the NDP was becoming an increasingly appealing option for Quebec voters.
If the NDP had become more attractive, the opposite was true for the BQ. Although the party reached electoral heights on the heels of the sponsorship scandal in 2004, the BQ has since seen a steady decline at each election in terms of vote share. However, this decline was not really felt in terms of seats due to vote splitting between federalist parties (Bélanger and Nadeau, Reference Bélanger, Nadeau, Pammeett and Dornan2006). Yet, according to Bélanger and Nadeau (Reference Bélanger, Nadeau, Pammeett and Dornan2011), the 2011 election assembled the perfect storm of “losing conditions” leading to the BQ's unforeseen result. First, support for Quebec sovereignty remained moderate, yet stagnant, over the past few years. Second, there was no Quebec-specific issue dominating the election. These two conditions thus helped an already ascendant NDP seem even more appealing to Quebec voters.
From this summary of recent NDP and BQ party history, we can see examples of ways in which the political parties began to relate differently to Quebec voters and vice versa. In this paper, we use “voter/party congruence” to refer to the degree to which party positions and voters converge. We put forward the following hypothesis in order to help explain the electoral fortunes of both parties in Quebec during the 2011 federal election:
H1:
The further the BQ is ideologically from Quebec voters, the more likely they are to vote for the NDP.
Data and Methods
In order to test our hypothesis, we position the electorate and the parties along social, economic and federalism dimensions. The electorate's positions were discerned from election survey data and the political parties were positioned via quantitative content analysis of party manifestos. The measures of both parties and voters were then standardized onto the same scale on all three dimensions. Doing this allowed us to position both parties and voters in the same space and consequently measure any changes in the relationship between the two over the past three federal elections.
Positioning Voters
We used the Canadian Election Study (CES) to position voters. Although ensuring comparability when using longitudinal national election data can be challenging, we were able to select questions not only consistent across CES surveys, but also capable of capturing the economic, social and federalism preferences necessary to test our hypothesis.
As mentioned earlier, using three scales rather than a traditional left/right self-placement continuum can provide a more nuanced picture of a regionalist partisan landscape. However, ideological positioning is not without its own methodological issues. Powell (Reference Powell2009) finds that voters tend to respond to ideological self-placement questions by positioning themselves toward the centre. Furthermore, considering that question order in surveys has been shown to influence responses (Fournier et al., Reference Fournier, Turgeon, Blais, Everitt, Gidengil and Nevitte2011), we infer that basing ideological positioning on self-placement questions might not be an optimal measure. Rather, scales based on issue dimensions have been shown to be preferable to self-reported ideology (Treier and Hillygus, Reference Treier and Hillygus2009). These findings emphasize the importance of using issue-based scales instead of self-placement measures to improve internal and external validity.Footnote 1
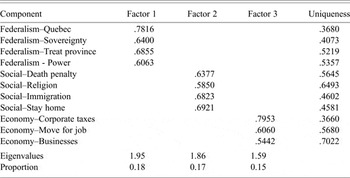
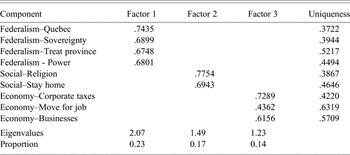
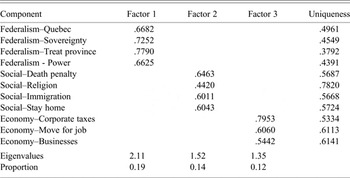
Consequently, we created three scales to measure the three dimensions of Quebecers’ political preferences by using principal components analysis to reduce the number of items into distinct, orthogonal dimensions. After using varimax rotation to improve principal-component score loadings, we predict the factor scores with a regression scoring method.Footnote 2 To maintain comparability, the principal-component analyses were conducted with the same items for each election survey. We analysed vote choice for the 2006, 2008 and 2011 federal elections, focusing only on Quebec.Footnote 3
The first scaleFootnote 4 measures the social dimension with comparable questions across years pertaining to women's issues, the death penalty, views toward immigration and religiosity. It aims to capture policy preferences ranging from socially liberal to socially conservative. The second scale considers the economic dimension of left and right positioning. For this dimension, we include items related to corporate taxes, the role of businesses and the willingness of individuals to move in order to find a job. The third scale looks at the federalism dimension in Quebec. While closely related to sovereignty, it also includes issues of centralization and the balance of power between the federal government and the provinces. All items were rescaled from −1 to 1 so that −1 represented socially liberal, economically left and pro-decentralizing positions respectively and 1 referred to socially conservative, economically right and pro-centralizing placements respectively. Together, the scales define three important components of the ideological map in Quebec. While these dimensions in and of themselves have been far from ignored by previous research, we attempt to examine all three together in a unified approach.
Positioning Parties
With voters positioned along all three dimensions, we now turn to the task of positioning political parties in that same space. We use political party manifestos as a means of tracking party stances. Given that manifestos are approved by party elites and inspired by party conventions, they can be taken as authoritative statements of a political party's positions. We agree with Hinich and Munger (Reference Hinich and Munger1994), who see parties as organizing around ideologies, rather than policy positions, with platforms acting as normative statements of how society should be organized. Furthermore, manifestos are generally issued for every election, meaning that we can examine changes in party positioning over time by looking at one consistent source. While some assert there are downsides to using electoral manifestos to position parties, we believe there are benefits for our study in terms of consistency and reliability that may not be present in techniques such as elite interviews or expert surveys (Castles and Mair, Reference Castles and Mair1984; Laver and Hunt, Reference Laver and Hunt1992).
There are several ways to position political parties using manifesto data and we opt for the Wordscores approach (Laver et al., Reference Laver, Benoit and Garry2003). Unlike human coding or dictionary-based techniques that examine the discursive meaning behind words, Wordscores takes a “language blind” perspective by comparing word frequencies among texts. The underlying assumption is that ideologically similar texts will use the same words more frequently. Thus, this “words as data” approach for deriving underlying policy dimensions from political text consists of generating similarity matrices for sets of texts. This approach has had success in scaling political parties’ positions in various contexts (Klemmensen et al., Reference Klemmensen, Hobolt and Hansen2007; Laver et al., Reference Laver, Benoit and Garry2003). Though the method is not without drawbacks (Lowe, Reference Lowe2008), Wordscores was nonetheless selected for the analysis because an automated approach does not rely on the variability involved in human coding, not to mention cost savings in terms of time and money (King and Lowe, Reference Lowe and King2003; Schrodt and Van Brackle Reference Schrodt, Van Brackle and Subrahmanian2013).
To use the Wordscores approach, one must have both a set of “reference” texts and a set of “virgin” texts. First, the reference texts need researcher-assigned “reference scores” on a given dimension (often obtained through expert surveys). Second, the Wordscores software creates a matrix of word frequencies within and across texts. In order to score a “virgin” text, the word frequencies in an unscored text are compared with the frequencies in the reference texts that already have scores assigned to them on this particular dimension. In short, the Wordscores technique consists of comparing how closely the word frequencies of the unscored texts resemble those of the reference texts with an already known score.
For this study, we obtained BQ and NDP French-language electoral manifestos from the 2006–2011 Canadian federal elections. Next, in order to select the “reference texts,” we consulted an expert survey that evaluated political parties’ positioning on a variety of issues for the 2008 Canadian federal election (Collette and Pétry, Reference Collette, Pétry and Pelletier2012). From this expert survey, we derive the expert scores for each of the political parties on issues that correspond with our three dimensions of interest and assign them to the 2008 manifestos for that particular party. In 2008, the manifesto of each political party is given an expert survey score from −1 to 1 on the economic, social and federalism scales. Wordscores was used to score any “virgin” manifesto along each of the three dimensions using the reference scores assigned to the 2008 BQ, NDP, Liberal and Conservative manifestos. We then score the 2006 and 2011 election manifestos for the BQ and NDP. The raw scores obtained from the software are then transformed and standardized, so that they have the same dispersion metric as the 2008 manifestos (Laver et al., Reference Laver, Benoit and Garry2003).
Using Scales in a Three-Dimensional Co-ordinate System
Most studies that include ideological scales typically use them as unconditional independent predictors in regression models, in conjunction with various controls (for examples, see Fournier et al., 2013; Gidengil et al., Reference Gidengil, Nevitte, Blais, Everitt and Fournier2012). In this study, we create ideological scales that we view as mutually constituent components of ideology in Quebec. Modelling their effect as unconditional independent variables would thereby be incorrect.
The social, economic and federalism scales can be seen as “axes” in a three-dimensional Cartesian space, with a political actor's scores on these same scales acting as co-ordinates.Footnote 5 Conceptualizing political actors’ positions in this way allows us to pinpoint voters and parties in the same space, thereby giving us some measure of ideological “distance” between the former and the latter. We do this by calculating the magnitude of the vector connecting an individual to a party in the 3-D space.Footnote 6 As a result, each voter has two distance scores, one linking him to the BQ and another linking him to the NDP. These can then be seen as indicators of proximity to either party. Thus, the shorter the absolute distance in this space between a voter and a party, the closer they are ideologically. We can subsequently use these distances as independent predictors in regression analyses.
Before proceeding to the analyses, we recognize that the models used do not take into account valence competition. While the role of valence issues has garnered much attention, especially in societies where ideological differentiation has been disappearing (Clarke et al., Reference Clarke, Sanders, Stewart and Whiteley2004), Canada does not fit that mould. Ideology has been playing an increased role in Canadian elections as parties have become more ideologically distinct (Cochrane, Reference Cochrane2010; Cross and Young, Reference Cross and Young2002). Therefore, not to disregard the explanatory nature of valence competition in vote choice but rather to be consistent with current trends in Canadian federal political research, we have chosen to concentrate on the influence of ideological proximity.
Results
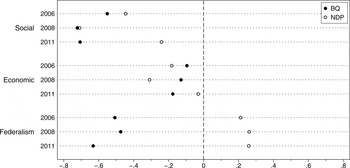
Figure 1 provides a visual demonstration of our approach. The positions of the BQ and NDP are represented on three scales, namely social, economic and federalism axes for the 2006, 2008 and 2011 elections. Results have been centred around the mean Quebec voter, so that one can see just how much closer to or farther away these two parties were from the mean Quebec voter in each election on the three axes. This figure lends support to the idea that the NDP was closer to the mean Quebec voter on all axes in 2011, whereas the BQ gradually distanced itself on the economic and federalism axes over time. Another thing to note is the large differences between the NDP and BQ on the federalism scale, which shows the clear divide over this issue. This is consistent with past findings showing that sovereignty is a strong determinant of vote choice in Quebec at the federal level (Bélanger and Nadeau, Reference Bélanger and Nadeau2009; Blais et al., Reference Blais, Gidengil, Nadeau and Nevitte2002). Second, we see that the two parties have their own dynamics in how they move on social and economic axes from election to election. These distinctive movements may have been masked had we used a single left/right ideological dimension.
Positioning of the BQ and the NDP to Voters Relative to Population

These descriptive statistics offer an interesting overview, but to better explain the role of ideological distance in vote choice, we turn to inferential statistics. We estimate a logistic regression model, where vote for BQ over the NDP is the dependent variable and voter/party proximity is the main predictor. Focusing on these two parties simplifies interpretation, as it allows for direct comparison. This can help explain why a large number of previous BQ voters chose the NDP in 2011.
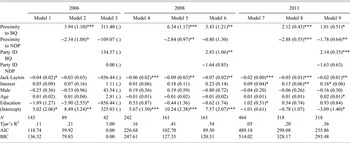
Table 1 presents the results of the regression analysis across the three elections. For each year, we ran a base model consisting only of control variables, followed by a second model that includes voter/party proximity and a third model that includes party identification. Comparing measures of fit between models for each year is striking.Footnote 7 The introduction of the voter/party proximity variables increases the models’ explanatory power by roughly 10 to 25 per cent for each election.Footnote 8
Likelihood of Voting BQ rather than NDP

Note : Log-odds reported as coefficients. Standard errors in parentheses. * p < 0.05, ** p < 0.01, *** p < 0.001
Indeed, voter/party proximity seems to play a statistically significant role in all three elections. Model 2 suggest that in 2006, the closer the voter is to the BQ, the more likely he is to vote for the BQ over the NDP, while controlling for other factors. Inversely, the closer the voter is to the NDP, the less likely a respondent is to vote for the BQ. Consequently, in 2008 and 2011 (models 5 and 8), as the ideological distance between the BQ and a respondent grows, this significantly reduces the likelihood of voting for the BQ. The reverse is also true for the NDP. Hence, the closer an individual is to a party, the more likely she is to vote for this party. This further supports the importance of voter/party proximity and greatly improves our understanding of the vote switch that happened between the BQ and the NDP.
We also control for different factors that could have influenced the vote. First, much has been written about the possible effect of “Layton-mania” (for example, see Fournier et al., Reference Fournier, Cutler, Soroka, Stolle and Bélanger2013). We therefore control for this factor by using a feeling thermometer question about the NDP leader. This variable is significant in almost all models, suggesting that the higher a respondent rates Jack Layton, the more likely he is to vote NDP rather than BQ in all three elections. We also take into account respondents’ interest in the campaign. This control variable fails to reach any level of statistical significance for 2006 and 2008. However, in 2011, the more voters were interested in the campaign, the more likely they were to vote for the BQ over the NDP. Finally, we include three socio-demographic controls: gender, age and education. Results from model 2 suggest that education could have played a role in 2006. Specifically, more educated voters were less likely to vote for the BQ as opposed to the NDP.
We also tested the role of party identification in models 3, 6 and 9. Since the low number of respondents and inclusion of party identification perfectly predicted the outcome in 2006, standard errors are omitted from model 3. However, should voter/party proximity be statistically significant, the direction of the effect would be consistent with models 2, 5 and 8. Turning to model 6, identifying oneself with the BQ increases the probability of voting BQ, as is to be expected. Interestingly, the inclusion of the variable also does not entirely wash out the effect of voter/party proximity in the 2008 election, as voters closer to the BQ choose that party over the NDP. Interestingly, the effects remain significant in 2011 as is shown in model 9: the closer an individual is to the NDP the less likely he is to vote BQ, and vice versa. The addition of party identification in our models gives interesting results. On the one hand, it washes out part of the statistical significance of voter/party proximity for 2008, but on the other hand, it reinforces our argument that proximity played a bigger role in 2011. The controls included in these models also provide interesting findings. Yet again, the effect of Jack Layton's rating is systematic across time, as the higher individuals rate him, the more likely they are to vote NDP. Finally, age is also statistically significant in 2011, suggesting that when controlling for party identification, younger voters also chose to vote NDP.
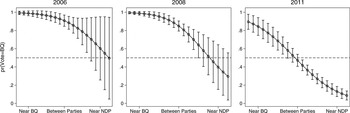
To further assess the effect of ideological proximity, we simplify models 2, 5 and 8 by taking the absolute distance between each respondent and both parties.Footnote 9 This allows us to collapse both measures of distance to the BQ and to the NDP into a single measure, where the negative extreme means that a respondent is positioned exactly the same as the BQ, while being the furthest away from the NDP and vice versa. A score of zero on the scale indicates that a respondent is equidistant to both the BQ and NDP. We then simulate predicted probabilities over the absolute distance between the parties.
Figure 2 presents the resulting simulations. It shows a clear progression of the effect of proximity on vote choice over the three elections. A horizontal line at 50 per cent facilitates interpretation, as it helps to visualize a “tipping point” in terms of voting for one party over the other. In 2006, when voters are equidistant from both the BQ and NDP, they have more than a 90 per cent probability of voting BQ over NDP. In 2008, this predicted probability drops to around 80 per cent. However, the 2011 curve suggests that voter/party proximity played a much bigger role in this election. Indeed, being equidistant to both parties meant an approximately equal chance of voting for either party. Unlike in 2006 and 2008, being closer to the NDP meant a lower chance of voting BQ. However, what was so special about the 2011 election?
Probability of Voting BQ over NDP

Given that the absolute distances in Figure 2 are calculated using the magnitude of the vector connecting a given voter to a party in a three-dimensional space, it would be helpful to look at each dimension separately to see how the predicted probabilities on each dimension changed over time. This allows us to see whether one particular dimension is driving the overall trend.
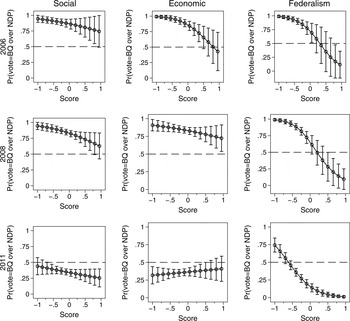
Figure 3 shows the predicted probabilities by dimension and year. These graphs show how the probability of voting BQ over NDP (y-axis) changes as a Quebec voter moves up or down on the scale relevant to the dimension in question (x-axis). Given that the BQ and NDP are left-wing parties, both being socially progressive and economically leftist, it is not surprising to see similar trends on these dimensions. What is most surprising are the graphs for the federalism dimension across the years. In 2011, it appears that BQ supporters were much lower on the federalism scale than in previous years, when the party had managed to capture the median Quebec voter. In other words, the BQ was reduced to its more hardcore base in 2011, as those who chose to vote for the BQ over the NDP had very pro-sovereignty attitudes. The so-called “soft sovereignists” decided to instead vote for the NDP, perhaps due to the factors mentioned by Bélanger and Nadeau (Reference Bélanger, Nadeau, Pammeett and Dornan2011).
Predicted Probabilities of Voting BQ by Dimension

These findings show support for our hypothesis (H1). Voter/party congruence, and more specifically the distance between the electorate and the BQ and the NDP, allow for a better understanding of recent federal elections in Quebec. It especially allows us to unravel some of the mystery surrounding the downfall of the BQ.
Conclusion
To say the least, the results of the 2011 federal election were unexpected and left us with a puzzle about the fall of the province's major federal political party. This study sought to better understand the reversal in electoral fortunes by exploring voter/party congruence through a three-dimensional proximity model.
Our study has yielded two lessons that are applicable beyond Quebec. First, we bring further support to Medeiros and colleagues (2015) who suggest that examining the structure of partisan competition in regionalist contexts through a three-dimensional framework can lead to more nuanced explanations of electoral behaviour. While the federalism cleavage is indeed very prominent in Quebec, economic and social factors also need to be separately taken into account as determinants of both party competition and vote choice. As shown in Figure 1, partisan competition in Quebec takes on differing dynamics depending on the ideological dimension. This result is in line with Lachat's findings (2011) that show that voter/party proximity diverges along different dimensions. The BQ and NDP clearly diverge on the federalism axis, but also differ more than one might think on the social and economic axes separately. Using the sovereignty dimension along with an economic and/or social axis would not provide the same view of party positioning.
The second lesson is a reiteration of the importance of voter/party congruence as a determinant of vote choice. A three-dimensional explanation may be useful here as well. It may seem intuitive to state that voters will gravitate towards whichever party is closest to them. But while a party and its potential voters can seem to be congruent when looking at one or two ideological dimensions, delving deeper by adding another salient dimension may paint a different picture.
Nonetheless, this study is a small step in expanding upon the work done on partisan behaviour in Canadian elections. Further research is necessary to build upon these findings and present a more representative account of voter choice and party competition, particularly in a context where issues other than conventional economic and social matters are salient. The results of this study seem to shed new light on the results of the 2011 federal election in Quebec. The voter/party congruence of the BQ and the NDP with the Quebec electorate helps to explain the switch in electoral success of the two parties, notably by presenting how the NDP became more attractive to less ardent sovereignists. Voter/party congruence thus shows that parties need to “mind the gap” when considering electoral strategies in contexts such as Quebec.
With the benefit of hindsight, we can say that Duceppe's words at the PQ convention were at least partially true. Despite of his original intentions, the BQ's major defeat in that federal election and the PQ voted out of office in 2014, he was indeed right in that in terms of future federal elections in Quebec, tout redevient possible.
APPENDIX
Items used in the construction of the scales
Social Scale
-
• Do you favour or oppose the death penalty for people convicted of murder?
-
• Society would be better off if more women stayed home with their children. Do you strongly agree, somewhat agree, somewhat disagree or strongly disagree?
-
• Do you think Canada should admit: more immigrants, less immigrants, or the same as now?
-
• In your life, would you say religion is very important, somewhat important, not very important or not important at all?
Economy Scale
-
• When businesses make a lot of money, everyone benefits, including the poor. Do you strongly agree, somewhat agree, somewhat disagree or strongly disagree?
-
• If people can't find work in the region where they live, they should more to where the jobs are. Do you strongly agree, somewhat agree, somewhat disagree or strongly disagree?
-
• Should corporate taxes be increased, decreased, or kept about the same as now?
Federalism Scale
-
• How much should be done for Quebec: much more, somewhat more, about the same as now, somewhat less, or much less?
-
• Are you very favourable, somewhat favourable, somewhat opposed, or very opposed to Quebec sovereignty, that is Quebec is no longer a part of Canada?
-
• In general, does the federal government treat your province better, worse, or about the same as other provinces?
-
• Which do you prefer: a strong federal government, or more power to the provincial governments?
Principal-component analyses used to create the scales
These tables present the resulting factor analyses used to determine the dimensions. In the 2008 analysis, views on the death penalty and immigration loaded on a fourth factor. Hence, we dropped those two variables from the construction of the scale for that year.
Factor analysis of dimensions for 2006 using principal-component analysis
N = 199

Factor analysis of dimensions for 2008 using principal-component analysis
N = 392

Factor analysis of dimensions for 2011 using principal-component analysis
N = 574