1 Problem Description
A common problem in predictive modeling is that of calibrating predicted probabilities to observed totals. For example, an analyst may generate individual-level scores
 $p_i \in (0, 1), i = 1, \dots , N,$
to estimate the probability that each of the N registered voters in a particular voting precinct will support the Democratic candidate in an upcoming election. After the election, the analyst can observe the total number of Democratic votes, D, cast among the subset
 $\mathcal {V} \subset \{1, \dots , N\}$
of registered voters who cast a ballot. However, she cannot observe individual-level outcomes due to the secret ballot. In the absence of perfect prediction, the analyst will find that
 $\sum _{i \in \mathcal {V}} p_i \neq D$
. She must decide how to compute recalibrated scores,
 $\tilde p_i$
, to better reflect the realized electoral outcome.
This practical problem has direct implications for public opinion research. For example, Ghitza and Gelman (Reference Ghitza and Gelman2020) recalibrate their Multilevel Regression and Postratification (MRP) estimates of voter support levels after an election to match county-level totals, whereas Schwenzfeier (Reference Schwenzfeier2019) proposes using the amount by which original predictions are adjusted in the recalibration exercise to estimate nonresponse bias in public opinion polls. The problem is also important to campaign work. Campaigns frequently seek to target voters who are likely to have supported their party in the prior presidential election. Estimates of prior party support may also serve as predictor variables in models estimating support in successive elections. Recalibrating the scores to match known aggregated outcomes is a crucial step to improve the scores’ accuracy and bolster future electioneering.
A common heuristic solution to the recalibration problem is the so-called “logit shift” (e.g., Ghitza and Gelman Reference Ghitza and Gelman2013; Ghitza and Gelman Reference Ghitza and Gelman2020; Hanretty, Lauderdale, and Vivyan Reference Hanretty, Lauderdale and Vivyan2016; Kuriwaki et al. Reference Kuriwaki, Ansolabehere, Dagonel and Yamauchi2022).Footnote
1
To motivate this approach, consider a simple scenario in which the
 $p_i$
are generated from a logistic regression model. The recalibrated scores
 $\tilde p_i$
are then computed by uniformly shifting the model’s intercept until the
 $\tilde p_i$
sum to the desired total D, with all other coefficients kept constant.
Explicitly, we define the scalar
 $\alpha \in [0, \infty )$
such that its log is equal to the intercept shift,
 $$ \begin{align} \text{logit}(\tilde p_i) = \text{logit}(p_i) - \log (\alpha), \end{align} $$
where
 $\text {logit}(z) = \log (z / (1 - z))$
. Denote also the inverse of the logit function as
 $\sigma (z) = \exp (z)/(1 + \exp (z)).$
We next define the summed, recalibrated probabilities as a function of
 $\alpha $
,
 $$ \begin{align} h(\alpha) = \sum_{i \in \mathcal{V}} \tilde p_i = \sum_{i \in \mathcal{V}} \sigma\left(\text{logit}(p_i) - \log (\alpha)\right) , \end{align} $$
and solve for the value of
 $\alpha $
that satisfies the equation
 $$ \begin{align} h(\alpha) = D. \end{align} $$
The function
 $h(\cdot )$
is monotonic in
 $\alpha $
, so Equation (3) can be solved in logarithmic time using binary search. The resulting scores
 $\tilde p_i$
are defined explicitly in Equation (1), and they recalibrate the original predictions so that
 $\sum _{i\in \mathcal {V}}\tilde p_i= D$
.
This approach does not depend on how the original
 $p_i$
are estimated—so while it is common for these scores to be obtained via logistic regression, it is possible to implement the logit shift with any model that produces predicted probabilities. An alternative characterization of this approach emerges from information theory: solving Equation (3) is equivalent to finding the set of probabilities
 $\tilde p_i$
which sum to D and minimize the summed Kullback–Leibler divergence (Kullback and Leibler Reference Kullback and Leibler1951) between the distribution induced by
 $\tilde p_i$
and the distribution induced by the original scores
 $p_i$
.Footnote
2
Such a recalibration strategy cannot universally be expected to perform well. As the logit shift is rank-preserving, it cannot correct for substantial heterogeneity in the direction of prediction errors in the individual
 $p_i$
’s (e.g., instances in which prediction errors are negative for Black voters but positive for White voters). Furthermore, as it relies on limited information conveyed by the aggregated outcomes to determine the best value for its constant shift, it cannot rectify instances in which these original predictions get the average scores right, but miss the shape of the true score distribution altogether (e.g., when individual predicted probabilities are bell-shaped, but true probabilities are more uniformly distributed).Footnote
3
In this research note, we provide analytical justification for using the logit shift under circumstances in which it can be expected to generate better-calibrated scores, and illustrate conditions under which this heuristic strategy can fail to improve calibration of a set of predicted probabilities. To do so, we introduce a principled procedure for score updating which computes the updated scores as posterior probabilities, conditional on observed totals. In our running example, this means we treat the original scores
 $p_i$
as a kind of prior Democratic support probability, whereas the updated scores
 $\tilde p_i$
reflect conditional Democratic voting probabilities given observed aggregate outcomes. Next, we show that this Bayesian take on recalibration is well approximated by the heuristic logit shift in large samples, demonstrating this result both analytically and through a simulation study. Then, we rely on similar simulation exercises to illustrate conditions under which the logit shift can fail as a recalibration strategy. We conclude with a discussion of potential extensions of the logit shift for other recalibration problems.
2 Recalibration as a Posterior Update
To motivate the posterior update approach, we introduce additional notation. We define each voter i’s choice as a binary variable
 $W_i \in \{0, 1\}$
, where
 $W_i = 1$
signifies a Democratic vote and
 $W_i = 0$
signifies a Republican vote.Footnote
4
The
 $W_i$
are modeled as independent Bernoulli random variables, where
 $W_i \sim \text {Bern}(p_i)$
. The
 $p_i = \mathbb {P}(W_i = 1)$
can be thought of as the prior, unconditional probability of casting a Democratic vote. In this model, scores can straightforwardly be recalibrated by defining a set of updated scores,
 $\{p_i^{\star }\}$
(which automatically sum to D over actual voters
 $i\in \mathcal {V}$
) using the following conditional probability:
 $$ \begin{align} \begin{aligned} p_i^{\star} &= \mathbb{P} \left( W_i = 1 \,\middle\vert\, \sum_{j \in \mathcal{V}} W_j = D \right)\\ &=\frac{\mathbb{P} \left(W_i = 1, \sum_{j \in \mathcal{V}} W_j = D\right)}{\mathbb{P}\left(\sum_{j \in \mathcal{V}} W_j = D\right)}\\ &= p_i \times \frac{ \mathbb{P} \left( \sum_{j\neq i} W_j = D - 1\right)}{\mathbb{P}\left(\sum_{j \in \mathcal{V}} W_j = D\right)}, \end{aligned} \end{align} $$
where a sum taken over “
 $j \neq i$
” is understood to mean a sum over all voters in
 $\mathcal {V}$
other than i.
From the final line of Equation (5), we observe that the recalibrated
 $p_i^{\star }$
is obtained by multiplying the original
 $p_i$
by a unit-specific probability ratio. The numerator represents the probability that there are
 $D-1$
Democratic votes among all voters in
 $\mathcal {V}$
except voter i, whereas the denominator represents the probability that there are D Democratic votes among all voters in
 $\mathcal {V}$
. Given our assumptions about the
 $W_i$
, computing each of these probabilities requires evaluating the distribution function of a Poisson–Binomial random variable, which emerges as the sum of independent but not identically distributed Bernoulli random variables (Chen and Liu Reference Chen and Liu1997).
While simple and theoretically elegant, this recalibration approach is highly impractical. Calculation of Poisson–Binomial probabilities is extremely computationally demanding even at moderate sample sizes, despite recent advances in the literature (Junge Reference Junge2020; Olivella and Shiraito Reference Olivella and Shiraito2017). To compute the recalibrated
 $p_i^{\star }$
values, we would need to compute one unique Poisson–Binomial probability for each voter. Hence, if the number of actual voters
 $|\mathcal {V}|$
were even modestly large, it would be computationally infeasible to obtain these exact posterior probabilities.
2.1 The Logit Shift Approximates the Recalibrating Posterior
2.1.1 Preliminaries
In this section, we show analytically why the logit shift is a good approximation to the posterior update in Equation (5). We begin by defining two terms. In direct analogy to the right-hand side of Equation (2), we define the function
 $$\begin{align*}f(s, t) = \sigma\left(\text{logit}(s) + \log(t)\right) = \frac{1}{1 + \frac{1-s}{s}(t)}. \end{align*}$$
Next, we define the Poisson–Binomial ratio
 $$\begin{align*}\phi_i = \frac{\mathbb{P}\left(\sum_{j \neq i} W_j = D\right)}{\mathbb{P}\left(\sum_{j \neq i} W_j = D-1\right)}.\end{align*}$$
Simple substitution, along with a useful recursive property of the Poisson–Binomial distribution,Footnote 5 makes clear that
 $$ \begin{align} \begin{aligned} \sum_{i\in\mathcal{V}}f(p_i, \phi_i) &= \sum_{i\in\mathcal{V}}\frac{1}{1 + \frac{1-p_i}{p_i} \phi_i}\\ & = \sum_{i\in\mathcal{V}}\frac{1}{1 + \frac{1-p_i}{p_i} \frac{\mathbb{P}\left(\sum_{j \neq i} W_j = D\right)}{\mathbb{P}\left(\sum_{j \neq i} W_j = D-1\right)} } \\ &= \sum_{i\in\mathcal{V}}\frac{p_i\times\mathbb{P}\left(\sum_{j \neq i} W_j = D-1\right) }{ p_i\times\mathbb{P}\left(\sum_{j \neq i} W_j = D-1\right) + (1-p_i)\times\mathbb{P}\left(\sum_{j \neq i} W_j = D\right) } \\ &= \sum_{i\in\mathcal{V}}\frac{\mathbb{P} \left(W_i = 1, \sum_{i\in\mathcal{V}} W_i = D\right)}{\mathbb{P}\left(\sum_{i\in\mathcal{V}} W_i = D\right)} \\ & =\sum_{i\in\mathcal{V}} p_i^{\star}\\ &=D. \end{aligned} \end{align} $$
In words, Equation (6) shows that the unit-specific
 $\phi _i$
is precisely the “shift” (in the sense of the second argument to the function f) that turns each
 $p_i$
into the desired, recalibrated posterior probability
 $p_i^{\star }$
. The logit shift, however, uses a constant
 $\alpha $
to approximate the vector of recalibrating shifts
 $\{\phi _i\}_{i \in \mathcal {V}}$
. What remains, therefore, is to show that the single value of
 $\alpha $
that solves Equation (3) is a very good approximation of
 $\phi _i$
for all values of i.
To do so, we establish that the value of
 $\alpha $
is bounded by the range of
 $\{\phi _i\}_{i \in \mathcal {V}}$
, and that each
 $\phi _i$
, in turn, has well-defined bounds. This will allow us to find that, in practice, the range of values that the unit-specific shifts
 $\phi _i$
can take is very small, and thus that a constant shift
 $\alpha $
can approximate them very well.
Theorem 1. The value of
 $\alpha $
which solves Equation (3) satisfies
 $$\begin{align*}\min_i \frac{\mathbb{P}\left(\sum_{j \neq i} W_j = D\right)}{\mathbb{P}\left(\sum_{j \neq i} W_j = D-1\right)} \leq \alpha \leq \max_i \frac{\mathbb{P}\left(\sum_{j \neq i} W_j = D\right)}{\mathbb{P}\left(\sum_{j \neq i} W_j = D-1\right)}. \end{align*}$$
Proof. The proof can be found in the Supplementary Material.
Theorem 2. For any choice of
 $i \in \mathcal {V}$
, we have
 $$\begin{align*}\frac{\mathbb{P}\left(\sum_{j \in \mathcal{V}} W_j = D + 1\right)}{\mathbb{P}\left(\sum_{j \in \mathcal{V}} W_j = D\right)}\leq \frac{\mathbb{P}\left(\sum_{j \neq i} W_j = D\right)}{\mathbb{P}\left(\sum_{j \neq i} W_j = D-1\right)}\leq \frac{\mathbb{P}\left(\sum_{j \in \mathcal{V}} W_j = D\right)}{\mathbb{P}\left(\sum_{j \in \mathcal{V}} W_j = D-1\right)} .\end{align*}$$
Proof. The proof can be found in the Supplementary Material.
2.1.2 Main Results
The bounds from Theorem 2 apply regardless of the choice of i, so we can combine the two theorems to observe
 $$ \begin{align} \begin{aligned} \frac{\mathbb{P}\left(\sum_{j \in \mathcal{V}} W_j = D + 1\right)}{\mathbb{P}\left(\sum_{j \in \mathcal{V}} W_j = D\right)} &\leq \min_i \frac{\mathbb{P}\left(\sum_{j \neq i} W_j = D\right)}{\mathbb{P}\left(\sum_{j \neq i} W_j = D-1\right)} \leq \alpha \\ & \leq \max_i \frac{\mathbb{P}\left(\sum_{j \neq i} W_j = D\right)}{\mathbb{P}\left(\sum_{j \neq i} W_j = D-1\right)} \leq \frac{\mathbb{P}\left(\sum_{j \in \mathcal{V}} W_j = D\right)}{\mathbb{P}\left(\sum_{j \in \mathcal{V}} W_j = D-1\right)}. \end{aligned} \end{align} $$
This is useful, because we can now use the outer bounds in Equation (7) to obtain a bound on the approximation error when estimating recalibrated scores
 $p_i^{\star }$
(obtained from the posterior update approach) via
 $\tilde p_i$
(obtained from the logit shift).
Theorem 3. For large sample sizes, we obtain
 $$\begin{align*}\tilde p_i = p_i^{\star} + \mathcal{O} \left( \frac{1}{\sum_{j \in \mathcal{V}} p_j (1-p_j)} \right). \end{align*}$$
Proof. The proof can be found in the Supplementary Material.
Theorem 3 relies on the tightness of the bound in (7). Under the assumption of an independent Bernoulli sampling model for individual vote choices, the upper and lower bounds differ by a factor inversely proportional to the variance of D—the Poisson–Binomial variable representing total votes for the Democratic candidate. Theorem 3 states that the error in using the logit shift to approximate the posterior recalibration update is bounded by a term of the same order.
Thus, Theorem 3 implies that the magnitude of the approximation error is inversely proportional to sample size, and becomes quite small for large enough samples. As the binding bounds in Equation (7) are tight for even moderately large
 $|\mathcal {V}|$
, the approximation can be expected to perform well in most practical settings.
However, Theorem 3 does not imply that the logit shift is a universally good recalibration strategy. Rather, it implies that when a strategy like the posterior update is appropriate, the logit shift offers a very close approximation at a low computational cost. Next, we illustrate the approximation’s accuracy for even modestly sized electorates, under various possible score distributions, using a simple Monte Carlo simulation.
2.2 Numerical Precision Simulations
To illustrate the precision of the logit shift approximation, we simulate two scenarios: a small-sample case (where
 $|\mathcal {V}|=100$
) and a more typical, modestly sized sample case (with
 $|\mathcal {V}|=1,000$
).Footnote
6
We draw the initial probabilities
 $p_i$
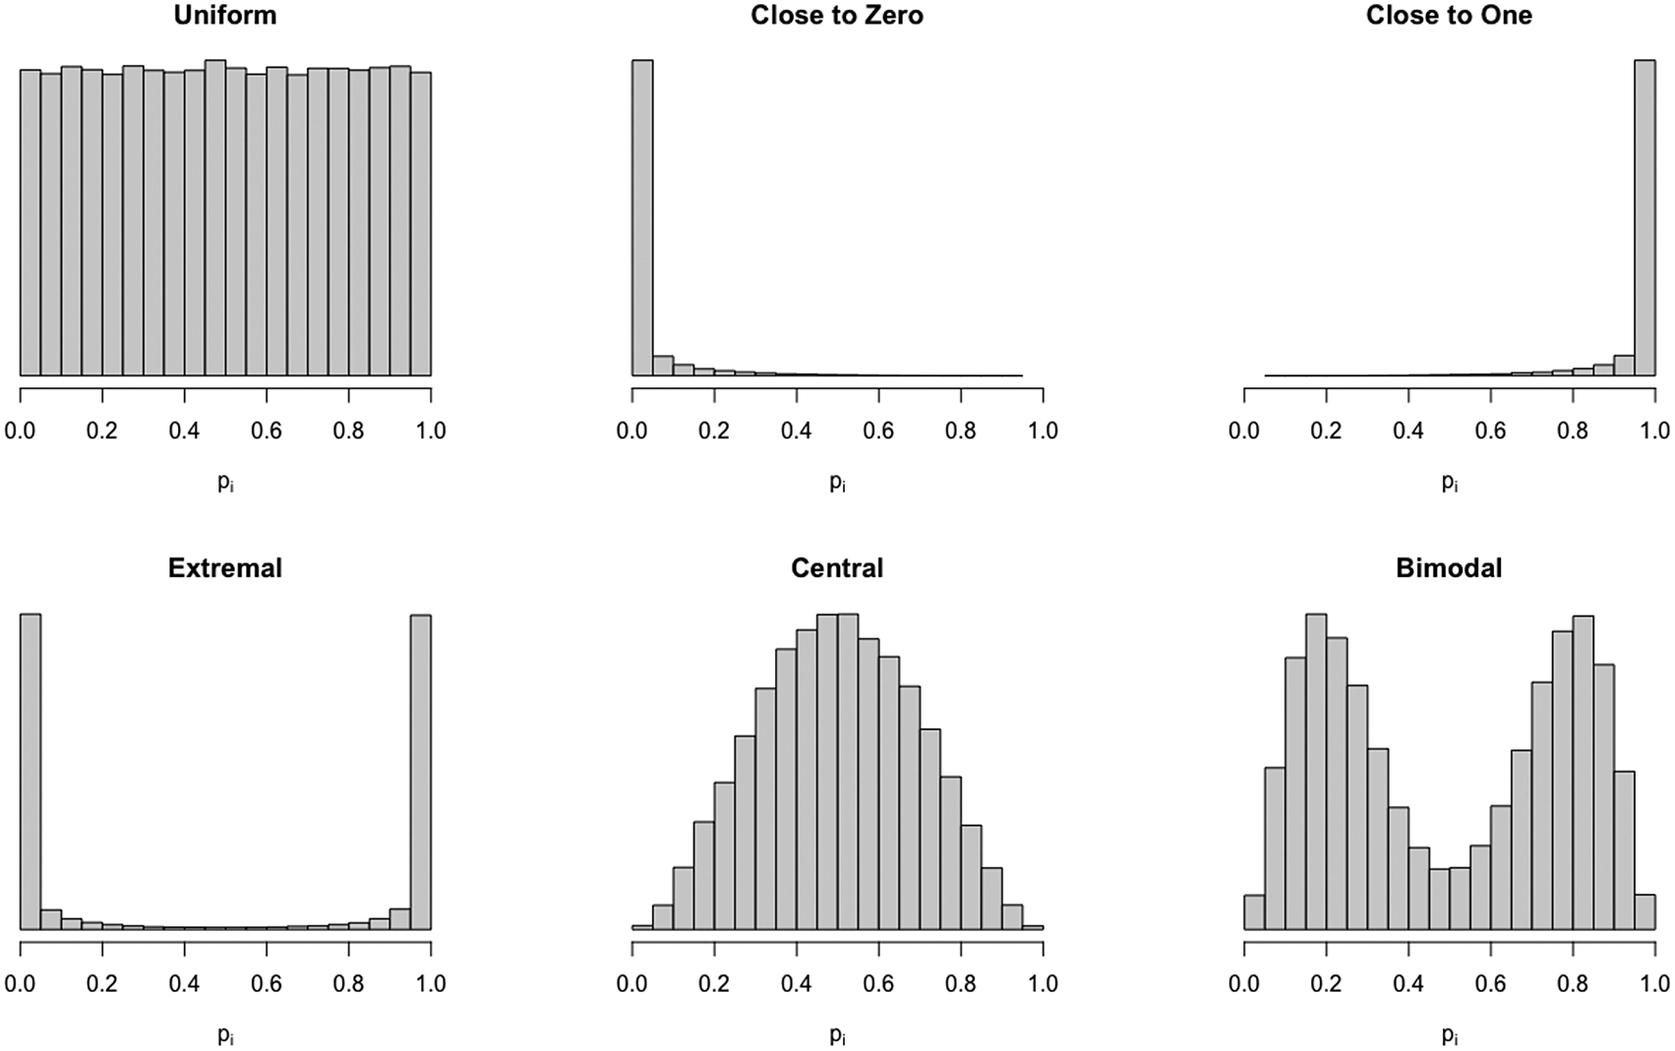
according to the six distributions discussed in Biscarri, Zhao, and Brunner (Reference Biscarri, Zhao and Brunner2018). We consider the case in which the observed D is 20% below the expectation,
 $\sum _i p_i$
. The six distributions are visualized in Figure 1.
The distributions used in simulations in Section 2.2. We assume that the initial scores
 $p_i$
and the true probabilities
 $p_i^{\text {true}}$
are drawn from each of these six distributions. These are the same as the distributions provided in Biscarri, Zhao, and Brunner (Reference Biscarri, Zhao and Brunner2018).

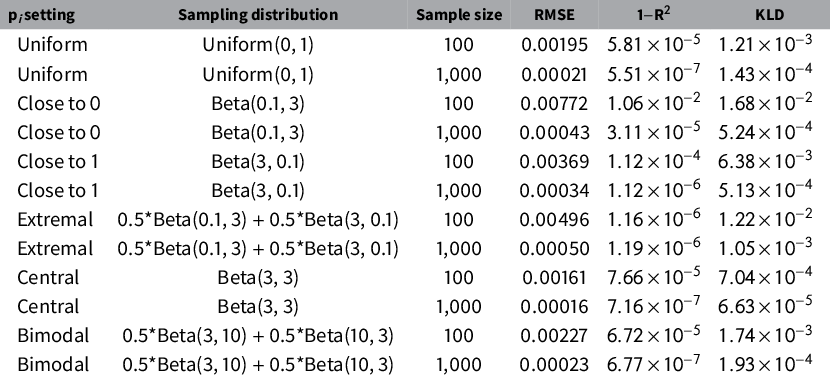
We compute the exact posterior probabilities using Biscarri’s algorithm as implemented in the PoissonBinomial package (Junge Reference Junge2020), and compare it against the estimates obtained using the logit shift heuristic. We report the RMSE, the proportion of variance in the posterior probabilities
 $p_i^{\star }$
that is not explained by our method, and the summed Kullback-Leibler (KL) divergence. Results are given in Table 1.
Discrepancy between the logit shift and the exact Poisson–Binomial probabilities (as measured by RMSE,
 $1 - R^2$
, and KL divergence), under various settings. All results are calculated in the case where the observed D is equal to
 $0.8 \times \sum_i p_i\kern-1pt$
.

These results demonstrate that the logit shift and the posterior probability approach are virtually identical, as expected. Across a wide variety of distributions, we find that the two approaches deviate only nominally—even in small samples of 100 voters. Moreover, as expected, the approximation gets even more accurate as the sample size increases, as illustrated by the reduction across error metrics (sometimes of several orders of magnitude) as we move from 100 to 1,000 voters.
As an approximation, then, the logit shift can be expected to work well when the target total it relies on is based on at least a modest number of voters. We now turn to the question of when we can expect the logit shift to work as a calibration strategy.
3 Why the Logit Shift Can Fail To Generate Well-Calibrated Predictions
The close correspondence between the logit shift and the full posterior update need not mean that the logit shift produces better calibrated scores in all cases. Probabilities updated through the logit shift maintain the same ordering of the original predictions,Footnote 7 and can only correct predicted score distributions that misrepresent the location (rather than the overall shape) of the true score distribution. These limitations can prevent the updated scores from improving the calibration of predicted probabilities, and can even exacerbate calibration problems among subsets of voters.
We discuss how these issues can manifest in practice, and illustrate the potential problems using Monte Carlo simulations. We again adopt the independent Bernoulli model of Section 2, associating with each individual a true Democratic support probability
 $p_i^{\text {true}}$
as well as an initial predicted score
 $p_i$
. We investigate whether logit shifting the
 $p_i$
scores generates updated predictions
 $\tilde p_i$
that are more closely aligned with
 $p_i^{\text {true}}$
than the original scores
 $p_i$
.
3.1 Heterogeneity and Target Aggregation Levels
Perhaps the most serious limitation of the logit shift stems from the fact that it cannot alter the ordering of the original probabilities
 $p_i$
. This has implications for the ideal grouping level at which we conduct the logit shift. Throughout this note, we have supposed that the logit shift is used within each voting precinct to generate updated scores whose sum is equal to the precinct’s vote total. Yet it is entirely plausible (and indeed common in academic research) to conduct the update at higher levels of aggregation, e.g., counties or states.
Executing the update at higher levels of aggregation, however, can imply more heterogeneity in prediction errors—heterogeneity that may not be correctable using the rank-preserving logit shift with a single target total (Kuriwaki et al. Reference Kuriwaki, Ansolabehere, Dagonel and Yamauchi2022). To see why, consider an example in which there are two groups of voters: Black voters and White voters. Suppose that for all Black voters,
 $p_i = 0.7$
and
 $p_i^{\text {true}} = 0.8$
, whereas for all White voters,
 $p_i = 0.3$
and
 $p_i^{\text {true}} = 0.2$
—i.e., the initial scores underestimate Democratic support among Black voters and overestimate Democratic support among White voters. The logit shift will either increase or decrease all probabilities within a given grouping. Suppose that we choose a high level of aggregation—e.g., the state level—at which to conduct the logit shift, and White voters constitute a large majority of the state’s voters. The predicted tally of Democratic votes will significantly overshoot the observed vote count D. Hence, the logit shift will adjust all voters’ Democratic support probabilities downward. This will yield improved predictions for all White voters, but worse predictions for Black voters, whose initial projected support levels were too low rather than too high.
To illustrate the potential issues raised by heterogeneity, we simulate a two-group situation like the one just described. We suppose that there are only White and Black voters present in a precinct of
 $n = 1,000$
individuals, and again suppose that the initial scores are drawn from the same six probability distributions visualized in Figure 1. We assume further that the majority of voters are White, and that their Democratic support probabilities are overestimated by 10 percentage points, whereas a minority of voters are Black, and their Democratic support probabilities are underestimated by 10 percentage points.Footnote
8
Crucially, the ordering of
 $p_i$
and
 $p_i^{\text {true}}$
is not the same in this setting.
We consider three racial proportions within the precinct: a 70–30 split of White and Black voters, an 80–20 split, and a 90–10 split. In each case, we sample the initial scores
 $p_i$
; then compute the true probabilities
 $p_i^{\text {true}}$
; then sample the aggregated outcomes, and conduct the logit shift of
 $p_i$
. We then report
 $$\begin{align*}\frac{\text{cor}(\tilde p_i, p_i^{\text{true}}) - \text{cor}(p_i, p_i^{\text{true}})}{\text{cor}(p_i, p_i^{\text{true}})} \end{align*}$$
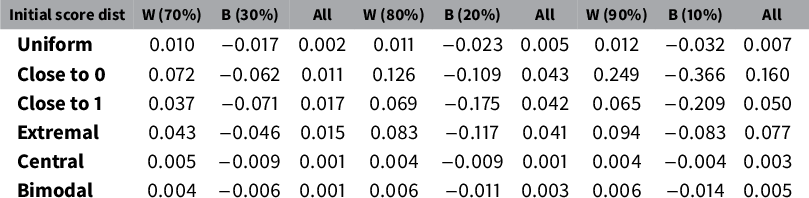
as our success metric. Positive values mean that the logit shift has improved the correlation with the true probabilities, whereas negative values indicate that the logit shift has worsened the correlations with the true probabilities. We compute the quantity separately for Black and White voters, and report results in Table 2.
We consider three racial proportions within the precinct, and report
 $\frac {\text {cor}(\tilde p_i, p_i^{\text {true}}) - \text {cor}(p_i, p_i^{\text {true}})}{\text {cor}(p_i, p_i^{\text {true}})}$
separately for White and Black voters in each pair of columns. Initial scores are drawn from a different distribution in each row. Positive values means the logit shift has improved the correlation with the true probabilities, whereas negative values mean the logit shift has worsened the correlations with the true probabilities.

As expected, in each setting, scores get better for White voters and worse for Black voters. The relative changes are largest when the precinct is 90% White, in which case significant accuracy can be lost for Black voters. The correlation computed over all voters improves in these more homogeneous precincts, as large improvements are achieved for a large proportion of the voters therein (i.e., for White voters).
Accordingly, using a lower level of aggregation—e.g., voting precincts—will ameliorate the problem only if precincts are more racially homogeneous than the state as a whole. While the errors may increase for the minority in the more homogeneous context, the overall calibration of the updated scores would increase, as a larger proportion of the voters would be accurately adjusted. Thankfully, we can generally expect greater homogeneity within smaller aggregation units than what would be observed in the electorate as a whole.
Theorem 4. Consider two sets of aggregation units,
 $\mathcal {A}$
and
 $\mathcal {B}$
, with the
 $\mathcal {A}$
units nested inside the
 $\mathcal {B}$
units. Then, for each
 $\mathcal {B}$
unit, the overall proportion of people comprising a minority within their
 $\mathcal {A}$
unit is at least as small as the proportion of people comprising a minority within the enclosing
 $\mathcal {B}$
unit.
Proof. The proof can be found in the Supplementary Material.
For example, based on the 2020 Census data and census race/ethnicity categories, 39.8% of the voting-age population was a minority nationwide, 38.7% was a minority within their state, 35.3% was a minority within their county, 28.7% was a minority within their tract, and 12.9% was a minority within their Census block (U.S. Census Bureau 2021). This implies that researchers and practitioners would benefit from applying the logit shift at the lowest level of aggregation for which aggregate data are available—provided the number of votes being aggregated is large enough to ensure that the logit shift accurately approximates the posterior update.Footnote 9
3.2 Limits to What Can Be Learned From a Total
While it is clear that the logit shift cannot fully ameliorate errors when the ordering of
 $p_i$
and
 $p_i^{\text {true}}$
differs, it is also possible to observe little improvement in calibration even in contexts in which the initial ordering is correct. In such instances, we will only see gains from applying the logit shift if the observed target total D differs substantially from the expected total under the set of initial scores.
To see why, recall that the logit shift (and the posterior it approximates) relies only on information about the aggregated outcomes to update individual scores. This total is most informative about the mean of the true individual probabilities, as differently shaped distributions of
 $p_i^{\text {true}}$
that are consistent with the observed total can share the same mean, but distributions with different means will typically result in different observed totals. As a result, even if initial individual scores are ranked correctly, the extent to which the observed total will provide useful information will depend on the extent to which the mean of the initial scores differs from the mean of the true probabilities. This highlights an important weakness of the logit shift: it cannot correct for an incorrect shape of the initial score distributions, but only for an incorrect mean.
To illustrate this issue through simulation, we use the same six probability distributions used in Table 1, but we alter the setup. Consider each of the 36 possible pairs of distributions. For each pair, we sample 1,000 voters such that the true probabilities
 $p_i^{\text {true}}$
follow the first distribution, and the initial scores
 $p_i$
follow the second distribution, but the rank of each unit i is identical within each of the two distributions. We sample the outcomes under the Bernoulli model, and conduct the logit shift on the initial scores
 $p_i$
to generate the updated scores
 $\tilde p_i$
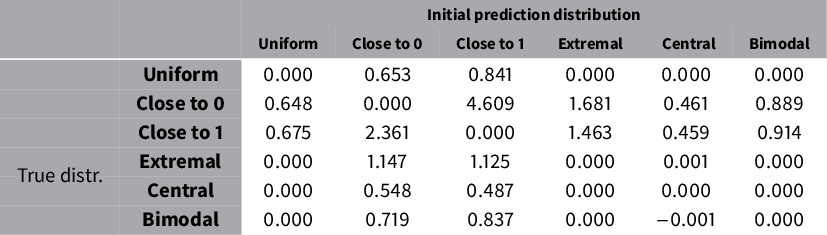
. Table 3 reports the results, with each entry again presenting
 $$\begin{align*}\frac{\text{cor}(\tilde p_i, p_i^{\text{true}}) - \text{cor}(p_i, p_i^{\text{true}})}{\text{cor}(p_i, p_i^{\text{true}})} \end{align*}$$
from the simulation involving the corresponding distributions.
In each cell, we report
 $\frac {\text {cor}(\tilde p_i, p_i^{\text {true}}) - \text {cor}(p_i, p_i^{\text {true}})}{\text {cor}(p_i, p_i^{\text {true}})}$
when the initial scores and true probabilities are drawn from the respective row and column distributions. Positive values means the logit shift has improved the correlation with the true probabilities, whereas negative values mean the logit shift has worsened the correlations with the true probabilities.

Recall that the uniform, extremal, central, and bimodal distributions all have means of 0.5. As expected, if both the true probability distribution and the initial score distribution have the same mean, the correlation shifts are essentially zero. In contrast, much larger improvements in correlation are seen when the skewed “Close to 0” and “Close to 1” distributions (which have means of 0.032 and 0.968, respectively) are used. The intuition is clear: the observed precinct total is much more informative when it differs drastically from the mean of the initial scores.
4 Discussion
In this paper, we have considered the problem of updating voter scores to match observed vote totals from an election. We have shown that the simple “logit shift” algorithm is a very good approximation to computing the exact posterior probability that conditions on the observed total. This is a useful insight for campaign analysts and researchers alike, because the logit shift is significantly more computationally efficient than the calculation of the exact posterior recalibration update, yet the approximation is extremely accurate even in small samples.
We have also discussed limitations of this approach in terms of its ability to recover a true set of individual support probabilities. Crucially, logit-shifted probabilities retain the same ordering as the initial set of scores, which implies that the original scoring model must discriminate positive and negative (but unobservable, in the case of voting) individual cases well. Users of the logit shift can increase the chances of having correctly ranked initial scores by applying the logit shift at low levels of aggregation, where heterogeneity of prediction errors is likely to be low. In turn, users can expect to see little improvements to calibration when their initial scores capture the correct mean of the true unit probabilities, even if the shape of the true and predicted score distributions differ. The limits of what can be learned from a single aggregated outcome about individual probabilities makes this problem hard to address in practice.
While not without pitfalls, the logit shift represents a useful and computationally efficient method of updating individual-level scores to incorporate information from a completed election. Furthermore, recent developments can help correct some of the limitations we have highlighted. For instance, minimizing differences with respect to multiple aggregated targets can help resolve issues raised by heterogeneity in prediction errors among subgroups, and provide more information about the shape of the distribution of true probabilities (e.g., Kuriwaki et al. Reference Kuriwaki, Ansolabehere, Dagonel and Yamauchi2022). A fruitful avenue for future research would explore whether these attempts can also be justified as approximations to a posterior update that conditions on multiple totals, highlighting the connections between the logit shift and the problem of ecological inference (e.g., King, Tanner, and Rosen Reference King, Tanner and Rosen2004; Rosenman Reference Rosenman2019). Establishing those connections represents a promising potential extension of the insights provided in this note.
Data Availability Statement
Replication code for this article is available in Rosenman et al. (Reference Rosenman, McCartan and Olivella2022), at https://doi.org/10.7910/DVN/7MRDUW.
Supplementary Material
For supplementary material accompanying this paper, please visit https://doi.org/10.1017/pan.2022.31.