Introduction
In recent years, industrial wastewater has already become one of the most critical environmental problems, which is endangering human health. Among various remediation technologies, photocatalytic degradation is more attractive because the pollutants in the water can be completely mineralized into carbon dioxide and water molecules [Reference Zou, Ye, Sayama and Arakawa1, Reference Kubacka, Fernandez-Garcia and Colon2]. Semiconductor with two-dimensional (2D) nanostructure has been proved to be a promising nanomaterial for realizing efficient solar energy utilization in photocatalytic field owing to the abundant surface structure and the diffusion distance for the photoexcited electron–hole pairs moving to the photocatalyst surface was distinctly shortened [Reference Wang, Zhang and Xie3, Reference Liu, Zeng, Hu, Hu and Zhang4].
As an important n-type semiconductor with a band gap of 2.4–2.8 eV, WO3 has been used as a good visible right–responsive photocatalyst for O2 generation and the degradation of organic pollutants in the wastewater [Reference Li, Krissanasaeranee, Pattinson, Stefik, Wiesner, Steiner and Eder5, Reference Guo, Quan, Lu, Zhao and Chen6, Reference Sayama, Hayashi, Arai, Yanagida, Gunji and Sugihara7, Reference Wang, Wang, Li, Fang, Zhao, Du, Chen and Yang8, Reference Sumathi, Prakasam and Anbarasan9, Reference Zhao and Miyauchi10, Reference Chen and Ye11, Reference Wang, Zhang, Zhu, Yan, Li, Chen, Hu, Suo and Wang12]. Due to the strong correlation between the photocatalytic activity and the microstructure of photocatalysts, studies on the shape controllable synthesis of WO3 photocatalysts have attracted a great interest. So far, many efforts have been made to synthesize nanostructured WO3 with various morphologies, such as nanorods [Reference Shinde, Lokhande, Patil and Lokhande13], nanowires [Reference Chen, Wang and Zhu14], ultra-thin nanosheets [Reference Liang, Yang, Zou, Xu, Luo, Luo, Li, Yang, Shi and Yuan15], nanoribbons [Reference Lian, Xiao, Chen, Liu, Zhao, Wang, Chen and Li16], nanotubes [Reference Zhao and Miyauchi17], nanoplates [Reference Soltani, Tayyebi and Lee18], microspheres [Reference Zhang, Wang, Liu, Ma and Zhu19], WO3 nanostructure arrays [Reference Zhou, Lin, Chen and Gaskov20], and carpet-like microflowers [Reference Han, Chen, Zhang, Liu, Zhang and Cao21]. Although many achievements have come true, how to obtain the desired morphologies and sizes of WO3 to achieve the superior photocatalytic activity is still in need of further exploration.
Herein, uniform WO3 2D nanocubes have been fabricated successfully through a hydrothermal synthesis technology without the assistance of any surfactants in the acidic conditions. The growth of WO3 nanocubes has been investigated by adjusting reaction temperature and time, and the crystal formation mechanism was proposed simply. Under visible light illumination, the photocatalytic activity of as-prepared WO3 nanocubes for degrading rhodamine B (RhB) was higher than that of WO3·H2O and WO3·0.33H2O/WO3, which were prepared at the contrast experimental conditions.
Results and discussion
Characterization of WO3 nanocubes
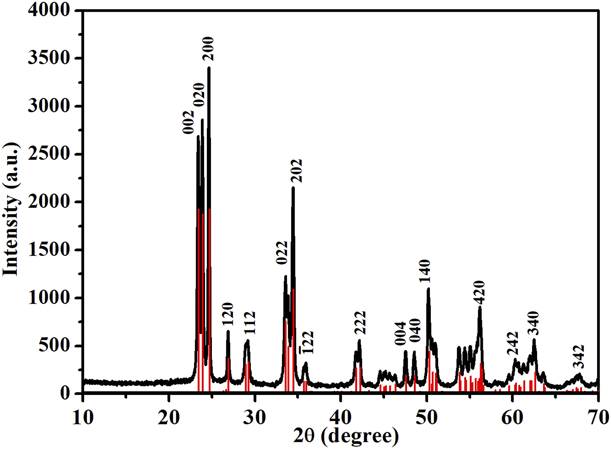
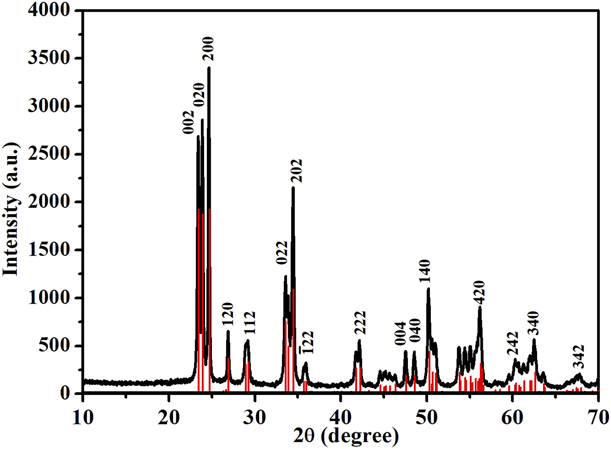
Figure 1 shows the X-ray diffraction (XRD) pattern of the as-prepared product derived from the hydrothermal treatment at 200 °C for 24 h. It can be seen that all the reflection peaks can be easily indexed to the monoclinic WO3 phase with the lattice constants of a = 7.297 Å, b = 7.539 Å, and c = 7.688 Å, which are consistent with the literature values (JCPDS No. 71-2141). No other characteristic peaks for impurities were detected. The intense and sharp reflection peaks suggest that the as-prepared WO3 products are of highly crystalline.
XRD pattern of as-synthesized WO3 nanocubes.
The obtained samples were investigated by field-emission scanning electron microscopy (FESEM) to study the overall morphologies. Figure 2 displays the low-magnification and high-magnification FESEM images of the WO3 product obtained at 200 °C for 24 h. Large amounts of uniform and regular nanocubes are found in the products. The surfaces of these nanocubes are comparatively smooth. The edge length and thickness of them are estimated to be 100–160 nm and 20–60 nm, respectively. Due to the high surface Gibbs free energy, two or three nanocubes are overlapped with each other to form a so-called layer-by-layer self-assembly aggregates [indicated by the white dashed circle in Fig. 2(b)].
(a) Low-magnification and (b) high-magnification FESEM images of as-synthesized WO3 nanocubes.

Influencing factor and growth mechanism
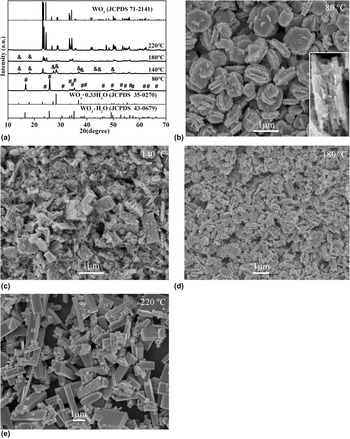
In the present system, the crystal phases and morphologies of products were greatly influenced by the reaction temperature and time. Keeping the other parameters constant, the products were obtained under different experimental temperatures in the range of 80–220 °C. The XRD patterns of all samples prepared at the temperature of 80–220 °C are shown in Fig. 3(a). When the reaction temperature is 80 °C, pure orthorhombic WO3·H2O [JCPDS 43-0679, marked by “#” in Fig. 3(a)] can be obtained, and the morphologies of them are shown in Fig. 3(b), which indicates that dozens of nanosheets with thicknesses of 30–40 nm stacked with each other to form round-shaped aggregates with sizes of 0.5–1 μm, and there are many nanoparticles adhering on their surfaces. As the temperature is increased to 140 °C, the products obtained are the mixture of orthorhombic WO3·0.33H2O [JCPDS 35-0270, marked by “&” in Fig. 3(a)] and monoclinic WO3 (JCPDS 71-2141), and their morphologies are presented in Fig. 3(c); cube-like crystals and nanoparticles are found. When the reaction temperature is 180 °C, large amounts of WO3 nanocubes are generated except for the presence of little WO3·0.33H2O [Fig. 3(d)]. At the temperature of 200 °C, uniform and regular nanocubes with pure monoclinic WO3 phase are obtained (Fig. 2). However, when the hydrothermal temperature is up to 220 °C, large and long WO3 prisms with rectangular cross sections are produced [Fig. 3(e)].
(a) XRD patterns of samples prepared under different temperature (&: orthorhombic WO3·0.33H2O; #: orthorhombic WO3·H2O). (b–e) FESEM images of samples prepared under different temperatures: (b) 80 °C, (c) 140 °C, (d) 180 °C, and (e) 220 °C.

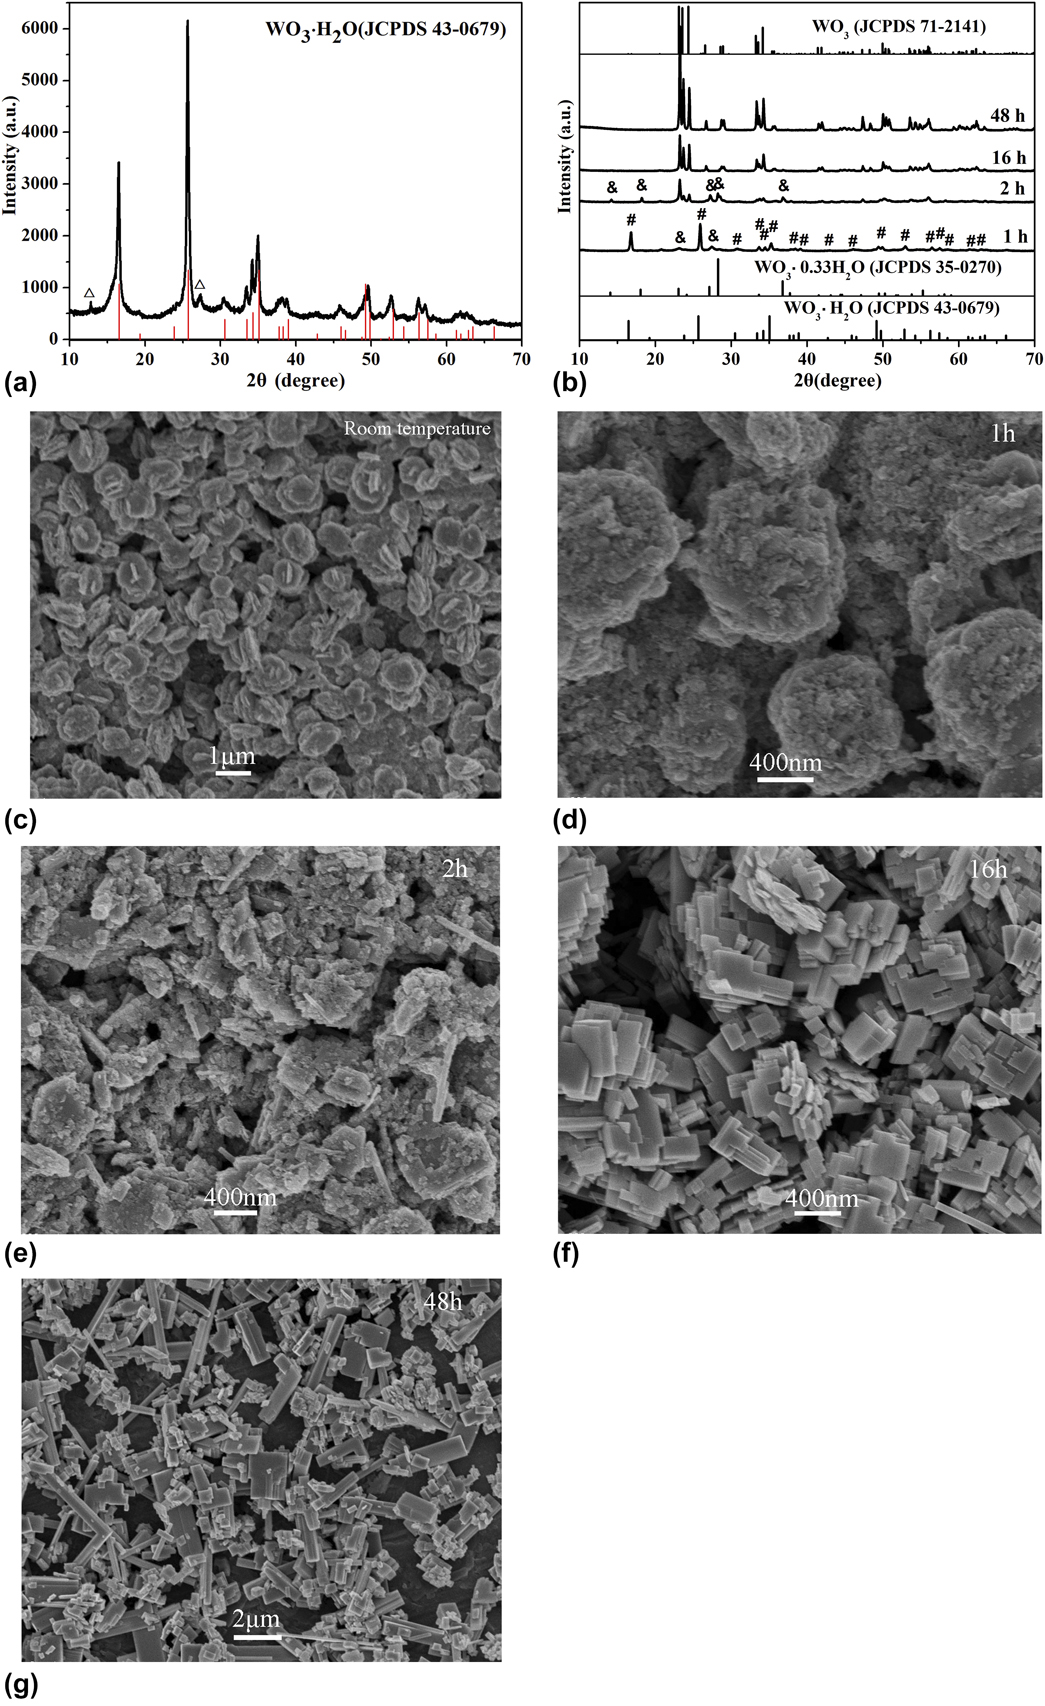
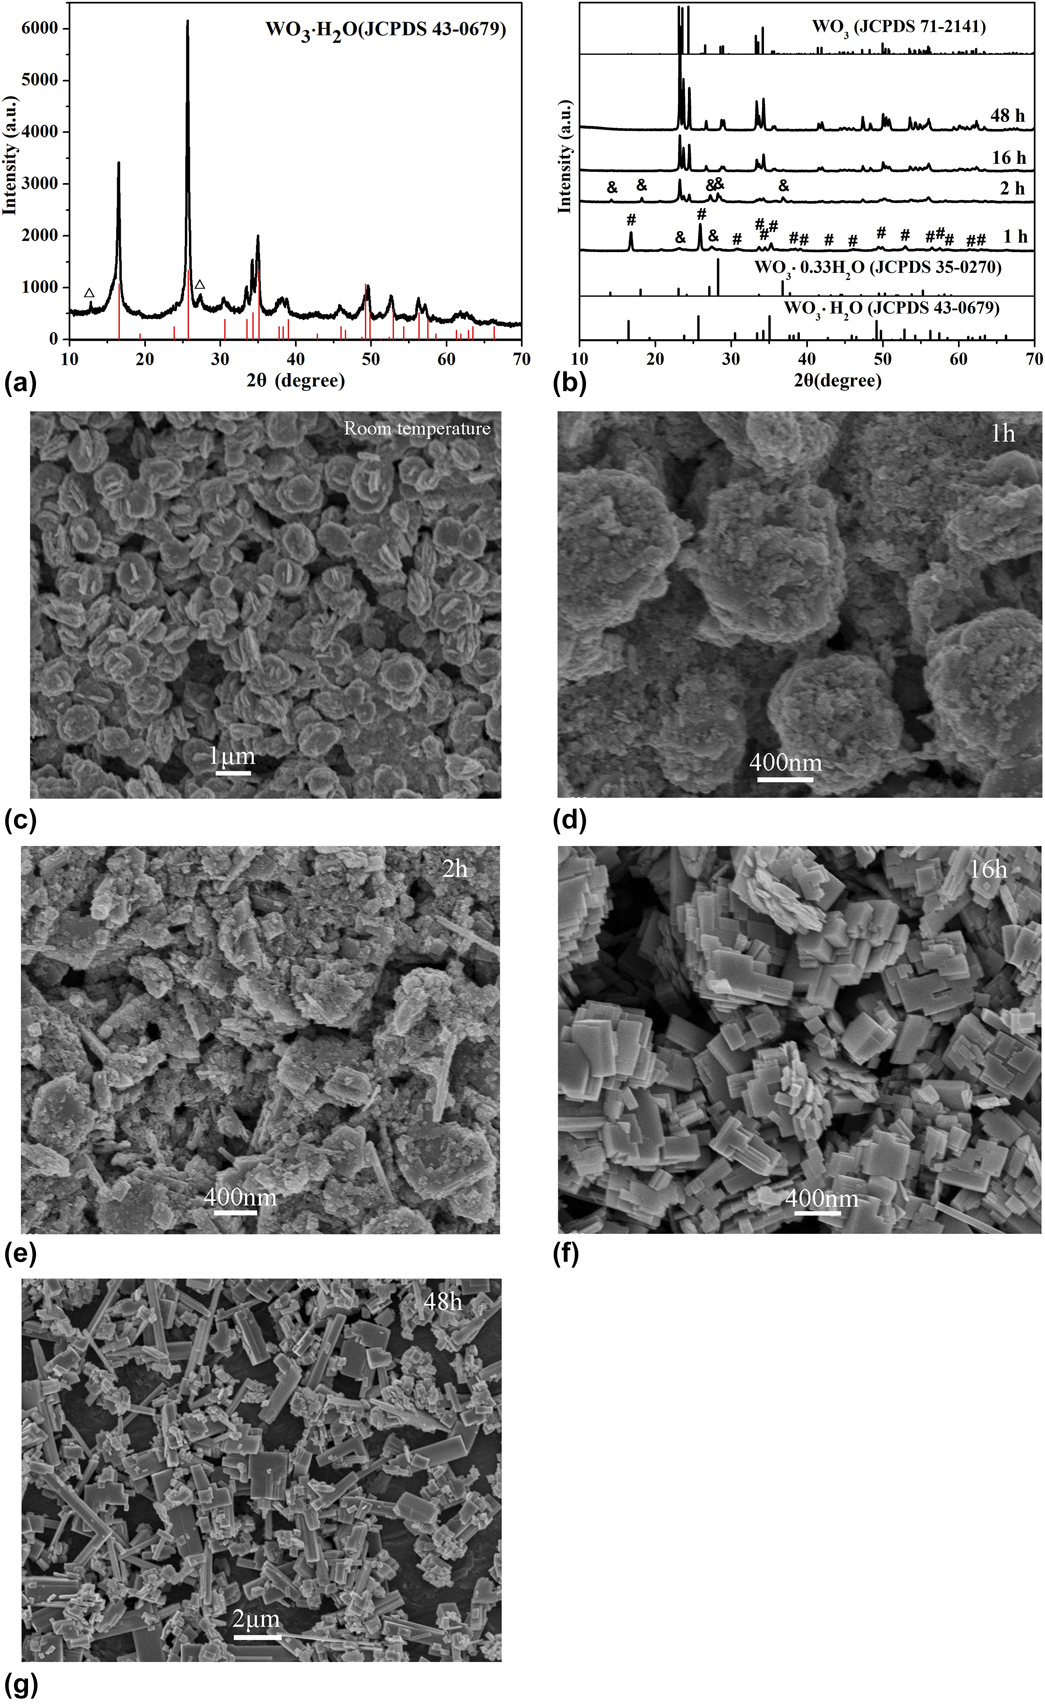
To reveal the growth mechanism of WO3 nanocubes, a set of experiments with different reaction time were carried out with other reaction conditions unchanged, as shown in Fig. 4. Figure 4(a) is the XRD pattern of products obtained by only stirring for 40 min at room temperature, and Fig. 4(b) shows the XRD patterns of products obtained at 200 °C with different hydrothermal reaction time. It can be seen from Fig. 4(a) that most of the diffraction peaks are attributed to orthorhombic WO3·H2O (JCPDS 43-0679), and two small peaks at about 13° and 27° correspond to monoclinic H2WO4·H2O [JCPDS 18-1420, marked by “△” in Fig. 4(a)]. Figure 4(c) is the corresponding FESEM images of WO3·H2O samples obtained at room temperature, indicating that the morphology is similar to that of WO3·H2O products obtained at 80 °C for 24 h [Fig. 3(b)], that is, many thin nanosheets stack with each other to form round-shaped aggregates. When the hydrothermal reaction time is 1 h at 200 °C, the main products are WO3·H2O [marked by “#” in Fig. 4(b)], and little WO3·0.33H2O products are also detected [marked by “&” in Fig. 4(b)]. But the original round-shaped aggregates are slowly destroyed, and a great deal of nanoparticles is gradually generated [Fig. 4(d)]. When the hydrothermal reaction time is 2 h, the products are composed of WO3·0.33H2O and WO3 according to its XRD pattern in Fig. 4(b). From Fig. 4(e), we can see that the starting round-shaped aggregates are completely destructed and some cube-like nanoparticles are formed. WO3 nanocubes are largely produced when the reaction proceed to 16 h [Fig. 4(f)], but their sizes are not uniform. While the time prolongs to 24 h, uniform and regular WO3 nanocubes can be successfully produced (Fig. 2). Moreover, when the hydrothermal reaction is extended to 48 h, one-dimensional (1D) massive WO3 microprisms with length up to 4–5 μm are found due to the Ostwald ripening growth.
(a) XRD pattern of products obtained at room temperature (△: monoclinic H2WO4·H2O). (b) XRD patterns of samples prepared with different hydrothermal reaction time at 200 °C (&: orthorhombic WO3·0.33H2O, #: orthorhombic WO3·H2O). (c) FESEM image of products obtained at room temperature. (d–g) FESEM images of samples prepared with different hydrothermal reaction time at 200 °C: (d) 1 h, (e) 2 h, (f) 16 h, and (g) 48 h.
Based on the above comparative experimental results, a conclusion can be drawn that WO3 nanocubes are generated by the phase transition process suffering from orthorhombic WO3·H2O, through orthorhombic WO3·0.33H2O to monoclinic WO3. Hence, the formation process and morphology evolution of WO3 nanocubes in the system are proposed as follows:
 $${\rm{N}}{{\rm{a}}_2}{\rm{W}}{{\rm{O}}_4} + 2{\rm{HCl}} + n{{\rm{H}}_{\rm{2}}}{\rm{O}} \to {{\rm{H}}_2}{\rm{W}}{{\rm{O}}_4} \cdot n{{\rm{H}}_2}{\rm{O}} + 2{\rm{NaCl}}\quad ,$$
 $${{\rm{H}}_{\rm{2}}}{\rm{W}}{{\rm{O}}_4} \cdot n{{\rm{H}}_{\rm{2}}}{\rm{O}} \to {{\rm{H}}_{\rm{2}}}{\rm{W}}{{\rm{O}}_4} + n{{\rm{H}}_{\rm{2}}}{\rm{O}}\quad ,$$
 $${{\rm{H}}_2}{\rm{W}}{{\rm{O}}_4}{ \leftrightarrow ^ \bullet }{\rm{W}}{{\rm{O}}_3} \cdot {{\rm{H}}_{\rm{2}}}{\rm{O}}\quad ,$$
 $${\rm{W}}{{\rm{O}}_3} \cdot {{\rm{H}}_{\rm{2}}}{\rm{O}} \to {\rm{W}}{{\rm{O}}_3} \cdot 0.33{{\rm{H}}_{\rm{2}}}{\rm{O}} + 0.67{{\rm{H}}_{\rm{2}}}{\rm{O}}\quad ,$$
 $${\rm{W}}{{\rm{O}}_3} \cdot 0.33{{\rm{H}}_{\rm{2}}}{\rm{O}} \to {\rm{W}}{{\rm{O}}_3}\;\left( {{\rm{crystal}}\;{\rm{nuclei}}} \right) + 0.33{{\rm{H}}_{\rm{2}}}{\rm{O}}\quad ,$$
 $${\rm{W}}{{\rm{O}}_3}\;\left( {{\rm{crystal}}\;{\rm{nuclei}}} \right) \to {\rm{W}}{{\rm{O}}_3}\;{\rm{nanocubes}}\quad .$$
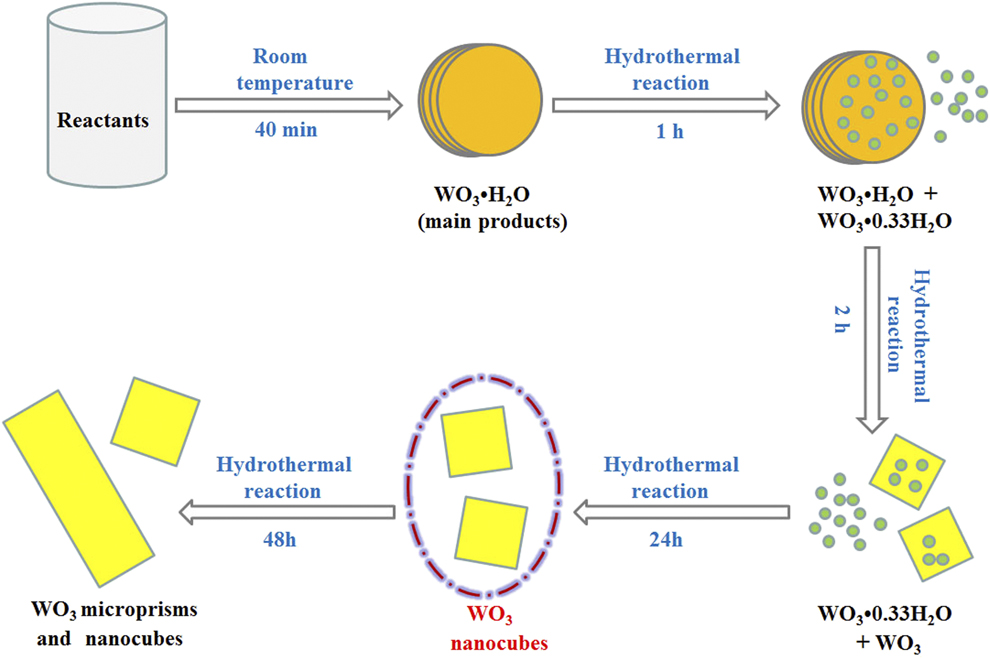
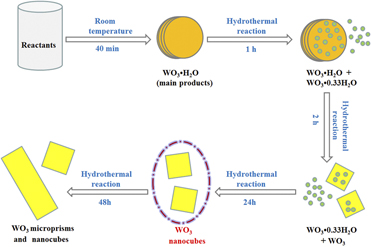
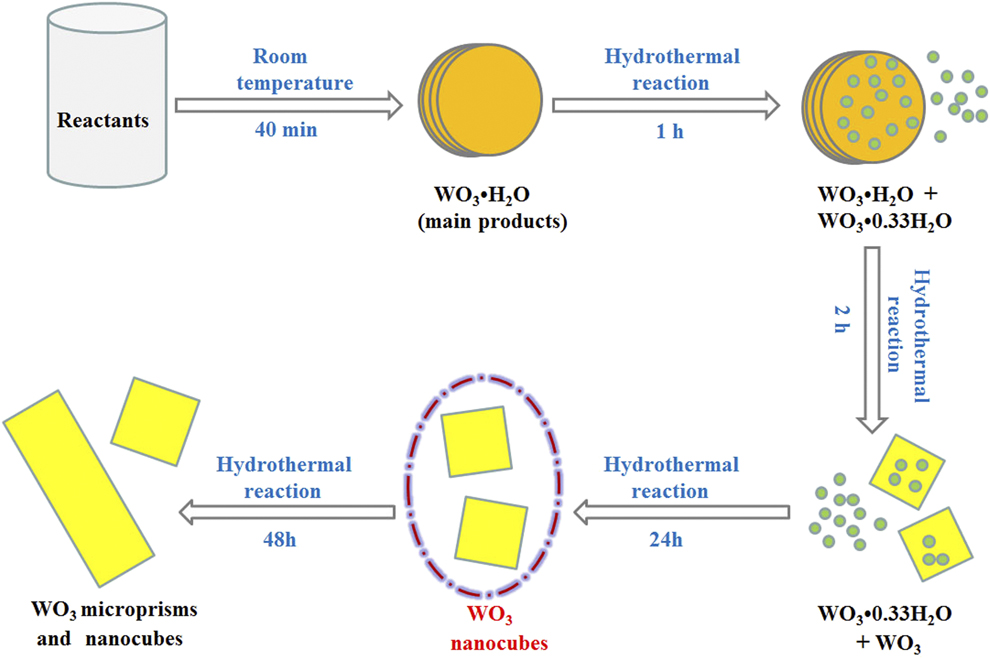
At first, H2WO4 is rapidly produced after HCl solution is added into Na2WO4 aqueous solution [Eqs. (1) and (2)] [Reference Peng, Ke, Xiao, Wang, Hu and Zan22], and the preformed H2WO4 turns into WO3·H2O under continuous stirring for 40 min at room temperature [Eq. (3)], whose morphology is nanosheet-based aggregates with round shape. When the hydrothermal reaction is carried out for 1 h, partial dehydration of WO3·H2O takes place and generate WO3·0.33H2O in the products [Eq. (4)]. After reacting for 2 h, orthorhombic WO3·H2O was transformed into WO3·0.33H2O totally, meanwhile a few of cube-like WO3 was produced by the complete dehydration [Eqs. (5) and (6)]. Uniform and regular WO3 nanocubes with pure phase can be yielded after hydrothermal reaction for 24 h. Once the hydrothermal reaction time reaches 48 h, larger nanocubes and microprisms of WO3 are obtained, which resulted from the dissolution–recrystallization of WO3 nanocubes due to the Ostwald ripening. The schematic illustration of growth process of WO3 nanocubes is demonstrated in Fig. 5.
Schematic illustration of growth process of WO3 nanocubes.
Optical property
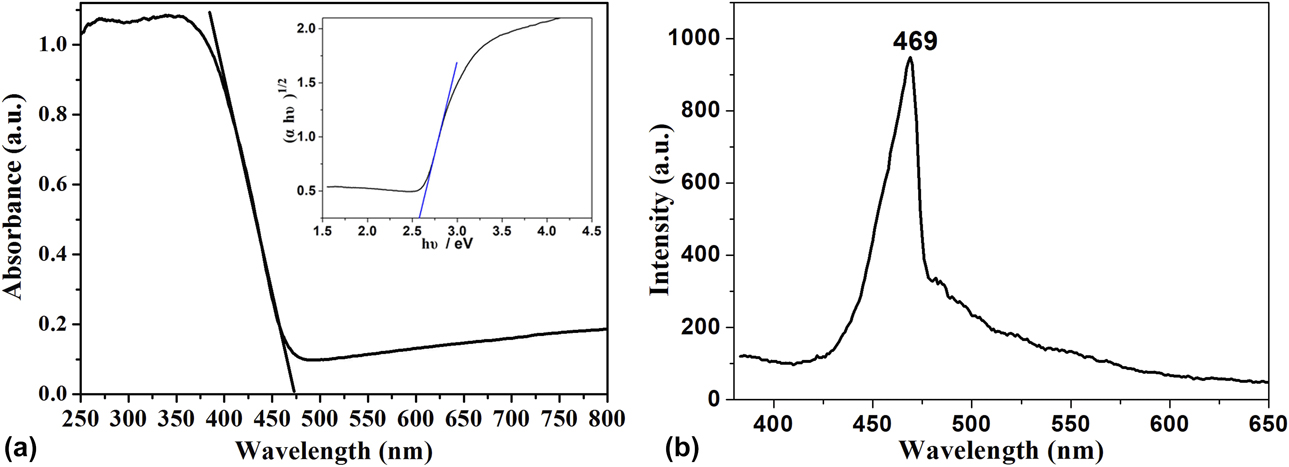
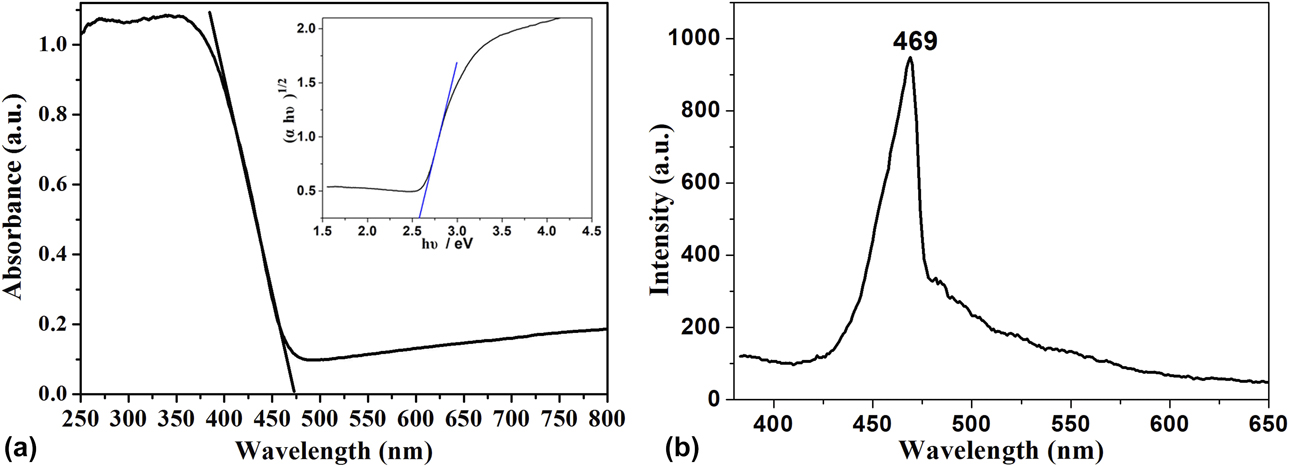
Figure 6(a) shows the solid UV-vis diffuse reflectance spectrum (DRS) of as-obtained WO3 nanocubes. The band edge absorption of WO3 is located at visible light region, which is about 473 nm. The band gap E g can be determined by the Tauc’s equation of (αhν)n = B(hν − E g) for a semiconductor [Reference Tauc and Scott23], where α is absorption coefficient, B is the edge width parameter, hν is the photon energy, and n is 1/2 for indirect transition of WO3. The plot of (αhν)1/2 versus hν is shown in the inset of Fig. 6(a). By extrapolating the straight line to (αhν)1/2 = 0, the band gap E g of WO3 nanocubes is calculated to be 2.58 eV, which is reasonable and similar to the reported literature values [Reference Miyauchi24, Reference Zhang, Zhang, Wang, Huang, Ye, Lei and Feng25]. Because the band gap energy is in visible region, the as-prepared WO3 sample would be acted as a promising visible light–driven photocatalyst for the application in degradation of organic pollutant. Figure 6(b) indicates the room temperature PL spectrum of WO3 nanocubes with an excitation wavelength of 350 nm. A strong blue emission band peaked at 469 nm is observed, similar to that reported in literature [Reference Bi and Xu26].
(a) UV-vis DRS [inset is plot of (αhν)1/2 versus photon energy (hν)] and (b) PL spectrum of WO3 nanocubes.
Photocatalytic performance
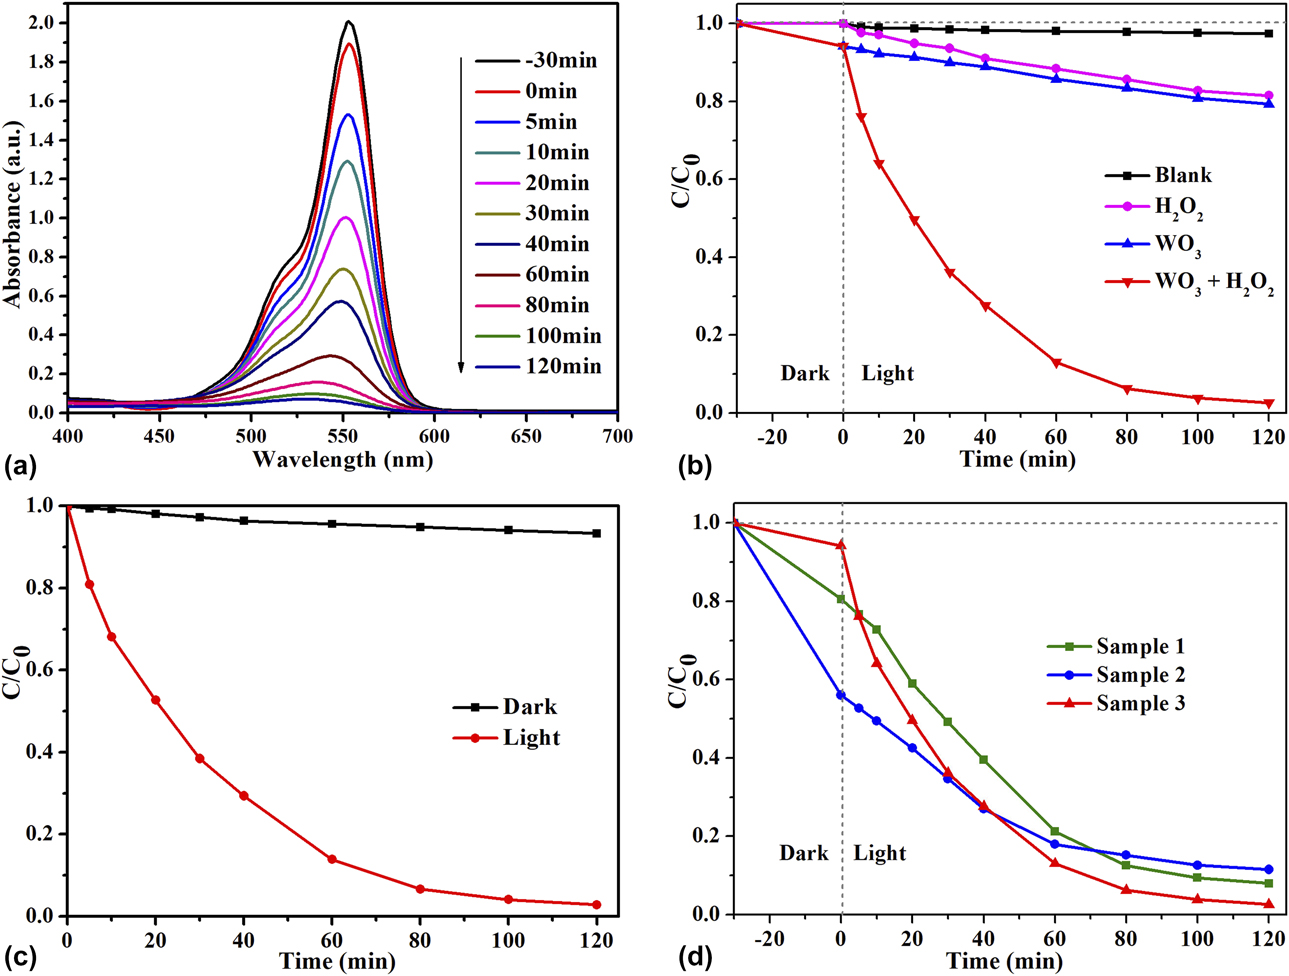
The photocatalytic activity of WO3 nanocubes is evaluated by degrading RhB molecule in solution assisted by H2O2, and series of comparative tests were carried out, which are shown in Fig. 7. Figure 7(a) presents the evolution of time-dependent absorption spectra of RhB over WO3 nanocubes. One can see that the intensity of the characteristic absorption peak located at 554 nm diminished gradually as the exposure time increases and basically disappeared after 120 min, suggesting the decomposition of RhB molecules. Figure 7(b) shows comparison of photocatalytic activity for RhB under different conditions. The direct photolysis of RhB was almost negligible according to the blank experiment, revealing that the photosensitization process is ignored (black line). Only in the presence of H2O2, the degradation rate of aqueous RhB is 18.5% after 120 min irradiation because the direct photolysis of H2O2 can generate small amounts of hydroxyl radicals (H2O2 + hν → 2HO∙) [Reference Wong and Chu27], which can oxidize and decompose RhB molecules (pink line). Only in the presence of WO3 nanocubes, the degradation rate of aqueous RhB was 20.7% within 120 min, and this is because the photoexcited electrons in WO3 are inactive for O2 reduction to generate ∙OH [Reference Abe, Takami, Murakami and Ohtani28] (blue line). It is worth, highly, mentioned that the degradation rate of aqueous RhB over WO3 nanocubes could reach 97.4% in 120 min with the help of H2O2 (red line).
(a) Time-dependent absorption spectra changes during the photocatalytic degradation of the RhB solution (10 mg/L, 50 mL) over 50 mg WO3 nanocubes photocatalysts in the presence of H2O2. (b) Comparison of photocatalytic activity for RhB under different conditions. (c) Degradation degree of RhB on WO3 nanocubes with light and without light in the presence of H2O2. (d) Photodegradation process of RhB assisted by H2O2 over different catalysts obtained at different temperatures (Sample 1: 80 °C, Sample 2: 140 °C, and Sample 3: 200 °C).
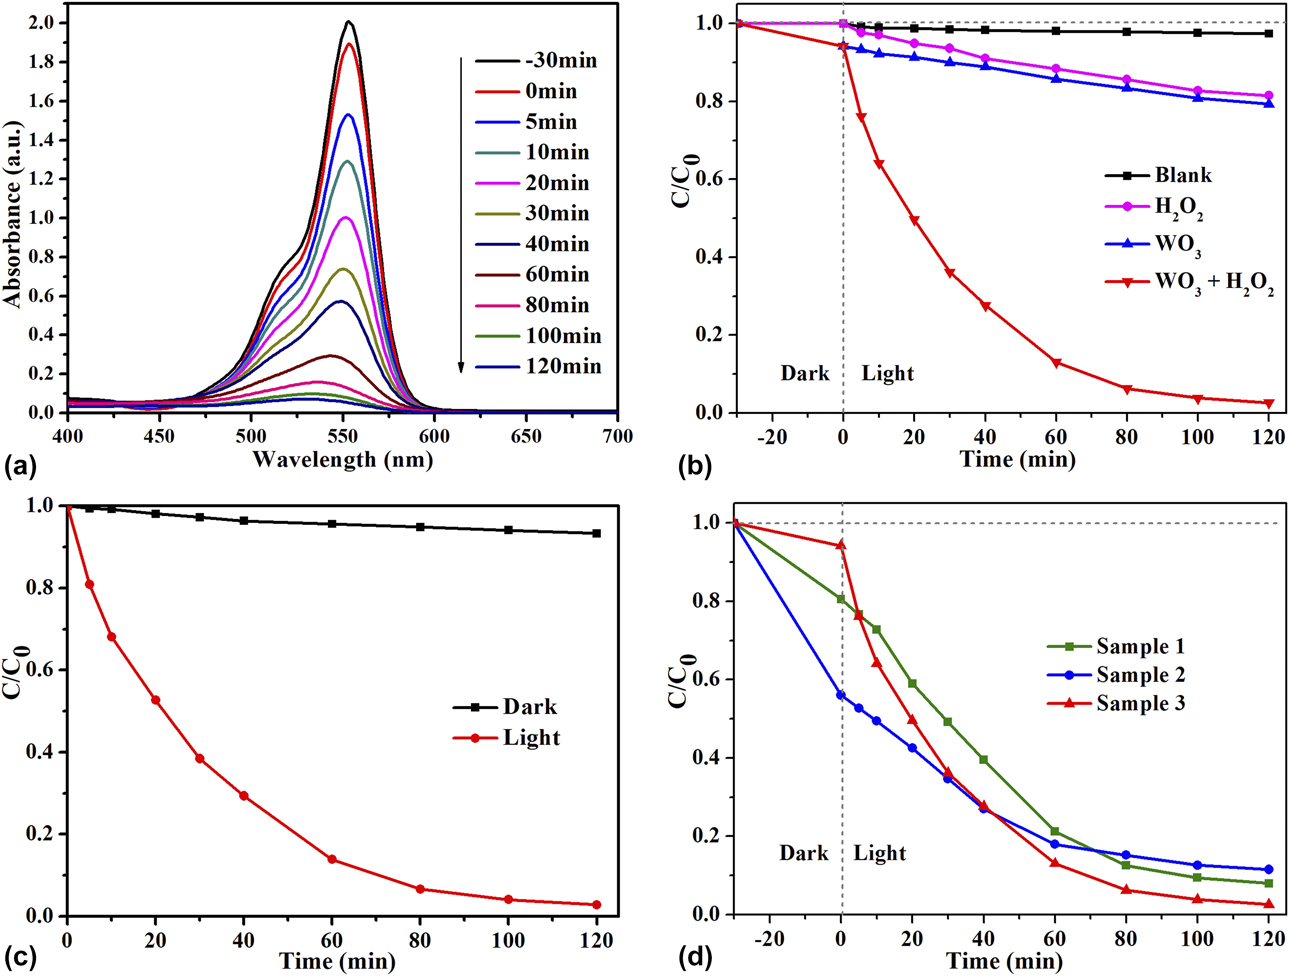
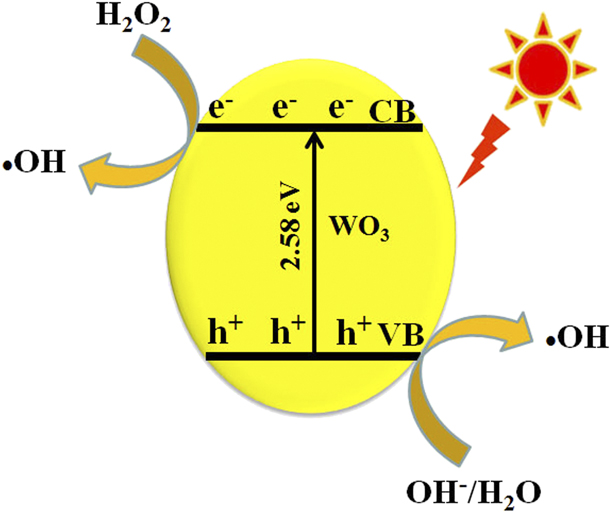
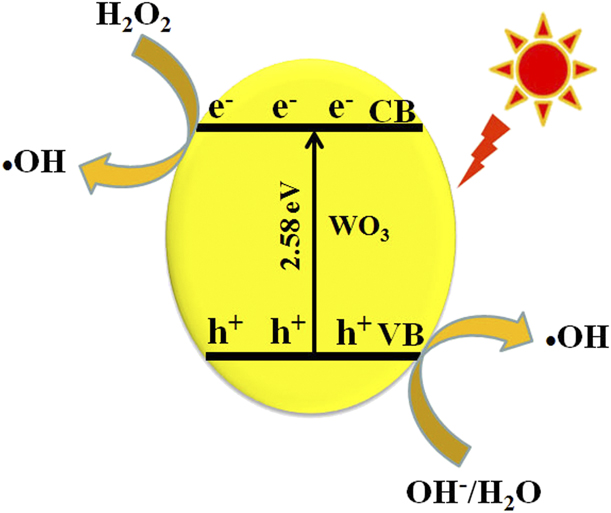
The comparison of the photocatalytic effect of aqueous RhB over WO3 nanocubes with or without light irradiation in the presence of H2O2 is shown in Fig. 7(c). It is seen clearly that the degradation rate of aqueous RhB was just 6.7% in the dark, indicating that the degradation of aqueous RhB over WO3 nanocubes with H2O2 in the visible light was photocatalytic reaction rather than Fenton-like catalytic reaction [Reference Deng, Ge, Hu, Yao, Han and Zhao29]. Figure 7(d) presents the photodegradation process of RhB with H2O2 over different catalysts obtained at different synthesis temperature. Sample 1 is WO3·H2O obtained at 80 °C for 24 h, Sample 2 is WO3·0.33H2O/WO3 composite obtained at 140 °C for 24 h, and Sample 3 is WO3 nanocubes. Although it can be deduced that Sample 1 and Sample 2 have good photocatalytic activities for the degradation of RhB, because the decolorizing rate reaches to 92.0% and 88.5% within 120 min, respectively, undoubtedly Sample 3 (WO3 nanocubes) exhibits the highest photocatalytic behavior for RhB degradation. As an excellent electron trapping agent, H2O2 can effectively combine with photogenerated electrons in WO3 and produce ∙OH [Reference Sayama, Hayashi, Arai, Yanagida, Gunji and Sugihara7], reducing the recombination opportunity of photoinduced electrons–hole pairs and make more living photogenerated carriers participate in the process of oxidation and degradation of RhB in aqueous solution. At the same time, photogenerated holes combine with OH−/H2O on the surfaces of WO3 crystals to generate ∙OH. Due to their stronger oxidation capacity, the newly generated ∙OH radicals can effectively oxidize RhB molecules into carbon dioxide and water. The photocatalytic mechanism of WO3 nanocubes in the presence of H2O2 is illustrated in Fig. 8.
Photocatalytic mechanism of WO3 nanocubes assisted by H2O2.
Conclusion
In summary, large-scale WO3 2D nanocubes have been obtained through a hydrothermal route in the absence of any surfactants in acidic conditions. It was found that reaction temperature and time play an important role in the formation of uniform WO3 nanocubes. Based on the experimental results, the plausible processes for the growth of WO3 nanocubes have been proposed. The photocatalytic degradation performance was studied under the visible light. The as-prepared WO3 nanocubes exhibited higher photocatalytic activity for degrading RhB dye, having potential application in wastewater remediation.
Experimental
Synthesis
All the reagents were analytically pure and used without further purification, and distilled water was used throughout the experiment. In a typical experimental procedure, 3 mmol of sodium tungstate (Na2WO4·2H2O) was dissolved in 20 mL of distilled water in a 40-mL Teflon-lined stainless steel autoclave and then 10 mL of diluted HCl (8 mol/L) was added into the above solution to form a homogeneous solution under constant stirring for 40 min. The autoclave was sealed and maintained at 200 °C for 24 h. After cooling down to room temperature naturally, the precipitates were filtered and washed with distilled water and ethanol for several times and then dried at 60 °C for 10 h.
Characterization
The phase purity of the as-synthesized products was examined by XRD using a Bruker D8 Advance X-ray diffractometer (40 kV, 40 mA, Germany) equipped with graphite monochromatized Cu Kα radiation (λ = 0.15406 nm). The morphology of the products was determined with an FESEM (JEOL JSM-6700F, Japan). UV-vis DRS were recorded on a UV-vis spectrophotometer (Solidspec-3700 DUV, Japan) at room temperature. The photoluminescence (PL) spectrum was detected on a Hitachi F-4600 fluorescence spectrophotometer (Japan).
Photocatalytic activity test
Using RhB as a model of organic pollutant, photocatalytic activities of WO3 samples were evaluated under visible light irradiation of a 500 W tungsten lamp. A self-made, low-temperature cooling liquid circulating equipment was used to maintain the system at room temperature during the whole photocatalytic reaction process. Fifty milligrams of WO3 nanocubes was added into 50 mL of RhB solution (10 mg/L) under magnetic stirring at the room temperature. Prior to irradiation, the suspension was stirred in the dark for 30 min to ensure the establishment of an adsorption–desorption equilibrium between the photocatalyst and dye. Afterward, 0.1 mL H2O2 (30%, w/w) was dropped into the above suspension and then the mixture suspension was exposed to visible light irradiation under continuous stirring. During irradiation, about 4 mL of the suspension was sampled and then the slurry sample containing the photocatalyst and dye solution was centrifuged (10,000 rpm, 4 min) to remove WO3 nanoparticles. The concentration of RhB was analyzed by a UV-vis spectrophotometer (UV-5500 PC), and the characteristic absorption of RhB at 554 nm was used to monitor the photocatalytic degradation.
Acknowledgments
This work was supported by the Natural Science Foundation of Anhui Province Educational Committee (KJ2018A0511 and KJ2018A0548), the Natural Science Foundation of Anhui Province (1808085MB40 and 1808085QE124), and the Key Projects of Support Program for Outstanding Young Talents in Colleges and Universities of Anhui Province (gxyqZD2016151).