


Introduction
Process monitoring in front of tidewater termini of temperate valley glaciers has been ongoing in Glacier Bay (Fig. 1), Alaska, U.S.A., since Reference PowellPowell (1980, Reference Powell1981) began defining modern sedimentary facies and process relationships. The well-known glacial history of Glacier Bay (Reference FieldField, 1947; Reference PowellPowell, 1984; Reference Goldthwait, Anderson, Goldthwait and McKenzieGoldthwait, 1987; Reference Hunter, Powell and EngstromHunter and Powell, 1995b) provides a framework for glacier behavior that, using the results of modern process studies (e.g. Reference Mackiewicz, Powell, Carlson and MolniaMackiewicz and others, 1984; Reference Powell, Anderson and AshleyPowell, 1991; Reference CowanCowan, 1992), enables us to evaluate relationships between sediment dynamics and the behavior of glacier termini (Reference Powell, Anderson and AshleyPowell, 1991; Reference Hunter, Powell and EngstromHunter and Powell, 1995a).
Map of Glacier Bay National Park and Preserve showing the locations of (1) upper Muir Inlet and Muir Glacier, and (2) upper Tarr Inlet with Grand Pacific and Margerie Glaciers.

The dynamics of marine-ending glaciers result from a balance among glacial, marine and sedimentary processes at the grounding line. Reference Brown, Meier and PostBrown and others (1982) noted a relationship between grounding-line water depth and calving speed of Alaskan glaciers with tidewater termini. Reference AlleyAlley (1991b) and Reference Powell, Anderson and AshleyPowell (1991) suggest that sediment dynamics may regulate grounding-line water depth. Several processes (Table 1; Fig. 2) interact to regulate the growth and collapse of sediment piles, or morainal banks, which accumulate at the grounding line. In this paper, sediment-budget data from three morainal banks in Glacier Bay are presented to provide insight into the magnitudes of processes affecting sediment dynamics in front of temperate tidewater termini in southeast Alaska.
Primary sedimentary processes at a tidewater terminus.

Grounding-line processes

Sampling Methodology for Sediment-budget Analyses
Our investigation focused on defining the relative importance of grounding-line processes at Grand Pacific, Margerie and Muir Glaciers (Fig. 1). A brief summary of the data collection strategy is given below.
Debris Distribution
Tidewater termini are ideal for the study of debris distribution within a glacier, since the ice cliff represents a near-vertical, often transverse cross-section. Iceberg caking introduces ice from all positions of the ice cliff to the fjord. By recording the location from which each iceberg originated in the ice cliff, all representative ice facies can be sampled selectively, in accordance with an ice-facies classification scheme based on that of (Reference LawsonLawson 1979; Fig. 3). It was possible to determine the debris distribution from debris concentrations calculated for 282 iceberg and 139 glacier ice samples (Reference Hunter, Powell and LawsonHunter and others, 1996).
General ice-facies distribution at a tidewater terminus.

Basal ice layers at Grand Pacific, Margerie and Muir Glaciers are discharged into fjords below sea level, such that these layers are most often observed in icebergs. Fortunately, basally derived icebergs tend to rise vertically and their location of origin can he inferred. Sampling of these icebergs provides a valuable constraint on basal layer thickness and debris concentration.
Supraglacial debris thickness was estimated along transeeis near termini. Moraine thickness on Margerie and Grand Pacific Glaciers ranged from <1 mm to 1.5 m, but rarely exceeded the 0.08 m average estimate of Reference GottlerGottler (1992). Debris covers of 1 mm are sufficiently thick to discolor the surface, whereas a thickness of 1–2 cm produces a cover that appears to be nearly complete on aerial photographs. Thicker moraine covers (0.5–1 m) fill surface crevasses and form debris ridges and more-or-less continuous gravel surfaces.
Bathymetric Monitoring of Glacifluvial Sediment Flux
Moored lines with sediment traps were deployed in both Muir and Tarr Inlets to monitor the spatial patterns of suspension settling in these inlets (Reference CaiCai, 1994; Reference HunterHunter, 1994). Traps suspended 1–6 m above the sea floor are used to represent suspended fluvial sediment flux to the sea floor. Volumes of deposited sediment were determined by plotting and contouring settling-rate data divided into plume settling (the total that accumulated on morainal-bank and fluvial depocenters) and plume by-pass (sediment that became deposited downfjord from the grounding-line system; Fig. 2).
Fjord bathymetry between 1988 and 1991 was recorded nine times within 1 km of Muir Glacier and seven times within 2 km of Grand Pacific Glacier. Bathymetric monitoring enables monitoring of bedload dumping, squeeze/push and mass movements that cannot be measured directly in the ice-proximal environment. Sediment volume contributed by these processes is determined indirectly by subtracting contributions from plume settling, calve dumping and ice-cliff melt-out from observed spatial and temporal changes in sea-floor sediment volume. Glacifluvial dumping at point-source depocenters is illustrated on isopach maps by mounds or piles (Fig. 4; Reference PowellPowell, 1991), whereas morainal-bank growth away from fluvial sources is attributed to squeeze/push movements and the advection of sediment in a deforming bed. Similarly, mass-movement processes are recorded by depressions on isopach maps. Therefore, isopach maps based on repeated bathymetric surveys were used to monitor volumetric changes in the morainal bank caused by identified sedimentary processes (Figs 2 and 4).
Example of how sedimentary processes are monitored using bathymetric profiles and isopach maps. (a) The outer limit of the morainal bank of Margerie and Grand Pacific Glaciers in Tarr Inlet on 29 June 1990 is delineated by the extent of the active deposition slope (>10°). Submarine contours are shown with an interval of 20 m. (b) Monitored changes in morainal-bank geometry for the period 29 July 1989 to 29 June 1990 are obtained using an isopach map. Aggradation is classified as either deltaic in origin, where located in front of glacial outwash streams, or from squeezejpush processes away from such sources. Large zones, of collapse by mass-movement processes are shown in front of Margerie and Grand Pacific Glaciers. The limit of the morainal bunk on 29 July 1989 is shown by a dashed line and that of 29 June 1990 by a solid line.

Data Assessment
Our data represent a first attempt to assess quantitatively the relative importance of various sedimentary processes in both delivering sediment to and removing it from active, dynamically changing morainal banks. The errors included in these estimates vary depending on the processes monitored, but are estimated to be within a factor of two. This is an acceptable level of accuracy since our goal was to produce an order-of-magnitude model.
Suspension-settling rates have a natural variability of less than 8% using traps with greater than 95% efficiency (Reference CowanCowan, 1988), and we accordingly estimate an error of within 10%. Measurements of debris concentrations in ice demonstrated that the debris content within an ice facies can vary by a factor of as much as 1.3 (Reference Hunter, Powell and LawsonHunter and others, 1996), which greatly exceeds the sampling and analytical errors of 5–10%. Because of natural hazards in this environment, the processes of bedload dumping, squeeze/push and mass movements cannot be monitored directly. Individual measurements made from bathymetric profiles are estimated to be within the 90% confidence limit. However, subjective contouring and plotting of isopach maps increases the likelihood of error. We estimate that errors may be as high as 20–30%, well within range for factor of two accuracy.
Results
The sampling described above has produced a data set dun allows us to evaluate the morainal-bank sediment budget. Reference Powell, Anderson and AshleyPowell (1991) and Hunter and Powell (1995b) have reported dramatic bathymetric changes of several tens of meters and up to 100 m in a single field season. Such changes indicate that sediment yields in Glacier Bay are the highest documented for both glacierized and non-glacierized basins (Reference Hallet, Hunter and BogenHallet and others, 1996).
Volumetric changes in the morainal bank (ΔB) are the sum of sediment volumes resulting from recycling (R t), inputs (N), and resedimentation processes (M) active at a site for a given time period, as expressed by:

where R t consists of sediment volumes contributed by freeze-recycling (R f) and squeeze/push (R s), and N is the volumetric sum of calve dumping (D d), ice-cliff melt-out (D m), bedload dumping (F d), plume settling (F p) and advection of a deforming bed (B d) towards the grounding line (Tables 1 and 2).
Sediment budgets for 1989–91 in 105 m3 year−1

The debris contribution from glacier ice to the morainal bank can be determined assuming plug flow near the glacier terminus, once the debris distribution is estimated and the ice flux (Q i) has been calculated using:
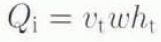
where v t, is the average velocity near the terminus, w is the glacier width, and h t is tin terminus thickness (Table 3). The debris flux (D g) in basal and englacial transport is the product of the ice flux (Q i) and the sum of the debris concentrations (C j ) of each ice facies weighted by their fractional volume (V j ) of the ice in the ice cliff, such that:

Debris fluxes calculated using Equation (3) range from 1.0 × 10⁶ to 1.3 × 10⁶ m3 year−1 (Table 2).
Glacier parameters during study, 1988–91

The volume of debris released at the grounding line by melt-out is calculated by determining the melting rate (R) using the Reference Weeks and CampbellWeeks and Campbell (1973) equation:

and recalculating Equations (2) and (3) after substituting R for v t . In Equation (4), v is the boundary-layer water velocity, ΔΤ is the temperature difference between the ice and water and l is the length of the ice cliff in contact with water along the predominant direction of water flow (Reference SyvitskiSyvitski. 1989), either buoyant upwelling at Grand Pacific and Muir Glaciers or longitudinal currents at Margerie Glacier. Buoyant upwelling is estimated at 0.03 m s−l (Reference Mathews and QuinlanMathews and Quinlan, 1975; Reference Powell and MolniaPowell and Molnia, 1989), and longitudinal currents appear to be around 0.25 m s−1 based on iceberg-drifting rates (Reference HunterHunter, 1994). The ice/water temperature difference was measured at 2.95°C with thermistors on a remotely controlled submersible (R. D. Powell, unpublished data). Based on these constraints, calculated ice-cliff melting rates are 21 m year−1 (Grand Pacific Glacier), 31 m year−1 (Margerie Glacier) and 20 m year−1 (Muir Glacier). Estimates of debris released by melting range from 3.0 × 10⁴ to 5.8 × 10⁴ m3 year−1 (Table 2).
The flux of ice discharged by calving is determined using a continuity equation:

where v c is the calving speed (Reference Brown, Meier and PostBrown and others, 1982) and X is the change in glacier length (positive for advance: Reference MeierMeier and others, 1980). By repeating the Calculations in Equations (2) and (3), this time substituting v c for v t (Table 3), estimates of iceberg rafting are 7.2 × 10⁵ to 9.6 × 10⁵ m3 year−1 (Table 2).
The supraglacial debris flux is the product of glacier surface velocity (v t), moraine widths (w m) and surficial debris thickness (t). Despite the conspicuous appearance of supraglacial moraines, the supraglacial fluxes of each glacier were relatively low: 1.4 × 10⁴ to 4.1 × 10⁴ m3 year−1 (Table 2). It is assumed that all of this debris is released by gravitational processes at tidewater ice cliffs by calve dumping (Fig. 2).
Fluvial bedload dumping is calculated using isopach maps produced from short-term intervals (10 d to about 1 month) that record point-source deposition (Reference Hunter, Powell and EngstromHunter and Powell, 1995b). Use of short-term data reduces the possibility that significant amounts of sediment have been removed by mass-movement processes, so that a better understanding of the magnitude of change is achieved.
Reference HunterHunter (1994) normalized these data by calculating average daily accumulation rates that were then extrapolated for the 4 month melt season (cf. Reference LawsonLawson, 1993). Bedload dumping was then calculated by subtracting the plume-settling component from morainal-bank depocenters indicated on isopach maps (e.g. Fig. 4). Suspension-settling data in Table 2 indicate that plume settling onto morainal banks accounts for 1.1 × 10⁶ to 9.8 × 10⁶ m3 year−1, and bedload dumping ranges from 4.9 × 10⁶ to 1.4 × 10⁷ m3 year−1. An additional 6.8 × 10⁵ to 5.5 × 10⁶ m3 year−1 of sediment is transported beyond the morainal bank and deposited dowufjord by plume by-pass.
Mass-movement processes occur episodically and can remove as much as 0.8 × 10⁶ to 5.4 × 10⁶ m3 of sediment within a 10–21 d monitoring interval and 2.5 × 10⁷ m3 in less than a month. The largest movements appear to occur in June and decrease by almost an order of magnitude by late July and August between 1989 and 1991, indicating instability early in the melt season. It is likely that considerable movement of sediment occurred prior to our sampling in June and may continue beyond the end of sampling in August. Given these limitations, a conservative estimate of sediment removed by mass-movement processes may be twice that monitored in the field, or about 2.5 × 10⁶ to 6.3 × 10⁷ m3 year−1 (Table 2).
Sediment transported in a deformable bed has been roughly estimated assuming a 60 cm thick deforming layer (e.g. Reference Humphrey, Kamb, Fahnesteck. and EngelhardtHumphrey and others, 1993) and a linear velocity profile (Reference AlleyAlley, 1991a). Subglacial sediments frozen onto basally derived icebergs have been observed in front of Grand Pacific, Johns Hopkins, Margerie, McBride and Muir Glaciers in Glacier Bay, indicating that deformable sediment is present at the soles of these glaciers. In addition, interstadial trees in Muir Inlet exhibit down-valley deformation in their upper 60–80 cm, indicative of subglacial shearing during overriding. Assuming plug- flow conditions and average velocity of the deforming layer of about half of the surface velocity (e.g. Reference AlleyAlley, 1991a), or about 262, 405 and 850 m year−1 for Grand Pacific, Margerie and Muir Glaciers, respectively, we estimate that 1.3 × 10⁵ to 2.3 × 10⁵ m3 year−1 of sediment could be transported to the grounding lines by deforming layers (Table 1). However, if soft-bed deformation is more localized, the subglacial sediment flux will be considerably less.
The processes of freeze-recycling and squeeze/push are the final components of the morainal-bank system that need to be addressed. Hunter and others (1996) estimate that the total amount of sediment moved by freeze-recycling in Glacier Bay ranges from 1.0 × 10⁴ to 7.2 × 10⁵ m3 year−1 (Table 2), from measurements of frozen sediment (the lowermost solid subfacies of Reference LawsonLawson (1979)) carried to the fjord surface on basally derived icebergs. Squeeze/push cannot be monitored directly, and is therefore estimated by solving Equation (1), such that R s is the only unknown. This yields estimates that range from 2.6 × 10⁵ to 2.8 × 10⁷ m3 year−1 for squeeze/push. Monitoring of the Margerie Glacier morainal bank demonstrates that, although squeeze/push may be the most significant process contributing to morainal-bank dynamics during the winter, it is overshadowed by mass-movement removal of sediment in the summer.
Discussion
A process hierarchy can be established for the morainal-bank environment based on these order-of-magnitude sediment-budget analyses. First-order processes are glacifluvial damping and mass movements, which account for the movement of 106 to 107 m3 year−1 of sediment and are the primary controls on morainal-bank growth and collapse. Glacifluvial dumping accounts for 50–80% of the glacial sediment production in a single summer, while mass-movement processes may remove more than 1.5 times the total annual sediment produced in years when morainal banks collapse (Table 2).
Second-order processes include glacifluvial plume settling, plume by-pass and advection by a deforming bed, which account for 105 to 106 m3 year−1, 7–29% of the total glacial sediment yields. Squeeze/push is also assigned to second-order processes based on the analyses of Grand Pacific and Muir Glaciers. Freeze-recycling, iceberg-rafting by-pass, calve dumping and ice-cliff melt-out are third-order processes, which account for the local redistribution of 104 to 105 m3 year−1 (<0.1% to 9%) of sediment. Reference Dowdeswell and DowdeswellDowdeswell and Dowdeswell (1989) have observed that sedimentation rates from iceberg rafting are only an order of magnitude lower than the total sedimentation rates in Spitsbergen. The two orders of magnitude difference observed in Glacier Bay indicates an increase in the importance of glacifluvial activity in the maritime climate of southeast Alaska relative to that in a sub-polar climate.
An analysis of the behavior of termini in Glacier Bay indicates that recent advance and retreat histories are closely related to sediment dynamics. Catastrophic retreat took place in both Muir Inlet and the main arm of Glacier Bay (Fig. 1) following the Neoglacial maximum (Reference PowellPowell, 1980; Reference Goldthwait, Anderson, Goldthwait and McKenzieGoldthwait. 1987). The last phase of retreat of Muir Glacier began in the 1890s but accelerated following the 1899 earthquake (Reference Tarr and MartinTarr and Martin, 1912; Reference FieldField, 1947), which may have caused a catastrophic collapse of its morainal bank and introduced its grounding line to deep water.
Quasi-stability and subsequent advance of Margerie and Grand Pacific Glaciers in the 20th century coincide with the formation of ice-contact deltas (Reference Hunter, Powell and EngstromHunter and Powell, 1995a). Both glaciers have been advancing for nearly 50 years behind morainal banks in a way similar to the advance of Grillon Glacier (Reference Goldthwait, McKellar and CronkGoldthwait and others, 1963; Reference PowellPowell, 1991) and Hubbard Glacier (Reference MayoMayo, 1988) elsewhere in Alaska. Apparent overriding on the morainal bank by Grand Pacific Glacier during the 1970s and early 1980s resulted in ice advancing into deeper water and an acceleration in glacier flow (Reference Hunter, Powell and EngstromHunter and Powell, 1995a). Subsequent aggradation of grounding-line sediment has coincided with slowed glacier flow (Reference HunterHunter, 1994).
Sediment dynamics are clearly not the only control on the behavior of tidewater termini in Glacier Bay and other parts of the world. Reference ReidReid (1892) noted that termini tended to become pinned at fjord constrictions related to a reduction in the cross-sectional area exposed to the sea, a notion that was supported by Reference FieldField (1947) and Reference PostPost (1975). However, Reference PowellPowell (1980) found no statistical relationship to support this idea. Recent quasi-stability of the terminus of Muir Glacier has coincided with retreat into a narrow stretch of Muir Inlet where ice flux can support the calving flux (Reference Hunter, Powell and EngstromHunter and Powell, 1995b). Rapid fjord infilling in 1986 following a period of quasi-stability resulted in grounding-line aggradation to sea level by 1992. Currently, Muir Glacier terminates as a terrestrial glacier and is expected to advance since it is no longer calving. It is clear, however, that the stability of tidewater termini in Glacier Bay can be influenced by sediment dynamics at the grounding line. Termini can therefore fluctuate independently of any climatic forcing.
Conclusions
Data presented in this paper should be useful in evaluating models of glacier sensitivity to sediment dynamics (e.g. Reference AlleyAlley, 1991b) and evaluating process variations under different climatic regimes. In Glacier Bay, glacifluvial sediment production is as much as two orders of magnitude greater than the debris flux and constitutes 84–98% of the total sediment yields. Fluvial bedload dumping accounts for 54–80% of the glacifluvial sediment production and is the single most important process adding sediment to morainal banks. Interactions between the first-order processes of glacifluvial dumping and mass movement primarily determine morainal-bank growth and collapse, and moderate grounding-line water depth. Through achieving a clearer understanding of how sediment dynamics influence the stability of glaciers with tidewater termini, we can better assess the asynchronous behavior of such glaciers in Alaska (e.g. Reference MannMann. 1986; Reference MayoMayo, 1988; Reference Powell, Anderson and AshleyPowell. 1991) and other regions. Glacial systems in southeast Alaska are ideal for monitoring sediment dynamics and evaluating process relationships since their glacifluvial sediment yields are the highest known on Earth, being linked to denudation rates on the order of 10–60 mm year−1 (Reference Hallet, Hunter and BogenHallet and others, 1996).
Acknowledgements
Funding was provided by DPP 88–22098 to R. D. P.; the Geological Society of America, Sigma Xi and the Department of Geology at Northern Illinois University to L. E. H.; and USACRREL for D. E. L. under the Work Unit “Predicting Runoff and Sediment Yield from Partly Glacierized Basins”. Logistical support was provided by the National Park Service at Glacier Bay National Park and Preserve and J, Luthy, captain of the M/V Nunatak. The authors wish to thank J. A. Dowdeswell, J. Strasser, L. Gatto and one anonymous reviewer for comments that improved the text. Assistance on the graphics was provided by L. Paulson.



