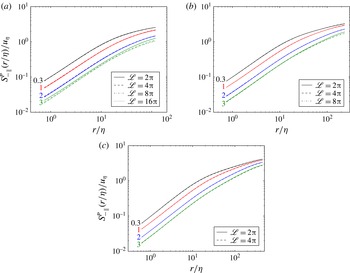
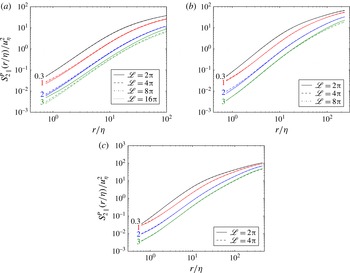
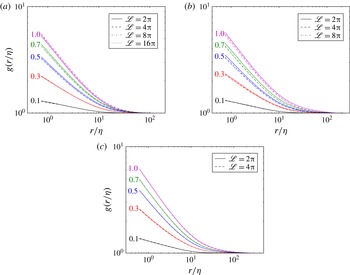
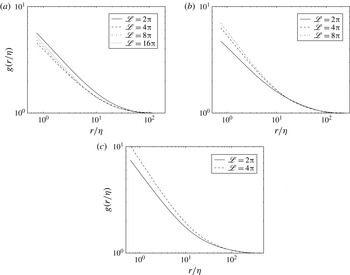
1 Introduction
This is the second part of a two-part paper in which we consider the Reynolds-number dependence of inertial particle statistics using direct numerical simulations (DNS) of homogeneous, isotropic turbulence (HIT). In Part 1 of this study (Ireland, Bragg & Collins Reference Ireland, Bragg and Collins2016), we used high-Reynolds-number DNS to explore the motion of inertial particles in the absence of gravity. We saw that particles with weak inertia preferentially sampled certain regions of the turbulence (a phenomenon known as ‘preferential sampling’, see Maxey Reference Maxey1987; Squires & Eaton Reference Squires and Eaton1991; Eaton & Fessler Reference Eaton and Fessler1994). By exploring the specific regions of the flow contributing to this preferential sampling and using the theory in Chun et al. (Reference Chun, Koch, Rani, Ahluwalia and Collins2005), we were able to understand and model the resulting trends. Particles with higher inertia had a modulated response to the underlying turbulence (a phenomenon known as ‘inertial filtering’), decreasing the particle kinetic energies and accelerations, and we found our DNS data for these quantities to be in excellent agreement with the models of Abrahamson (Reference Abrahamson1975) and Zaichik & Alipchenkov (Reference Zaichik and Alipchenkov2008). Such particles also exhibited increased relative velocities and ‘caustics’ (Wilkinson & Mehlig Reference Wilkinson and Mehlig2005; Wilkinson, Mehlig & Bezuglyy Reference Wilkinson, Mehlig and Bezuglyy2006), which occur as a result of the particles’ memory of their path-history interactions with the turbulence.
A primary goal of our analysis in Part 1 was to determine the effect of Reynolds number on particle collision rates. It is well known that droplet growth and precipitation in warm, cumulus clouds occur faster than current microphysical models can predict, and the discrepancies are generally linked to turbulence effects (see Shaw Reference Shaw2003; Devenish et al. Reference Devenish, Bartello, Brenguier, Collins, Grabowski, IJzermans, Malinowski, Reeks, Vassilicos and Wang2012; Grabowski & Wang Reference Grabowski and Wang2013). We explored droplet motions in turbulence at the highest Reynolds numbers to date, and used the results to extrapolate to Reynolds numbers representative of those in atmospheric clouds. A secondary motivation was to understand the extent to which protoplanetary nebula formation, which depends on the collision and coalescence of small dust grains, is affected by turbulence. (A more complete explanation of the physical processes involved in cloud and protoplanetary nebula formation is provided in Part 1.)
To determine the collision rates, we computed particle radial distributions and relative velocities and used the theory of Sundaram & Collins (Reference Sundaram and Collins1997) to calculate the kinematic collision kernel from these quantities. We observed that the collision rates of weakly inertial particles (such as those that would be present in the early stage of cloud formation) are almost entirely insensitive to the flow Reynolds number. This suggests that particle collisions are determined by the small-scale turbulence (and are insensitive to intermittency effects, which increase with increasing Reynolds number), and that DNS at low Reynolds numbers should capture the essential physics responsible for particle collisions in highly turbulent clouds.
One major simplification in Part 1 was the neglect of gravitational forces on the particles. However, as noted in Part 1, gravity is not negligible for many particle-laden environmental flows. For example, in warm cumulus clouds, the gravitational settling speeds of droplets may be an order of magnitude larger than the Kolmogorov velocity, suggesting that such droplets fall quickly through the turbulence and may therefore have a substantially modified response to the underlying flow (Ayala et al. Reference Ayala, Rosa, Wang and Grabowski2008). Therefore, in Part 2 of our study, we systematically explore the effect of gravity on inertial particle statistics.
The inclusion of gravity, while superficially trivial, adds richness and complexity to both the physical interpretation of the results as well as the numerics. Physically, the dimensionality of the parameter space is augmented by one to quantify the strength of gravity relative to the turbulence parameters. Here, we introduce a Froude number,
 $Fr$
, which is defined as the ratio of the root-mean-square of the fluid acceleration to the gravitational constant (e.g. see Bec, Homann & Ray Reference Bec, Homann and Ray2014). Even for terrestrial clouds (for which gravity may be regarded as a constant), the turbulent acceleration may vary by orders of magnitude (see Pruppacher & Klett Reference Pruppacher and Klett1997), leading to significant variations in
 $Fr$
. To quantify the role of gravity, therefore, we must analyse particle statistics over a wide range of
 $St$
,
 $R_{{\it\lambda}}$
and
 $Fr$
. In addition to the expanded parameter space, the gravitational vector causes a reduction in symmetry for the particle field, from isotropic to axisymmetric, with the axis aligned with the gravitational vector (Ayala et al.
Reference Ayala, Rosa, Wang and Grabowski2008; Woittiez, Jonker & Portela Reference Woittiez, Jonker and Portela2009; Bec et al.
Reference Bec, Homann and Ray2014; Gustavsson, Vajedi & Mehlig Reference Gustavsson, Vajedi and Mehlig2014). We will investigate the degree of anisotropy as a function of the system parameters. Finally, there is a numerical concern that relates to the settling speed of the particles. With periodic boundary conditions, particles exiting the bottom of the box are reintroduced at the top. If the time required to traverse the box becomes smaller than the correlation time of the turbulence, the reflected particles’ pre-existing correlation with the flow will introduce an unphysical effect (Woittiez et al.
Reference Woittiez, Jonker and Portela2009). This effect can be mitigated by increasing the domain size. We will explore different domain sizes to quantify this effect (see appendix A for a complete discussion).
Previous DNS of inertial particles subjected to gravity have primarily focused on how turbulence alters the terminal velocity (Wang & Maxey Reference Wang and Maxey1993; Yang & Lei Reference Yang and Lei1998; Yang & Shy Reference Yang and Shy2005; Ireland & Collins Reference Ireland and Collins2012; Bec et al. Reference Bec, Homann and Ray2014; Good et al. Reference Good, Ireland, Bewley, Bodenschatz, Collins and Warhaft2014) and the collision frequency (Franklin, Vaillancourt & Yau Reference Franklin, Vaillancourt and Yau2007; Ayala et al. Reference Ayala, Rosa, Wang and Grabowski2008; Onishi, Takahashi & Komori Reference Onishi, Takahashi and Komori2009; Woittiez et al. Reference Woittiez, Jonker and Portela2009; Rosa et al. Reference Rosa, Parishani, Ayala, Grabowski and Wang2013; Bec et al. Reference Bec, Homann and Ray2014). Our work extends those studies by performing simulations on larger domains, over a wider range of Reynolds numbers and using more particle classes. We also consider the effect of gravity on additional particle statistics (such as fluid velocity gradients, Lagrangian time scales and particle accelerations) to provide new insight into the physical mechanisms responsible for particle collisions, and we specifically address the influence of anisotropy on these and other statistics. To understand the trends in many of these statistics, we introduce theoretical models and compare them with the DNS data.
The organization of this paper is as follows. In § 2, we discuss the numerical methods and parameters for our simulations. Single-particle statistics are presented in § 3. Within this section, we analyse particle velocity gradients (§ 3.1), mean settling speeds (§ 3.2) and accelerations (§ 3.3). These statistics provide insight into the mechanisms contributing to the clustering and near-contact motion of heavy, inertial particles. To further understand these and other relevant collision mechanisms, we directly compute particle-pair statistics in § 4. We consider the particle relative velocities in § 4.1 and radial distribution functions in § 4.2, and use these data to compute the particle kinematic collision kernel in § 4.3. We conclude in § 5 by summarizing our findings and suggesting some practical implications for the cloud physics and turbulence communities.
2 Overview of simulations
2.1 Fluid phase
As in Part 1, we perform pseudospectral DNS of HIT on a cubic, triperiodic domain of length
 $\mathscr{L}$
with
 $N^{3}$
grid points, solving the continuity and Navier–Stokes equations for an incompressible flow
 $$\begin{eqnarray}\displaystyle & \displaystyle \boldsymbol{{\rm\nabla}}\boldsymbol{\cdot }\boldsymbol{u}=0, & \displaystyle\end{eqnarray}$$
 $$\begin{eqnarray}\displaystyle & \displaystyle \frac{\partial \boldsymbol{u}}{\partial t}+{\bf\omega}\times \boldsymbol{u}+\boldsymbol{{\rm\nabla}}\left(\frac{p}{{\it\rho}_{f}}+\frac{u^{2}}{2}\right)={\it\nu}{\rm\nabla}^{2}\boldsymbol{u}+\boldsymbol{f}, & \displaystyle\end{eqnarray}$$
where
 $\boldsymbol{u}$
is the fluid velocity,
 ${\bf\omega}$
is the vorticity,
 $p$
is the pressure,
 ${\it\rho}_{f}$
is the fluid density,
 ${\it\nu}$
is the kinematic viscosity and
 $\boldsymbol{f}$
is a large-scale forcing term that is added to make the flow field statistically stationary. In these simulations, deterministic forcing is applied to wavenumbers with magnitude
 ${\it\kappa}=\sqrt{2}$
. Note that the gravity term in the Navier–Stokes equation is not shown because it is precisely cancelled by the mean pressure gradient, and so it has no dynamical consequence on the turbulent flow field. More details of the numerical methods can be found in Ireland et al. (Reference Ireland, Vaithianathan, Sukheswalla, Ray and Collins2013).
In Part 1,
 $\mathscr{L}=2{\rm\pi}$
for all the simulations performed. To reduce artificial periodicity effects in these simulations with gravity, the domain lengths are here extended to
 $\mathscr{L}=16{\rm\pi}$
(for
 $R_{{\it\lambda}}=90$
),
 $\mathscr{L}=8{\rm\pi}$
(for
 $R_{{\it\lambda}}=147$
) and
 $\mathscr{L}=4{\rm\pi}$
(for
 $R_{{\it\lambda}}=230$
). (
 $R_{{\it\lambda}}\equiv 2k\sqrt{5/(3{\it\nu}{\it\epsilon})}$
denotes the Taylor-scale Reynolds number, where
 $k$
is the kinetic energy and
 ${\it\epsilon}$
is the turbulent energy dissipation rate.) The grid spacing is kept constant as the domain size is increased, and so the small-scale resolution
 ${\it\kappa}_{max}{\it\eta}$
is approximately constant between the different domain sizes (where
 ${\it\kappa}_{max}$
is the maximum resolved wavenumber and
 ${\it\eta}\equiv ({\it\nu}^{3}/{\it\epsilon})^{1/4}$
is the Kolmogorov length scale). In increasing the domain size, we also keep the viscosity and forcing parameters the same, and thus both small-scale and large-scale flow parameters are held approximately constant. At the two highest Reynolds numbers, we expect periodicity effects to be minimal, and the domain sizes are the same (
 $\mathscr{L}=2{\rm\pi}$
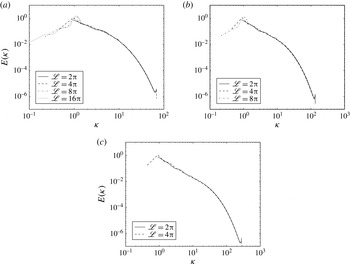
) both with and without gravity. Refer to appendix A for a detailed examination of the effect of the domain size on fluid and particle statistics.
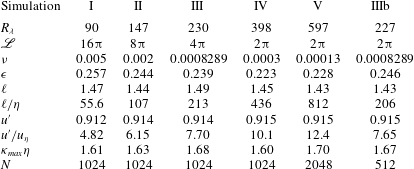
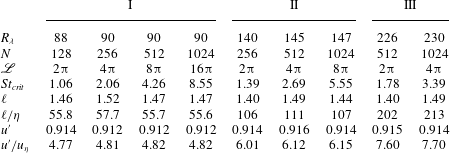
The simulation parameters are given in table 1. The simulation results from this study will be frequently compared to those from Part 1. These comparisons are justified, since in all cases, the parameters are very close to those used in Part 1, and based on the results in appendix A, we can safely assume that the differences in the particle statistics between these simulations and those in Part 1 are due entirely to gravitational effects and not to any differences in the underlying flow fields. In showing comparisons between the present data and those from Part 1, we will refer to both fields by the Reynolds numbers from table 1, keeping in mind that the corresponding Reynolds numbers from Part 1 may differ slightly (but by no more than 5 %).

To perform a more complete parametric study of the effects of inertia and gravity on particle statistics, we also conducted a simulation with similar flow parameters to simulation III, but with a smaller domain size (due to computational limitations). The parameters for this simulation (referred to as IIIb) are also given in table 1.
2.2 Particle phase
We simulate the motion of spherical particles with finite inertia and gravitational forces. To model the dynamics of inertial particles, we make the following simplifying assumptions. The particles are assumed to be small (
 $d/{\it\eta}\ll 1$
, where
 $d$
is the particle diameter) and dense (
 ${\it\rho}_{p}/{\it\rho}_{f}\gg 1$
, where
 ${\it\rho}_{p}$
is the particle density). As in Part 1, we assume the leading-order force acting on the particles is Stokes drag, which is justified when the particle Reynolds number
 $Re_{p}\equiv |\boldsymbol{u}^{p}(t)-\boldsymbol{v}^{p}(t)|/{\it\nu}<0.5$
, where
 $\boldsymbol{u}^{p}(t)\equiv \boldsymbol{u}(\boldsymbol{x}^{p}(t),t)$
denotes the undisturbed fluid velocity at the particle position
 $\boldsymbol{x}^{p}$
and
 $\boldsymbol{v}^{p}$
denotes the velocity of the particle (Elghobashi & Truesdell Reference Elghobashi and Truesdell1992). (As in Part 1, we use the superscript
 $p$
on
 $\boldsymbol{x}$
,
 $\boldsymbol{u}$
and
 $\boldsymbol{v}$
to denote time-dependent Lagrangian variables defined along particle trajectories. Phase-space positions and velocities will be denoted without the superscript
 $p$
.) In a recent study, Good et al. (Reference Good, Ireland, Bewley, Bodenschatz, Collins and Warhaft2014) found that the linear drag model (Stokes drag) predicted settling speeds in agreement with experiments for
 $St\lesssim 3$
; however, for
 $St>3$
the linear drag model yields results that are inconsistent with experiments. However, simply introducing a nonlinear drag coefficient does not quantitatively capture the nonlinear drag effects in a time-dependent flow like turbulence. A full wake-resolving nonlinear model would be required, but is beyond the scope of this study. Despite the need for caution in the interpretation of the higher-Stokes-number simulations, the majority of DNS and theory derived for particle-laden flows also assume a linear drag law, and hence we retain a linear drag model in this study to facilitate comparisons with the earlier work. A future study will consider a more general drag law in conjunction with experimental measurements to test the model. Finally, we neglect interparticle interactions and two-way coupling between the phases under the assumption that the particle loadings are in the dilute limit (Elghobashi & Truesdell Reference Elghobashi and Truesdell1993; Sundaram & Collins Reference Sundaram and Collins1999), as is typically the case in atmospheric clouds (Shaw Reference Shaw2003).
Under these assumptions, the governing equations for the inertial particles are (Maxey & Riley Reference Maxey and Riley1983)
 $$\begin{eqnarray}\frac{\text{d}^{2}\boldsymbol{x}^{p}}{\text{d}t^{2}}=\frac{\text{d}\boldsymbol{v}^{p}}{\text{d}t}=\frac{\boldsymbol{u}\left(\boldsymbol{x}^{p}(t),t\right)-\boldsymbol{v}^{p}(t)}{{\it\tau}_{p}}+\boldsymbol{\mathfrak{g}},\end{eqnarray}$$
where
 $\boldsymbol{\mathfrak{g}}=(0,0,-\mathfrak{g})$
is the gravitational acceleration vector and
 ${\it\tau}_{p}\equiv {\it\rho}_{p}d^{2}/(18{\it\rho}_{f}{\it\nu})$
is the response time of the particle. To compute
 $\boldsymbol{u}(\boldsymbol{x}^{p}(t),t)$
, we employ an eight-point B-spline interpolation from the Eulerian grid (van Hinsberg et al.
Reference van Hinsberg, Thije Boonkkamp, Toschi and Clercx2012). As in Part 1, we begin computing particle statistics once the particle distributions and velocities become statistically stationary and independent of their initial conditions. For a subset
 $N_{tracked}$
of the total number of particles in each class
 $N_{p}$
, we store particle positions, velocities and velocity gradients every
 $0.1{\it\tau}_{{\it\eta}}$
for a duration of approximately
 $100{\it\tau}_{{\it\eta}}$
. These data are used to compute Lagrangian correlations, accelerations and time scales.
The Stokes number
 $St\equiv {\it\tau}_{p}/{\it\tau}_{{\it\eta}}$
is a non-dimensional measure of the particle inertia, where
 ${\it\tau}_{{\it\eta}}\equiv ({\it\nu}/{\it\epsilon})^{1/2}$
is the Kolmogorov time scale. Gravity can be parameterized in a number of ways (e.g. see Good et al.
Reference Good, Ireland, Bewley, Bodenschatz, Collins and Warhaft2014). Here, we define the Froude number as
 $Fr\equiv {\it\epsilon}^{3/4}/({\it\nu}^{1/4}\mathfrak{g})$
, where
 ${\it\epsilon}^{3/4}/{\it\nu}^{1/4}$
is the Kolmogorov estimate for the acceleration root-mean-square. (Note that the Froude number is sometimes expressed as the inverse of our definition; we choose the present definition for consistency with the standard practice of defining the Froude number with
 $\mathfrak{g}$
in the denominator.) Alternatively, gravity can be parameterized by the settling parameter
 $Sv\equiv {\it\tau}_{p}\mathfrak{g}/u_{{\it\eta}}$
, which is the ratio of the particle’s settling velocity
 ${\it\tau}_{p}\mathfrak{g}$
to the Kolmogorov velocity of the turbulence
 $u_{{\it\eta}}\equiv ({\it\nu}{\it\epsilon})^{1/4}$
. Note that these two non-dimensional parameters are related through the Stokes number,
 $Fr=St/Sv$
, and that the Froude number
 $Fr$
is independent of
 ${\it\tau}_{p}$
.
Since a primary aim of this paper is to study the effect of gravity at conditions representative of those in cumulus clouds, we calculate
 $Fr$
and
 $Sv$
by assuming a dissipation rate
 ${\it\epsilon}=10^{-2}~\text{m}^{2}~\text{s}^{-3}$
(Shaw Reference Shaw2003), a kinematic viscosity
 ${\it\nu}=1.5\times 10^{-5}~\text{m}^{2}~\text{s}^{-1}$
and a gravitational acceleration
 $\mathfrak{g}=9.8~\text{m}~\text{s}^{-2}$
, yielding
 $Fr=0.052$
or
 $Sv=19.3St$
. Simulations I, II, III and IV were run with
 $Fr=0.052$
and particles with Stokes numbers in the range
 $0\leqslant St\leqslant 3$
; due to computational limitations, simulation V was only run with
 $0\leqslant St\leqslant 0.3$
.
Experimental observations suggest that cloud dissipation rates can vary by orders of magnitude (e.g. see Pruppacher & Klett Reference Pruppacher and Klett1997), resulting in commensurate variations in
 $Fr$
and
 $Sv$
. For example, a strongly turbulent cumulonimbus cloud with
 ${\it\epsilon}\sim 10^{-1}~\text{m}^{2}~\text{s}^{-3}$
yields
 $Fr\approx 0.3$
and
 $Sv\approx 3.4St$
, while a weakly turbulent stratiform cloud with
 ${\it\epsilon}\sim 10^{-3}~\text{m}^{2}~\text{s}^{-3}$
yields
 $Fr\approx 0.01$
and
 $Sv\approx 100St$
(Pinsky, Khain & Shapiro Reference Pinsky, Khain and Shapiro2007). To study a larger
 $St$
–
 $Sv$
parameter space, we analysed
 $513$
different combinations of
 $St$
and
 $Sv$
in simulation IIIb, with
 $0\leqslant St\leqslant 56.2$
and
 $0\leqslant Sv\leqslant 100$
. The results from this simulation will be used to study detailed trends in particle accelerations, clustering, relative velocities and collision rates for different values of particle inertia and gravity. (The trends in the particle kinetic energies and settling velocities obtained from this data set are discussed in detail in Good et al. (Reference Good, Ireland, Bewley, Bodenschatz, Collins and Warhaft2014).)
3 Single-particle statistics
As in Part 1, we begin with the statistics of individual inertial particles. We present velocity gradient statistics in § 3.1, gravitational settling velocity statistics in § 3.2 and acceleration statistics in § 3.3.
3.1 Velocity gradient statistics
We begin by considering velocity gradients sampled along inertial particle trajectories, here denoted by
 $\unicode[STIX]{x1D63C}(\boldsymbol{x}^{p}(t),t)\equiv \boldsymbol{{\rm\nabla}}\boldsymbol{u}(\boldsymbol{x}^{p}(t),t)$
. These statistics affect the relative motion of particles with weak-to-moderate inertia with separations in the dissipation range, and also quantify the degree to which the inertial particles preferentially sample the underlying turbulence (e.g. see Chun et al.
Reference Chun, Koch, Rani, Ahluwalia and Collins2005). This information will prove useful in interpreting the relative velocity and clustering statistics presented in §§ 4.1 and 4.2. It is convenient to define the rate-of-strain and rate-of-rotation tensors as
 $\unicode[STIX]{x1D64E}(\boldsymbol{x}^{p}(t),t)\equiv [\unicode[STIX]{x1D63C}(\boldsymbol{x}^{p}(t),t)+\unicode[STIX]{x1D63C}^{\text{T}}(\boldsymbol{x}^{p}(t),t)]/2$
and
 $\unicode[STIX]{x1D64D}(\boldsymbol{x}^{p}(t),t)\equiv [\unicode[STIX]{x1D63C}(\boldsymbol{x}^{p}(t),t)-\unicode[STIX]{x1D63C}^{\text{T}}(\boldsymbol{x}^{p}(t),t)]/2$
, respectively.
We first consider the variance of the diagonal components of
 $\unicode[STIX]{x1D64E}$
averaged along the particle trajectories. For fluid particles that uniformly sample the flow, their variances reduce to
 $\langle [\unicode[STIX]{x1D61A}_{11}(\boldsymbol{x}^{p}(t),t)]^{2}\rangle =\langle [\unicode[STIX]{x1D61A}_{22}(\boldsymbol{x}^{p}(t),t)]^{2}\rangle =\langle [\unicode[STIX]{x1D61A}_{33}(\boldsymbol{x}^{p}(t),t)]^{2}\rangle =1/(15{\it\tau}_{{\it\eta}}^{2})$
. In isotropic turbulence without gravity, these components are statistically equivalent; however, in the presence of gravity, the symmetry of the particle motion is reduced from isotropic to axisymmetric, and thus the statistics of
 $\unicode[STIX]{x1D64E}$
along the direction of gravity,
 $x_{3}$
, will differ from the transverse directions,
 $x_{1}$
and
 $x_{2}$
. For the remainder of the paper, the
 $x_{3}$
direction will be denoted as the ‘vertical’ direction and the
 $x_{1}$
and
 $x_{2}$
directions will be referred to as the ‘horizontal’ directions. The data for the two horizontal directions will be averaged together whenever possible, and denoted with the subscript ‘1’.
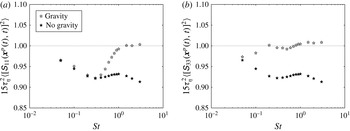
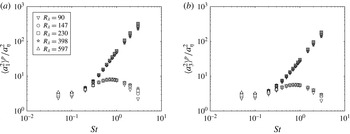
Figure 1 shows the variance of (a) horizontal (
 $\langle \unicode[STIX]{x1D61A}_{11}^{2}\rangle ^{p}\equiv \langle [\unicode[STIX]{x1D61A}_{11}(\boldsymbol{x}^{p}(t),t)]^{2}\rangle$
) and (b) vertical (
 $\langle \unicode[STIX]{x1D61A}_{33}^{2}\rangle ^{p}\equiv \langle [\unicode[STIX]{x1D61A}_{33}(\boldsymbol{x}^{p}(t),t)]^{2}\rangle$
) components of the rate-of-strain tensor as a function of
 $St$
, both with gravity (
 $Fr=0.052$
) and without gravity (
 $Fr=\infty$
). Without gravity, the strain rates decrease with increasing
 $St$
for
 $St\lesssim 0.3$
. This is closely related to the trend in the strain rates observed in Part 1, which was attributed to the fact that inertia causes particles to be ejected from vortex sheets. With gravity, the strain rates in the horizontal direction also decrease with increasing
 $St$
for
 $St\lesssim 0.3$
, as seen in figure 1(a). In addition, they are quite close to the corresponding values without gravity, suggesting that gravity does not lead to significant changes in preferential sampling in the horizontal direction at low
 $St$
. We see in figure 1(b), however, that gravity causes low-
 $St$
particles to sample regions of larger vertical strain rates, and that these strain rates are considerably different from those when gravity is absent. We also observe that gravity reduces the degree of preferential sampling at high
 $St$
, causing the strain rates to approach the values predicted for uniformly distributed particles in isotropic turbulence for
 $St\gtrsim 1$
.
The normalized variance of the diagonal components of the rate-of-strain tensor sampled by inertial particles for different values of
 $St$
at
 $R_{{\it\lambda}}=398$
. Open symbols denote data with gravity (
 $Fr=0.052$
) and filled symbols denote data without gravity (
 $Fr=\infty$
). The horizontal dotted line indicates the expected value for uniformly distributed particles in isotropic turbulence. The gradients in the horizontal and vertical directions are shown in (a) and (b), respectively.

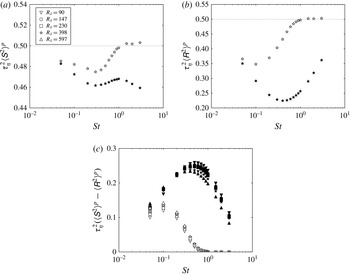
In figure 2, we plot
 ${\it\tau}_{{\it\eta}}^{2}\langle \unicode[STIX]{x1D61A}^{2}\rangle ^{p}$
,
 ${\it\tau}_{{\it\eta}}^{2}\langle \unicode[STIX]{x1D619}^{2}\rangle ^{p}$
, and
 ${\it\tau}_{{\it\eta}}^{2}(\langle \unicode[STIX]{x1D61A}^{2}\rangle ^{p}-\langle \unicode[STIX]{x1D619}^{2}\rangle ^{p})$
, where
 $\langle \unicode[STIX]{x1D61A}^{2}\rangle ^{p}\equiv \langle \unicode[STIX]{x1D64E}(\boldsymbol{x}^{p}(t),t)\boldsymbol{ : }\unicode[STIX]{x1D64E}(\boldsymbol{x}^{p}(t),t)\rangle$
and
 $\langle \unicode[STIX]{x1D619}^{2}\rangle ^{p}\equiv \langle \unicode[STIX]{x1D64D}(\boldsymbol{x}^{p}(t),t)\boldsymbol{ : }\unicode[STIX]{x1D64D}(\boldsymbol{x}^{p}(t),t)\rangle$
are the second invariants of the rate-of-strain and rate-of-rotation tensors, respectively, for particles with (
 $Fr=0.052$
) and without (
 $Fr=\infty$
) gravity. As noted in Part 1, when preferential sampling effects are absent,
 ${\it\tau}_{{\it\eta}}^{2}\langle \unicode[STIX]{x1D61A}^{2}\rangle ^{p}={\it\tau}_{{\it\eta}}^{2}\langle \unicode[STIX]{x1D619}^{2}\rangle ^{p}=0.5$
. We see from figure 2 that gravity reduces the degree of preferential sampling, causing
 ${\it\tau}_{{\it\eta}}^{2}\langle \unicode[STIX]{x1D61A}^{2}\rangle ^{p}$
,
 ${\it\tau}_{{\it\eta}}^{2}\langle \unicode[STIX]{x1D619}^{2}\rangle ^{p}$
, and
 ${\it\tau}_{{\it\eta}}^{2}(\langle \unicode[STIX]{x1D61A}^{2}\rangle ^{p}-\langle \unicode[STIX]{x1D619}^{2}\rangle ^{p})$
to be closer to the corresponding values for uniformly distributed particles. We also note that preferential sampling effects are eliminated altogether for
 $St\gtrsim 1$
, which is consistent with the results presented earlier. The trends in the mean strain and rotation rates with
 $R_{{\it\lambda}}$
are not shown in figure 2(a,b) to improve the readability of the plots, but are similar both with and without gravity and are discussed in Part 1.
 $\langle \unicode[STIX]{x1D61A}^{2}\rangle ^{p}$
(a),
 $\langle \unicode[STIX]{x1D619}^{2}\rangle ^{p}$
(b) and
 $\langle \unicode[STIX]{x1D61A}^{2}\rangle ^{p}-\langle \unicode[STIX]{x1D619}^{2}\rangle ^{p}$
(c) as function of
 $St$
. Open symbols denote data with gravity (
 $Fr=0.052$
) and filled symbols denote data without gravity (
 $Fr=\infty$
). To improve the readability of the plots, data are only shown for
 $R_{{\it\lambda}}=398$
in (a,b). Data at all values of
 $R_{{\it\lambda}}$
are included in (c).

To explain the reduction in preferential sampling with gravity, we note that gravity, by causing particles to settle relative to the underlying flow, reduces the interaction times between the particles and the turbulent eddies. As a result, particles have less time to be affected by the straining and rotating regions of the flow and therefore experience less preferential sampling (see also Gustavsson et al. Reference Gustavsson, Vajedi and Mehlig2014).
We test this argument by computing Lagrangian rate-of-strain and rate-of-rotation time scales along inertial particle trajectories, both with and without gravity. These time scales will prove useful for extending the theoretical model of Zaichik & Alipchenkov (Reference Zaichik and Alipchenkov2009) to account for gravitational effects. Their model, developed for an isotropic particle field, uses a single time scale for the rate-of-strain tensor and a single time scale for the rate-of-rotation tensor. To generalize the model for the case with gravity, directionally dependent times scales are required. We discuss the generalized model and its comparison with DNS in § 4.2.
We consider both the Lagrangian strain time scale
 $T_{\unicode[STIX]{x1D61A}_{ij}\unicode[STIX]{x1D61A}_{km}}^{p}$
, which we define as
 $$\begin{eqnarray}T_{\unicode[STIX]{x1D61A}_{ij}\unicode[STIX]{x1D61A}_{km}}^{p}\equiv \frac{\displaystyle \int _{0}^{\infty }\left\langle \unicode[STIX]{x1D61A}_{ij}(\boldsymbol{x}^{p}(0),0)\unicode[STIX]{x1D61A}_{km}(\boldsymbol{x}^{p}(s),s)\right\rangle \,\text{d}s}{\left\langle \unicode[STIX]{x1D61A}_{ij}(\boldsymbol{x}^{p}(0),0)\unicode[STIX]{x1D61A}_{km}(\boldsymbol{x}^{p}(0),0)\right\rangle },\end{eqnarray}$$
and the Lagrangian rotation time scale
 $T_{\unicode[STIX]{x1D619}_{ij}\unicode[STIX]{x1D619}_{km}}^{p}$
, defined as
 $$\begin{eqnarray}T_{\unicode[STIX]{x1D619}_{ij}\unicode[STIX]{x1D619}_{km}}^{p}\equiv \frac{\displaystyle \int _{0}^{\infty }\left\langle \unicode[STIX]{x1D619}_{ij}(\boldsymbol{x}^{p}(0),0)\unicode[STIX]{x1D619}_{km}(\boldsymbol{x}^{p}(s),s)\right\rangle \,\text{d}s}{\left\langle \unicode[STIX]{x1D619}_{ij}(\boldsymbol{x}^{p}(0),0)\unicode[STIX]{x1D619}_{km}(\boldsymbol{x}^{p}(0),0)\right\rangle }.\end{eqnarray}$$
In both of these equations, no summation is implied by the repeated indices.
In the absence of gravity, the particle field is isotropic, which implies the rate-of-strain time scales
 $T_{\unicode[STIX]{x1D61A}_{11}\unicode[STIX]{x1D61A}_{11}}^{p}$
,
 $T_{\unicode[STIX]{x1D61A}_{11}\unicode[STIX]{x1D61A}_{22}}^{p}$
,
 $T_{\unicode[STIX]{x1D61A}_{11}\unicode[STIX]{x1D61A}_{33}}^{p}$
,
 $T_{\unicode[STIX]{x1D61A}_{12}\unicode[STIX]{x1D61A}_{12}}^{p}$
,
 $T_{\unicode[STIX]{x1D61A}_{13}\unicode[STIX]{x1D61A}_{13}}^{p}$
,
 $T_{\unicode[STIX]{x1D61A}_{22}\unicode[STIX]{x1D61A}_{22}}^{p}$
,
 $T_{\unicode[STIX]{x1D61A}_{22}\unicode[STIX]{x1D61A}_{33}}^{p}$
,
 $T_{\unicode[STIX]{x1D61A}_{23}\unicode[STIX]{x1D61A}_{23}}^{p}$
, and
 $T_{\unicode[STIX]{x1D61A}_{33}\unicode[STIX]{x1D61A}_{33}}^{p}$
are statistically equivalent, as are the rotation time scales
 $T_{\unicode[STIX]{x1D619}_{12}\unicode[STIX]{x1D619}_{12}}^{p}$
,
 $T_{\unicode[STIX]{x1D619}_{13}\unicode[STIX]{x1D619}_{13}}^{p}$
and
 $T_{\unicode[STIX]{x1D619}_{23}\unicode[STIX]{x1D619}_{23}}^{p}$
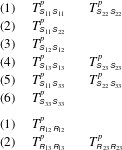
. However, with gravity, the nine rate-of-strain time scales are no longer equivalent, nor are the three rate-of-rotation time scales. Applying symmetry analysis, we can group the nine rate-of-strain time scales into six categories, and the three rate-of-rotation time scales into two categories, as shown in table 2. Additionally, we introduce
 $T_{\unicode[STIX]{x1D61A}\unicode[STIX]{x1D61A}}^{p}$
and
 $T_{\unicode[STIX]{x1D619}\unicode[STIX]{x1D619}}^{p}$
as the average of the nine rate-of-strain time scales and the three rate-of-rotation time scales, respectively.
Categorization of the strain and rotation time scales with gravity. (Gravity is aligned with the
 $x_{3}$
-direction.) The elements within a given row are statistically equivalent, while the elements in different rows may differ due to the anisotropy in the particle motion.

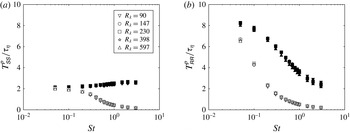
Figure 3 shows the averaged time scales
 $T_{\unicode[STIX]{x1D61A}\unicode[STIX]{x1D61A}}^{p}$
and
 $T_{\unicode[STIX]{x1D619}\unicode[STIX]{x1D619}}^{p}$
as a function of the particle Stokes number at different values of
 $R_{{\it\lambda}}$
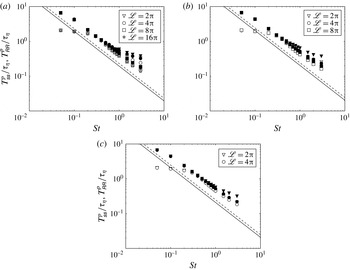
, with and without gravity. In agreement with the physical explanations offered above, we see that the time scales without gravity always exceed those with gravity. We also note that both with and without gravity, the strain time scales are almost entirely insensitive to the Reynolds number. In addition, while the rate-of-rotation time scales without gravity vary weakly with
 $R_{{\it\lambda}}$
(as noted in Part 1), they are nearly independent of the Reynolds number with gravity.
The averaged strain time scale
 $T_{\unicode[STIX]{x1D61A}\unicode[STIX]{x1D61A}}^{p}$
(a) and the averaged rotation time scale
 $T_{\unicode[STIX]{x1D619}\unicode[STIX]{x1D619}}^{p}$
(b) plotted as a function of
 $St$
for different values of
 $R_{{\it\lambda}}$
. Open symbols denote data with gravity (
 $Fr=0.052$
) and filled symbols denote data without gravity (
 $Fr=\infty$
).

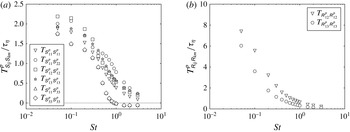
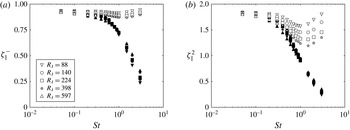
The Lagrangian strain (a) and rotation (b) time scales in different directions at
 $R_{{\it\lambda}}=398$
, plotted as a function of
 $St$
, for particles with gravity (
 $Fr=0.052$
).

We now consider the anisotropy in the different time scales with gravity at
 $R_{{\it\lambda}}=398$
in figure 4. In this plot, we have averaged together the statistically equivalent time scales grouped in table 2, and have denoted these time scales by the first (or only) item in these groups. We have not included data for cases without gravity, since each of the time scales without gravity are statistically equivalent (as noted above), and would be identical to those presented in figure 3. As expected, the time scales show considerable anisotropy with gravity. If we consider the limit of strong gravity (
 $Sv\gg u^{\prime }/u_{{\it\eta}}$
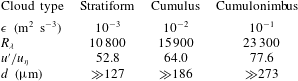
), we can derive a simple model for the time scales (see appendix B for the derivation and estimates of droplet diameters required for the model to be valid in different atmospheric clouds). Using the relations in § B.1, the Lagrangian rate-of-strain and rate-of-rotation time scales take the form
 $$\begin{eqnarray}\hat{T}_{\unicode[STIX]{x1D61A}_{ij}\unicode[STIX]{x1D61A}_{km}}^{p}=\frac{\hat{\ell }_{\unicode[STIX]{x1D61A}_{ij}\unicode[STIX]{x1D61A}_{km},3}}{Sv},\end{eqnarray}$$
and
 $$\begin{eqnarray}\hat{T}_{\unicode[STIX]{x1D619}_{ij}\unicode[STIX]{x1D619}_{km}}^{p}=\frac{\hat{\ell }_{\unicode[STIX]{x1D619}_{ij}\unicode[STIX]{x1D619}_{km},3}}{Sv},\end{eqnarray}$$
respectively, where we have used the top-hat symbol to denote a variable normalized by Kolmogorov scales, and
 $\ell _{\unicode[STIX]{x1D61A}_{ij}\unicode[STIX]{x1D61A}_{km},3}$
(
 $\ell _{\unicode[STIX]{x1D619}_{ij}\unicode[STIX]{x1D619}_{km},3}$
) is the integral length scale of
 $\unicode[STIX]{x1D61A}_{ij}\unicode[STIX]{x1D61A}_{km}$
(
 $\unicode[STIX]{x1D619}_{ij}\unicode[STIX]{x1D619}_{km}$
) evaluated along the
 $x_{3}$
-direction.
Equations (3.3) and (3.4) imply that in the limit
 $Sv\gg u^{\prime }/u_{{\it\eta}}$
, the Lagrangian integral time scales of the flow experienced by the particles are directly proportional to the Eulerian integral length scales of the strain and rotation fields. We can therefore write each of the Lagrangian time scales in table 2 as functions of their corresponding Eulerian integral length scales. This allows us to use tensor invariance theory and the properties of the strain and rotation rate tensors in HIT to predict the relative magnitude of the different time scales. We therefore can show that
 $$\begin{eqnarray}T_{\unicode[STIX]{x1D61A}_{11}\unicode[STIX]{x1D61A}_{33}}^{p}=T_{\unicode[STIX]{x1D61A}_{33}\unicode[STIX]{x1D61A}_{33}}^{p}<T_{\unicode[STIX]{x1D61A}_{11}\unicode[STIX]{x1D61A}_{11}}^{p}<T_{\unicode[STIX]{x1D61A}_{12}\unicode[STIX]{x1D61A}_{12}}^{p}=T_{\unicode[STIX]{x1D61A}_{13}\unicode[STIX]{x1D61A}_{13}}^{p}<T_{\unicode[STIX]{x1D61A}_{11}\unicode[STIX]{x1D61A}_{22}}^{p},\end{eqnarray}$$
and
 $$\begin{eqnarray}T_{\unicode[STIX]{x1D619}_{13}\unicode[STIX]{x1D619}_{13}}^{p}<T_{\unicode[STIX]{x1D619}_{12}\unicode[STIX]{x1D619}_{12}}^{p}.\end{eqnarray}$$
The DNS data in figure 4 follow the trends predicted by (3.5) and (3.6) at high
 $St$
.
3.2 Mean particle settling velocities
We now analyse the effect of turbulence on the mean settling speed of inertial particles. The role of the mean settling velocity, aside from its importance to the process of cloud rain out, is also related to the evolution of the droplet size distribution through its effect on the collision kernel of different-sized particles, as discussed in Dávila & Hunt (Reference Dávila and Hunt2001) and Ghosh et al. (Reference Ghosh, Dávila, Hunt, Srdic, Fernando and Jonas2005) and later modelled by Grabowski & Wang (Reference Grabowski and Wang2013).
Recently, Good et al. (Reference Good, Ireland, Bewley, Bodenschatz, Collins and Warhaft2014) measured settling speeds of particles in turbulence and showed that turbulence causes particles with low-to-moderate Stokes numbers to settle more quickly than they would in a quiescent fluid. The so-called ‘preferential sweeping’ or ‘fast tracking’ of particles (particles sampling downward-moving fluid over upward-moving fluid) had been observed in DNS (Wang & Maxey Reference Wang and Maxey1993; Yang & Lei Reference Yang and Lei1998; Ireland & Collins Reference Ireland and Collins2012; Bec et al.
Reference Bec, Homann and Ray2014) and earlier experiments (Aliseda et al.
Reference Aliseda, Cartellier, Hainaux and Lasheras2002; Yang & Shy Reference Yang and Shy2003, Reference Yang and Shy2005). For
 $St\gtrsim 1$
, Good et al. (Reference Good, Ireland, Bewley, Bodenschatz, Collins and Warhaft2014) observed a transition to so-called ‘loitering’ (particles settling more slowly than they would in a quiescent fluid), again consistent with earlier experiments (Nielsen Reference Nielsen1993; Yang & Shy Reference Yang and Shy2003; Kawanisi & Shiozaki Reference Kawanisi and Shiozaki2008), although Good et al. (Reference Good, Ireland, Bewley, Bodenschatz, Collins and Warhaft2014) were the first to measure it for droplets in air. In contrast, DNS with linear drag shows preferential sweeping at all Stokes numbers, with no transition to loitering (Wang & Maxey Reference Wang and Maxey1993; Yang & Lei Reference Yang and Lei1998; Ireland & Collins Reference Ireland and Collins2012; Bec et al.
Reference Bec, Homann and Ray2014). In order to observe loitering in DNS, the linear drag must be replaced by a nonlinear drag model (e.g. Clift, Grace & Weber Reference Clift, Grace and Weber1978). The nonlinear drag model yields settling speeds that are only in qualitative, but not quantitative, agreement with the experiments, most likely due to the simplistic nature of the nonlinear drag model that was used (Good et al.
Reference Good, Ireland, Bewley, Bodenschatz, Collins and Warhaft2014).
Here, we extend the range of Reynolds numbers for
 $0\leqslant St\leqslant 3$
and
 $Fr=0.052$
using a linear drag model. From (2.3) we can show that
 $$\begin{eqnarray}\langle \boldsymbol{u}(\boldsymbol{x}^{p}(t),t)\rangle =\langle \boldsymbol{v}^{p}(t)\rangle -{\it\tau}_{p}\boldsymbol{\mathfrak{g}}\equiv -\langle {\bf\Delta}\boldsymbol{v}\rangle ^{p},\end{eqnarray}$$
where
 ${\it\tau}_{p}\boldsymbol{\mathfrak{g}}=(0,0,-{\it\tau}_{p}\mathfrak{g})^{\text{T}}$
is the gravitational settling velocity in a quiescent flow. Preferential sweeping corresponds to
 $\langle {\rm\Delta}v_{3}\rangle ^{p}>0$
and loitering to
 $\langle {\rm\Delta}v_{3}\rangle ^{p}<0$
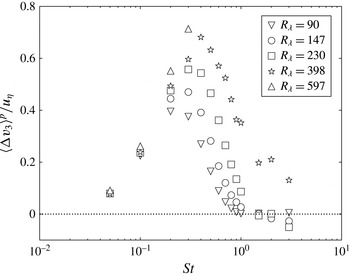
. Figure 5 shows
 $\langle {\rm\Delta}v_{3}\rangle ^{p}$
, normalized by the Kolmogorov velocity
 $u_{{\it\eta}}$
, as a function of the particle Stokes number. Consistent with the DNS results presented in Good et al. (Reference Good, Ireland, Bewley, Bodenschatz, Collins and Warhaft2014), the DNS with linear drag shows no significant loitering at any Reynolds number. (Note that while the slight loitering observed at
 $St=3$
for
 $R_{{\it\lambda}}=147$
and
 $R_{{\it\lambda}}=230$
is statistically significant, the quiescent settling velocity is reduced by less than 0.1 %, and thus the overall effect is negligible. In Good et al. (Reference Good, Ireland, Bewley, Bodenschatz, Collins and Warhaft2014), the settling speed reductions with nonlinear drag were observed to be one to two orders of magnitude larger than this.) Moreover, we see that the mean settling speeds are independent of
 $R_{{\it\lambda}}$
for
 $St\leqslant 0.1$
, suggesting that in this limit, they are determined entirely by the small-scale turbulence, in agreement with Bec et al. (Reference Bec, Homann and Ray2014). At higher
 $St$
, the settling speeds are stronger functions of the Reynolds number; however, these results must be interpreted with some caution given the concerns raised about linear drag in this regime. Nevertheless, we see at least the potential for a significant Reynolds-number effect on the mean settling velocities at higher Stokes number.
Turbulence-induced enhancements (positive) or reductions (negative) in the mean settling velocities of inertial particles with gravity (
 $Fr=0.052$
), normalized by the Kolmogorov velocity
 $u_{{\it\eta}}$
. The symbols denote different values of
 $R_{{\it\lambda}}$
.

3.3 Particle accelerations
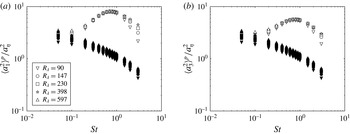
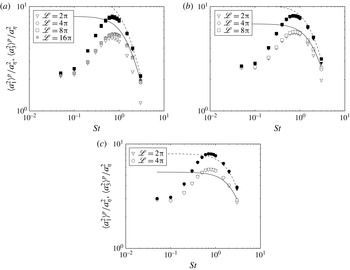
We now consider the acceleration statistics of the particles. As noted in Chun et al. (Reference Chun, Koch, Rani, Ahluwalia and Collins2005), the relative velocity of different-sized particles (and thus their collision rate) is related to their accelerations. Figure 6 shows the particle acceleration variances
 $\langle a_{1}^{2}\rangle ^{p}\equiv \langle (\text{d}v_{1}^{p}(t)/\text{d}t)^{2}\rangle$
and
 $\langle a_{3}^{2}\rangle ^{p}\equiv \langle (\text{d}v_{3}^{p}(t)/\text{d}t)^{2}\rangle$
, with and without gravity. Notice that the acceleration variances with gravity always exceed those without gravity, in some cases by as much as an order of magnitude. Similar trends were observed in computational and experimental studies of channel flows (Gerashchenko et al.
Reference Gerashchenko, Sharp, Neuscamman and Warhaft2008; Lavezzo et al.
Reference Lavezzo, Soldati, Gerashchenko, Warhaft and Collins2010) and more recently in the computational study of Parishani et al. (Reference Parishani, Ayala, Rosa, Wang and Grabowski2015) in HIT.
The variance of the particle accelerations in the horizontal (a) and vertical (b) directions. Open symbols denote data with gravity (
 $Fr=0.052$
), and filled symbols denote data without gravity (
 $Fr=\infty$
).

We also see that gravity reverses the trends in the particle accelerations at low
 $St$
, causing the accelerations to increase with increasing
 $St$
. This trend was recently reported in Parishani et al. (Reference Parishani, Ayala, Rosa, Wang and Grabowski2015) at lower values of
 $R_{{\it\lambda}}$
(
 $R_{{\it\lambda}}=119{-}143$
). Our results in appendix A, however, suggest that the acceleration statistics in Parishani et al. (Reference Parishani, Ayala, Rosa, Wang and Grabowski2015), while qualitatively correct, have quantitative errors due the influence of artificial periodicity effects on the small domain sizes in their simulations. Experimental studies of inertial particle accelerations in HIT (Ayyalasomayajula et al.
Reference Ayyalasomayajula, Gylfason, Collins, Bodenschatz and Warhaft2006) and Von Kármán flows (Volk et al.
Reference Volk, Calzavarini, Verhille, Lohse, Mordant, Pinton and Toschi2008a
,Reference Volk, Mordant, Verhille and Pinton
b
) have only observed a monotonic decrease of the particle accelerations with increasing
 $St$
, presumably because the Froude numbers in those studies (
 $Fr\sim 0.3$
for HIT and
 $Fr\sim 30$
for the Von Kármán flow) were too large to observe this trend reversal. (Recall that in our study,
 $Fr=0.052$
.)
We now provide a physical explanation for these large accelerations. We begin by considering the limit
 $St\ll 1$
. If gravitational forces are negligible, to leading order the particle acceleration
 $\boldsymbol{a}^{p}(t)$
is equivalent to the fluid acceleration at the particle location (e.g. see Bec et al.
Reference Bec, Biferale, Boffetta, Celani, Cencini, Lanotte, Musacchio and Toschi2006)
 $$\begin{eqnarray}\boldsymbol{a}^{p}(t)\approx \frac{\partial \boldsymbol{u}(\boldsymbol{x}^{p}(t),t)}{\partial t}+\boldsymbol{u}(\boldsymbol{x}^{p}(t),t)\boldsymbol{\cdot }\boldsymbol{{\rm\nabla}}\boldsymbol{u}(\boldsymbol{x}^{p}(t),t).\end{eqnarray}$$
As the gravitational force increases (i.e. as
 $Sv$
increases), it is the interplay between gravity and turbulence that determines the particle acceleration. For example, the downward drift due to the gravitational settling will cause the particle to experience different regions of the turbulence. We refer to this phenomenon as the ‘gravitational trajectory effect’. (Note that Yudine (Reference Yudine1959) coined ‘crossing trajectories’ to refer to the same mechanism.)
The particle acceleration in the limits
 $St\ll 1$
and
 $Sv\gg 1$
can be approximated by the derivative of the fluid velocity along the inertial particle trajectory (denoted here as
 $\text{d}\boldsymbol{u}^{p}/\text{d}t$
), yielding (see Bec et al.
Reference Bec, Biferale, Boffetta, Celani, Cencini, Lanotte, Musacchio and Toschi2006)
 $$\begin{eqnarray}\boldsymbol{a}^{p}(t)\approx \frac{\text{d}\boldsymbol{u}^{p}}{\text{d}t}=\frac{\partial \boldsymbol{u}(\boldsymbol{x}^{p}(t),t)}{\partial t}+\boldsymbol{v}^{p}(t)\boldsymbol{\cdot }\boldsymbol{{\rm\nabla}}\boldsymbol{u}(\boldsymbol{x}^{p}(t),t).\end{eqnarray}$$
We compare the variances of the horizontal and vertical components of
 $\text{d}\boldsymbol{u}^{p}(t)/\text{d}t$
(denoted as
 $\langle (\text{d}u_{1}/\text{d}t)^{2}\rangle ^{p}$
and
 $\langle (\text{d}u_{3}/\text{d}t)^{2}\rangle ^{p}$
, respectively) with
 $\langle a_{1}^{2}\rangle ^{p}$
and
 $\langle a_{3}^{2}\rangle ^{p}$
in figure 7. The variances of
 $\boldsymbol{a}^{p}(t)$
and
 $\text{d}\boldsymbol{u}^{p}(t)/\text{d}t$
are almost identical at low
 $St$
, as expected. As
 $St$
increases, the particles have larger settling velocities, causing the fluid seen by the particles to change more rapidly in time. As a result, the variance of
 $\text{d}\boldsymbol{u}^{p}/\text{d}t$
increases monotonically without bound with increasing
 $St$
. In contrast, the inertial particle acceleration peaks around
 $St\sim 1$
and then decreases, causing the variance of
 $\text{d}\boldsymbol{u}^{p}/\text{d}t$
to exceed that of
 $\boldsymbol{a}^{p}(t)$
for
 $St\gtrsim 0.3$
. The trend for the acceleration variance occurs because the particle’s inertia also modulates its response to the underlying fluid through ‘inertial filtering’ (Bec et al.
Reference Bec, Biferale, Boffetta, Celani, Cencini, Lanotte, Musacchio and Toschi2006; Salazar & Collins Reference Salazar and Collins2012). The particle is unable to respond to fluid fluctuations with frequencies greater than
 $O(1/{\it\tau}_{p})$
, causing a reduction in the acceleration variance. Beyond
 $St\sim 1$
, inertial filtering dominates the enhancement due to gravitational settling, causing the particle accelerations to decrease with increasing
 $St$
.
Inertial particle acceleration variances in the horizontal (a) and vertical (b) directions for different values of
 $St$
and
 $R_{{\it\lambda}}$
. All data are with gravity included (
 $Fr=0.052$
). Open symbols denote
 $\langle a_{1}^{2}\rangle ^{p}$
(a) and
 $\langle a_{3}^{2}\rangle ^{p}$
(b) and filled symbols denote
 $\langle (\text{d}u_{1}/\text{d}t)^{2}\rangle ^{p}$
(a) and
 $\langle (\text{d}u_{3}/\text{d}t)^{2}\rangle ^{p}$
(b).

Parishani et al. (Reference Parishani, Ayala, Rosa, Wang and Grabowski2015) also observed a peak in the particle acceleration variance for
 $St\sim 1$
with gravity, and argued that the preferential sweeping mechanism identified in Wang & Maxey (Reference Wang and Maxey1993) is responsible for producing these large accelerations. While we observe a similar peak in the acceleration variances, we find preferential sweeping to be negligible at
 $St\sim 1$
for
 $R_{{\it\lambda}}\lesssim 230$
(see § 3.2). Our data also indicate that the preferential sweeping of
 $St\sim 1$
particles varies significantly with
 $R_{{\it\lambda}}$
, while the acceleration variances are nearly independent of
 $R_{{\it\lambda}}$
. These findings suggest that preferential sweeping cannot fully explain the trends in the acceleration variances with gravity. In contrast, the approach we have taken is able to predict the dependence of the accelerations on
 $St$
and
 $Sv$
without appealing to preferential sweeping arguments.
By comparing figures 7(a) and 7(b) we notice that
 $\langle a_{1}^{2}\rangle ^{p}$
generally exceeds
 $\langle a_{3}^{2}\rangle ^{p}$
. We use the acceleration model derived in § B.2 to explain this result in the limit
 $Sv\gg u^{\prime }/u_{{\it\eta}}$
. From § B.2, we have the following models for the particle acceleration variances in the high-
 $Sv$
limit:
 $$\begin{eqnarray}\frac{\langle a_{1}^{2}\rangle ^{p}}{a_{{\it\eta}}^{2}}=\left[\frac{u^{\prime }}{u_{{\it\eta}}}\right]^{2}\left[\frac{Sv}{St}\right]\left[\frac{2StSv+3\left(\displaystyle \frac{\ell }{{\it\eta}}\right)}{2\left(StSv+\displaystyle \frac{\ell }{{\it\eta}}\right)^{2}}\right],\end{eqnarray}$$
and
 $$\begin{eqnarray}\frac{\langle a_{3}^{2}\rangle ^{p}}{a_{{\it\eta}}^{2}}=\left[\frac{u^{\prime }}{u_{{\it\eta}}}\right]^{2}\left[\frac{Sv}{St}\right]\left[\frac{1}{StSv+\displaystyle \frac{\ell }{{\it\eta}}}\right].\end{eqnarray}$$
By taking the ratio of (3.10) and (3.11), we see that
 $$\begin{eqnarray}\frac{\langle a_{1}^{2}\rangle ^{p}}{\langle a_{3}^{2}\rangle ^{p}}=\frac{2StSv+3\left(\displaystyle \frac{\ell }{{\it\eta}}\right)}{2StSv+2\left(\displaystyle \frac{\ell }{{\it\eta}}\right)},\end{eqnarray}$$
and thus the model also predicts that
 $\langle a_{1}^{2}\rangle ^{p}$
exceeds
 $\langle a_{3}^{2}\rangle ^{p}$
by an amount that increases with
 $R_{{\it\lambda}}$
.
In the derivation of this model, we assumed that the particles’ primary motion is in the vertical direction, from which it followed that the particle accelerations were related to the correlation length scales of the fluid velocities sampled along the particle trajectories. Since in isotropic turbulence the longitudinal integral length scale is twice the transverse integral length scale, the particles (as they fall vertically) will experience vertical fluid velocities that are more strongly correlated over a time
 ${\it\tau}_{p}$
than are the horizontal fluid velocities. (This phenomenon was referred to as the ‘continuity effect’ in Csanady (Reference Csanady1963), and is also explained in Yudine (Reference Yudine1959) and Good et al. (Reference Good, Ireland, Bewley, Bodenschatz, Collins and Warhaft2014).) As a result, the horizontal fluid velocities sampled by the particles will change more rapidly, leading to larger particle accelerations in those directions.
In Parishani et al. (Reference Parishani, Ayala, Rosa, Wang and Grabowski2015), the authors argued that the differences in the horizontal and vertical particle accelerations are linked to the preferential sweeping mechanism of Wang & Maxey (Reference Wang and Maxey1993). That is, a falling particle will accelerate toward the downward-moving part of an eddy, where the vertical fluid velocity changes slowly but the horizontal fluid velocity changes rapidly. While this explanation is plausible for
 $St\lesssim 0.3$
(where preferential sweeping is strong, as shown in § 3.2), it fails to explain the strong difference between the horizontal and vertical accelerations at higher values of
 $St$
, where we observe negligible preferential sweeping for
 $R_{{\it\lambda}}\lesssim 230$
. The models developed by Parishani et al. (Reference Parishani, Ayala, Rosa, Wang and Grabowski2015) are for the low-
 $St$
limit, whereas our approach is based on the characteristics of the Eulerian velocity field and provides a quantitative prediction for the accelerations at larger values of
 $St$
.
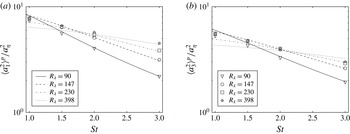
In figure 8, we compare the DNS data for
 $\langle a_{1}^{2}\rangle ^{p}$
and
 $\langle a_{3}^{2}\rangle ^{p}$
to the model predictions for
 $St\geqslant 1$
(
 $Sv\geqslant 19.3$
). We find that the results are in good agreement at the largest values of
 $St$
, with the model being able to predict both the trends with
 $R_{{\it\lambda}}$
and the decrease in the variances with increasing
 $St$
. It is important to note that the trends in
 $R_{{\it\lambda}}$
at high
 $St$
are simply a result of the scale separation of the turbulence and are not due to intermittency effects. This is evident by the fact that our model does not account for intermittency, but can still accurately reproduce the trends with Reynolds number. At very low values of
 $St$
, however, when gravity is weak (and our model no longer holds), intermittency effects are indeed important. Refer to Part 1 for a discussion of the role of intermittency on the accelerations of low-
 $St$
particles.
Comparison between DNS data and theoretical predictions for the variance of the particle accelerations in the horizontal (a) and vertical (b) directions at high
 $St$
. Open symbols denote DNS data with gravity (
 $Fr=0.052$
), and the lines in (a) and (b) indicate the predictions from (3.10) and (3.11), respectively, for the different Reynolds numbers simulated.

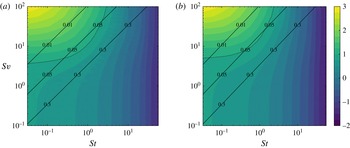
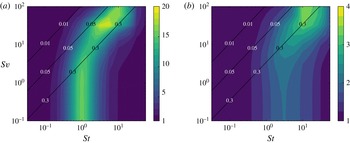
Filled contours of the particle acceleration variances,
 $\langle a_{1}^{2}\rangle ^{p}$
(a) and
 $\langle a_{3}^{2}\rangle ^{p}$
(b), normalized by the Kolmogorov acceleration variance
 $a_{{\it\eta}}^{2}$
, for
 $R_{{\it\lambda}}=227$
. The contours are logarithmically scaled, and the labels on the colour bar denote exponents of the decade. The diagonal lines denote three different values of
 $Fr$
, corresponding to conditions representative of stratiform clouds (
 $Fr=0.01$
), cumulus clouds (
 $Fr=0.05$
) and cumulonimbus clouds (
 $Fr=0.3$
). The dotted lines corresponds to
 $\langle a_{1}^{2}\rangle ^{p}=a_{{\it\eta}}^{2}$
in (a) and
 $\langle a_{3}^{2}\rangle ^{p}=a_{{\it\eta}}^{2}$
in (b).

To further explore the trends in the accelerations for particles with varying levels of inertia and gravity, we plot in figure 9 the inertial particle acceleration variances for a wide range of
 $St$
and
 $Sv$
at
 $R_{{\it\lambda}}=227$
. (Recall that statistics at the largest values of
 $Sv$
have errors due to unphysical effects of the periodic boundary conditions. Refer to appendix A for a more detailed explanation.) As expected, the particle acceleration variances are the largest for
 $St\ll 1$
and
 $Sv\gg 1$
due to the gravitational trajectory effect, as predicted by (3.10) and (3.11). For sufficiently large
 $St$
, particles filter out nearly all of the large-scale turbulence, and so acceleration variances are small. For intermediate
 $St$
and
 $Sv$
, the particle accelerations are determined by a combination of preferential sampling, gravitational trajectory and inertial filtering effects. We also observe from figure 9 that the particle acceleration variances are the largest under conditions representative of stratiform clouds (
 $Fr\sim 0.01$
) and the smallest under conditions representative of cumulonimbus clouds (
 $Fr\sim 0.3$
).
4 Two-particle statistics
We now consider particle-pair statistics, in particular, particle relative velocities (§ 4.1), clustering (§ 4.2) and the collision kernels (§ 4.3). In each case, we compare our results to those without gravity (from Part 1) to highlight the role of gravity.
4.1 Particle relative velocities
In this section, we examine the effect of gravity on the relative velocities of two identical inertial particles. We first discuss the expected effect of gravity on the relative velocities from a theoretical framework (§ 4.1.1), and then analyse the DNS results (§ 4.1.2).
4.1.1 Theoretical framework for particle relative velocities
As in Part 1, we define the relative position and velocity as
 $\boldsymbol{r}^{p}(t)$
and
 $\boldsymbol{w}^{p}(t)$
, respectively, and
 ${\bf\Delta}\boldsymbol{u}(\boldsymbol{r}^{p}(t),t)$
as the difference in fluid velocities at the particle locations. By subtracting (2.3) for two particles at a given instant in time, we obtain the following equation for the relative position and velocity of the two particles
 $$\begin{eqnarray}\frac{\text{d}^{2}\boldsymbol{r}^{p}}{\text{d}t^{2}}=\frac{\text{d}\boldsymbol{w}^{p}}{\text{d}t}=\frac{{\bf\Delta}\boldsymbol{u}\left(\boldsymbol{r}^{p}(t),t\right)-\boldsymbol{w}^{p}(t)}{{\it\tau}_{p}}.\end{eqnarray}$$
Notice that the gravity vector precisely cancels out of this equation, making it appear as though gravity does not influence the relative motion of the particle pair; however, this is not true, as gravity has an implicit effect on the statistics of
 ${\bf\Delta}\boldsymbol{u}(\boldsymbol{r}^{p}(t),t)$
, and this substantially modifies the relative position and velocity statistics of the particles (as will be shown below).
Following the nomenclature in Part 1, we define the second-order particle relative velocity structure function tensor as
 $$\begin{eqnarray}\boldsymbol{S}_{2}^{p}(\boldsymbol{r})=\langle \boldsymbol{w}^{p}(t)\boldsymbol{w}^{p}(t)\rangle _{\boldsymbol{ r}},\end{eqnarray}$$
where
 $\langle \cdot \rangle _{\boldsymbol{r}}$
denotes an ensemble average conditioned on
 $\boldsymbol{r}^{p}(t)=\boldsymbol{r}$
. We now use the formal solution of (4.1) to construct the exact expression for
 $\boldsymbol{S}_{2}^{p}(\boldsymbol{r})$
. This will allow us to explain the expected trends in the structure functions with inertia and gravity. The exact expression for
 $\boldsymbol{S}_{2}^{p}(\boldsymbol{r})$
is given by (e.g. see Pan & Padoan Reference Pan and Padoan2010)
 $$\begin{eqnarray}\hat{\boldsymbol{S}}_{2}^{p}(\hat{\boldsymbol{r}})=\frac{1}{St^{2}}\int _{-\infty }^{0}\int _{-\infty }^{0}\langle {\bf\Delta}\hat{\boldsymbol{u}}(\hat{\boldsymbol{r}}^{p}({\hat{s}}),{\hat{s}}){\bf\Delta}\hat{\boldsymbol{u}}(\hat{\boldsymbol{r}}^{p}({\hat{S}}),{\hat{S}})\rangle _{\hat{\boldsymbol{ r}}}\,\exp [St^{-1}({\hat{s}}+{\hat{S}})]\,\text{d}{\hat{s}}\,\text{d}{\hat{S}},\end{eqnarray}$$
where
 $\hat{Z}$
denotes a variable
 $Z$
normalized by Kolmogorov scales.
We first consider (4.3) in the absence of gravity. From (4.3), we observe that particle relative velocities are affected by the fluid velocity difference
 ${\bf\Delta}\boldsymbol{u}(\boldsymbol{r}^{p}(t),t)$
along their trajectories. For small values of
 $St$
, the high damping of the exponential term in (4.3) causes contributions to the integral from the particle history to be negligible, and hence the particle relative velocities in the equation become equivalent to the instantaneous fluid velocity difference at the current particle position, reflecting the fact that preferential sampling is the dominant mechanism affecting relative particle motion. As shown in Part 1, preferential sampling causes inertial particles to experience larger fluid velocity differences than those of fluid particles in directions parallel to the particle separation vector and smaller fluid velocity differences in directions perpendicular to the particle separation vector. As
 $St$
increases, in the absence of gravity, the exponential damping diminishes and the influence of the particle history becomes increasingly important. At higher
 $St$
, particles retain a memory of their interactions with the turbulence, and it is the fluid velocities at larger separations along their path histories that dominate the contribution to the particle velocity dynamics, leading to particle relative velocities that are larger than the local fluid velocity difference. This phenomenon has been referred to as ‘caustics’ (e.g. see Wilkinson & Mehlig Reference Wilkinson and Mehlig2005; Wilkinson et al.
Reference Wilkinson, Mehlig and Bezuglyy2006). Refer to Bragg & Collins (Reference Bragg and Collins2014b
) for a more complete theoretical description of this phenomenon, and to Part 1 for supporting DNS evidence.
We now introduce gravity and discuss its effect on the relative velocities. Recall in § 3.1 that gravity generally reduces the degree of preferential sampling. With gravity, we therefore expect the relative velocities of small-
 $St$
particles to be affected less by preferential sampling, and therefore to have dynamics closer to that of the fluid particles. At higher values of
 $St$
, gravity alters the inertial particle relative velocities through its influence on the path-history mechanism. We observed in § 3.1 that gravity reduces the correlation time scales of the flow along particle trajectories. This implies that gravity causes the fluid velocity differences in (4.3) to become decorrelated more rapidly, and thus it reduces the correlation radius over which the relative velocities are influenced by their path-history interactions with the fluid. We therefore expect the particle relative velocities to be reduced by gravity. A similar explanation is given in Fouxon et al. (Reference Fouxon, Park, Harduf and Lee2015), where the authors also argue that path-history effects are reduced in the presence of gravity.
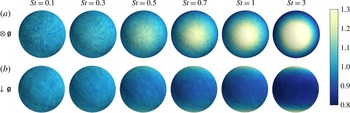
In addition to the magnitude changes caused by gravity, its directional nature causes the symmetry of the particle field to become anisotropic. We define the mean inward, parallel and perpendicular relative velocity statistics as
 $$\begin{eqnarray}\displaystyle & \displaystyle S_{-\Vert }^{p}(\boldsymbol{r})\equiv -\int _{-\infty }^{0}w_{\Vert }p(w_{\Vert }\mid \boldsymbol{r})\,\text{d}w_{\Vert }, & \displaystyle\end{eqnarray}$$
 $$\begin{eqnarray}\displaystyle & \displaystyle S_{2\Vert }^{p}(\boldsymbol{r})\equiv \int _{-\infty }^{\infty }[w_{\Vert }]^{2}p(w_{\Vert }\mid \boldsymbol{r})\,\text{d}w_{\Vert }, & \displaystyle\end{eqnarray}$$
 $$\begin{eqnarray}\displaystyle & \displaystyle S_{2\bot }^{p}(\boldsymbol{r})\equiv \int _{-\infty }^{\infty }[w_{\bot }]^{2}p(w_{\bot }\mid \boldsymbol{r})\,\text{d}w_{\bot }, & \displaystyle\end{eqnarray}$$
where
 $w_{\Vert }$
and
 $w_{\bot }$
are the longitudinal (i.e. parallel to the particle separation vector) and transverse (i.e. perpendicular to the particle separation vector) components of the relative velocity, respectively, and
 $p(w_{\Vert }\mid \boldsymbol{r})$
and
 $p(w_{\bot }\mid \boldsymbol{r})$
are their respective probability density functions conditioned on the separation vector
 $\boldsymbol{r}$
. In the absence of gravity,
 $S_{2\Vert }^{p}$
,
 $S_{2\bot }^{p}$
, and
 $S_{-\Vert }^{p}$
are functions of the separation distance
 $r\equiv |\boldsymbol{r}|$
only. With gravity, these statistics become functions of the angle between the separation vector
 $\boldsymbol{r}$
and the gravity vector
 $\boldsymbol{\mathfrak{g}}$
, here denoted as
 ${\it\theta}$
. A convenient way to express this dependence is to expand these functions in a spherical harmonic series
 $$\begin{eqnarray}\displaystyle & \displaystyle S_{-\Vert }^{p}(\boldsymbol{r})=\mathop{\sum }_{\ell =0}^{\infty }C_{2\ell }^{0}(r)Y_{2\ell }^{0}({\it\theta}), & \displaystyle\end{eqnarray}$$
 $$\begin{eqnarray}\displaystyle & \displaystyle S_{2\Vert }^{p}(\boldsymbol{r})=\mathop{\sum }_{\ell =0}^{\infty }D_{2\ell }^{0}(r)Y_{2\ell }^{0}({\it\theta}), & \displaystyle\end{eqnarray}$$
 $$\begin{eqnarray}\displaystyle & \displaystyle S_{2\bot }^{p}(\boldsymbol{r})=\mathop{\sum }_{\ell =0}^{\infty }E_{2\ell }^{0}(r)Y_{2\ell }^{0}({\it\theta}), & \displaystyle\end{eqnarray}$$
where
 $C_{2\ell }^{0}(r)$
,
 $D_{2\ell }^{0}(r)$
and
 $E_{2\ell }^{0}(r)$
, are the spherical harmonic coefficients, and
 $Y_{2\ell }^{0}$
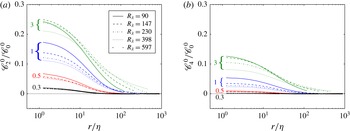
are the spherical harmonic functions. In discussing the results below, we will quantify the degree of anisotropy introduced by gravity by analysing the relative magnitudes of the spherical harmonic coefficients. Similar expansions will be used to describe the anisotropic radial distribution function that results from gravity.
4.1.2 Relative velocity results
We now analyse the results from the DNS using the decompositions described in § 4.1.1. To study how gravity affects the magnitude of the relative velocity, we first consider the zeroth-order coefficients,
 $C_{0}^{0}(r)\equiv S_{-\Vert }^{p}(r)$
,
 $D_{0}^{0}(r)\equiv S_{2\Vert }^{p}(r)$
and
 $E_{0}^{0}(r)\equiv S_{2\bot }^{p}(r)$
, where we have taken
 $Y_{0}^{0}=1$
. In effect, these coefficients represent the spherical average over the anisotropic particle field.
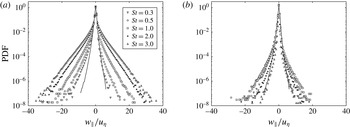
Figure 10 shows the probability density function (PDF) for the parallel component of the relative velocity for
 $0\leqslant r/{\it\eta}\leqslant 2$
, at different Stokes numbers and a fixed Reynolds number of 398. The panel on the left-hand side shows the case of no gravity and the panel on the right-hand side the case of
 $Fr=0.052$
. It is immediately apparent that gravity has a profound effect on the PDFs, causing a dramatic reduction in the tails of the distribution, particularly for particles with larger Stokes numbers. This is consistent with the explanation given in § 4.1.1, which argued that gravity suppresses path-history effects, thereby reducing the relative velocities.
PDFs of the radial relative velocities without gravity (a) and with gravity (
 $Fr=0.052$
) (b) at
 $R_{{\it\lambda}}=398$
and
 $0\leqslant r/{\it\eta}\leqslant 2$
. The solid line denotes data for fluid (
 $St=0$
) particles.

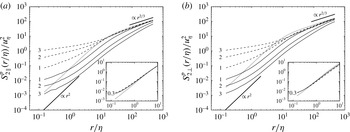
We next consider the relative velocity variances as a function of the separation distance. Figure 11 shows the spherically averaged quantities
 $S_{2\Vert }^{p}(r)$
and
 $S_{2\bot }^{p}(r)$
. For
 $St\geqslant 1$
(corresponding to
 $Sv\geqslant 19.3$
), we observe that gravity strongly decreases the relative velocities, by orders of magnitude in some cases. The explanation is that gravity reduces the effect of the path-history interactions, causing a reduction in the relative velocities (cf. § 4.1.1).
The variance of the particle relative velocities parallel to the separation vector (a) and perpendicular to the separation vector (b) for
 $R_{{\it\lambda}}=398$
, plotted as a function of
 $r/{\it\eta}$
for different
 $St$
. The thin solid lines indicate data with gravity (
 $Fr=0.052$
), the dashed lines indicate data without gravity, and the thick dotted line indicates fluid (
 $St=0$
) particles. The Stokes numbers are indicated by the line labels, and the fluid velocity scalings are indicated by thick solid lines. The main plots show
 $St=0$
and
 $St\geqslant 1$
, while the insets show
 $St=0$
and
 $St=0.3$
.

Data at
 $St=0.3$
are shown in the insets in figure 11. For
 $St=0.3$
and very small separations (
 $r/{\it\eta}\lesssim 1$
), the relative velocities show evidence of path-history effects (see also Part 1), causing the relative velocities to exceed those of
 $St=0$
particles in both the parallel and perpendicular directions. However, at larger separations (
 $1\lesssim r/{\it\eta}\lesssim 10$
), the perpendicular relative velocities become less than those of
 $St=0$
particles, as expected, as a result of preferential sampling. We also see that gravity causes the relative velocities to approach those of the underlying fluid, since it decreases preferential sampling effects. These trends are consistent with the discussion in § 4.1.1. (Note that since particles with
 $St<0.3$
have only weak gravitational forces (
 $Sv<5.79$
), the effect of gravity on the relative velocities is less apparent and data from these particle classes are therefore not shown.)
The decreased influence of path-history interactions is also apparent in the scaling of the relative velocity variances in figure 11. In the dissipation range, the fluid relative velocity variances are proportional to
 $r^{2}$
. In the absence of gravity, the relative velocities for
 $St\geqslant 1$
do not exhibit
 $r^{2}$
-scaling over any portion of the dissipation range, as was noted in Part 1. However, with gravity, we see a clearer
 $r^{2}$
-scaling extending much deeper into the dissipation range for
 $1\lesssim r/{\it\eta}\lesssim 10$
. Compared to the case without gravity, one has to go to smaller separations to observe deviations from
 $r^{2}$
scaling, as gravity reduces the path-history effect responsible for the formation of caustics.
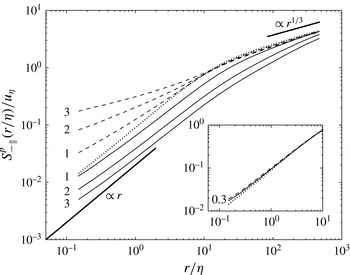
Of particular interest to the collision kernel is the mean inward velocity (cf. § 4.3). In general, the mean inward velocity is more difficult to analyse theoretically than the relative velocity variance, but qualitatively we expect both statistics to follow the same trends. In figure 12, we show
 $S_{-\Vert }^{p}$
at
 $R_{{\it\lambda}}=398$
, both with and without gravity. We see that the mean inward velocities, like the variances, decrease with the addition of gravity at large
 $St$
due to the reduced influence of the path-history mechanism and at small
 $St$
due to the reduced influence of the preferential sampling mechanism. Interestingly, with gravity, the mean inward relative velocities (in contrast to the relative velocity variances) follow the local fluid scaling almost perfectly throughout the entire dissipation range. This result was also noted in Bec et al. (Reference Bec, Homann and Ray2014). One plausible explanation is that since the mean inward velocity is a lower-order statistic than the velocity variance, it is less affected by path-history interactions and is more affected by the local fluid turbulence, causing the scaling exponents to increase (see Part 1).
The mean inward particle relative velocity for
 $R_{{\it\lambda}}=398$
, plotted as a function of
 $r/{\it\eta}$
for different
 $St$
. The thin solid lines indicate data with gravity (
 $Fr=0.052$
), the dashed lines indicate data without gravity and the thick dotted line indicates fluid (
 $St=0$
) particles. The Stokes numbers are indicated by the line labels and the fluid velocity scalings are shown by thick solid lines. The main plot shows
 $St=0$
and
 $St\geqslant 1$
, while the inset shows
 $St=0$
and
 $St=0.3$
.

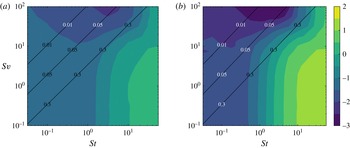
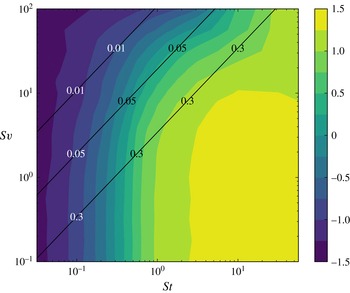
Filled contours of
 $S_{-\Vert }^{p}(r/{\it\eta})/u_{{\it\eta}}$
(a) and
 $S_{2\Vert }^{p}(r/{\it\eta})/u_{{\it\eta}}^{2}$
(b) evaluated at
 $r/{\it\eta}=0.25$
and
 $R_{{\it\lambda}}=227$
for different values of
 $St$
and
 $Sv$
. The contours are logarithmically scaled, and the colour bar labels indicate the exponents of the decade. The diagonal lines denote three different values of
 $Fr$
, corresponding to conditions representative of stratiform clouds (
 $Fr=0.01$
), cumulus clouds (
 $Fr=0.05$
) and cumulonimbus clouds (
 $Fr=0.3$
).

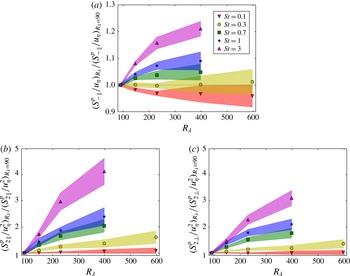
(a)
 $S_{-\Vert }^{p}/u_{{\it\eta}}$
, (b)
 $S_{2\Vert }^{p}/u_{{\it\eta}}^{2}$
and (c)
 $S_{2\bot }^{p}/u_{{\it\eta}}^{2}$
, plotted as a function of
 $R_{{\it\lambda}}$
for various
 $St$
. The relative velocities are shown at
 $r/{\it\eta}=0.25$
and the quantities at a given Reynolds number are divided by their corresponding value at
 $R_{{\it\lambda}}=90$
. Shaded contours denote 95 % confidence intervals. Note that (a) has a much smaller ordinate scale than (b) and (c).

To further verify our arguments in § 4.1.1, it is helpful to decouple the effects of gravity and inertia by varying each independently. We do so in figure 13, where we show
 $S_{-\Vert }^{p}$
and
 $S_{2\Vert }^{p}$
for various
 $St$
and
 $Sv$
. While the results at high
 $Sv$
are likely artificially affected by the periodic boundary conditions (see appendix A), we can still use these data to discuss the qualitative trends in the relative velocities at different values of
 $St$
and
 $Sv$
. We see that
 $S_{-\Vert }^{p}$
and
 $S_{2\Vert }^{p}$
have similar qualitative trends. For
 $Sv\lesssim 10$
, both quantities increase with increasing
 $St$
, either due to preferential sampling effects (at low
 $St$
) or path-history effects (at high
 $St$
). The relative velocities also decrease with increasing
 $Sv$
, since gravity causes both effects to be less significant, as discussed in § 4.1.1. Finally, we observe that the relative velocities are the smallest for the largest values of
 $Sv$
and
 $St\sim 1$
. At smaller
 $St$
, preferential concentration effects are more significant, while at larger
 $St$
, path-history effects are more significant. Both effects lead to an increase in the relative velocities. An implication of these results for clouds is that for a given value of
 $St$
, droplets in stratiform clouds (
 $Fr=0.01$
) will generally have smaller relative velocities than droplets in cumulonimbus clouds (
 $Fr=0.3$
).
We have thus far examined and explained relative velocity statistics for fixed Reynolds numbers. We now consider how these statistics are affected by changes in
 $R_{{\it\lambda}}$
. In figure 14, we show
 $S_{-\Vert }^{p}/u_{{\it\eta}}$
,
 $S_{2\Vert }^{p}/u_{{\it\eta}}^{2}$
and
 $S_{2\bot }^{p}/u_{{\it\eta}}^{2}$
. In Part 1, we noted that
 $S_{2\Vert }^{p}/u_{{\it\eta}}^{2}$
increases weakly with increasing
 $R_{{\it\lambda}}$
in the absence of gravity for
 $0.3\lesssim St\lesssim 1$
, and attributed this trend to the increased scale separation with increasing
 $R_{{\it\lambda}}$
, which causes a few inertial particles to be affected by their memory of increasingly energetic turbulence. (We also suggested that increased intermittency effects at higher Reynolds numbers could contribute to the observed trends.) While we expected the increased scale separation of the turbulence to also increase the relative velocities for higher-
 $St$
particles, we instead found that the relative velocities decreased with increasing
 $R_{{\it\lambda}}$
for
 $1\lesssim St\lesssim 3$
. We argued that this trend was caused by a corresponding decrease in the rotation time scales
 $T_{\unicode[STIX]{x1D619}\unicode[STIX]{x1D619}}^{p}/{\it\tau}_{{\it\eta}}$
, which in turn reduced the influence of path-history effects and decreased the relative velocities. However, with gravity, we find that
 $T_{\unicode[STIX]{x1D619}\unicode[STIX]{x1D619}}^{p}/{\it\tau}_{{\it\eta}}$
is generally independent of
 $R_{{\it\lambda}}$
(see § 3.1), and thus we expect that this allows the increased scale separation of the turbulence to cause
 $S_{2\Vert }^{p}/u_{{\it\eta}}^{2}$
to uniformly increase with increasing
 $R_{{\it\lambda}}$
for
 $St\gtrsim 0.3$
. Our results in figure 14(b) confirm this expectation. We also see that
 $S_{-\Vert }^{p}/u_{{\it\eta}}$
is generally unaffected by changes in
 $R_{{\it\lambda}}$
(figure 14
a), since it is less influenced by the relatively infrequent occurrences of the effects discussed above. We are also interested in the effect of the Reynolds number on the perpendicular relative velocities, since these statistics will also affect the degree of particle clustering (see § 4.2). From figure 14(c), we see that the trends with
 $R_{{\it\lambda}}$
in the perpendicular direction are identical to those in the parallel direction.
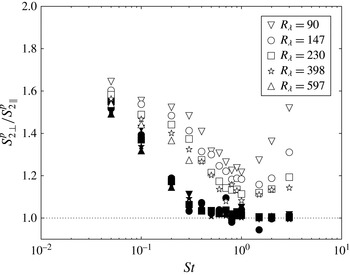
 $S_{2\bot }^{p}/S_{2\Vert }^{p}$
, evaluated at
 $r/{\it\eta}=0.25$
, and plotted as a function of
 $St$
for different values of
 $R_{{\it\lambda}}$
. Open symbols denote the case with gravity (
 $Fr=0.052$
) and the filled symbols denote the case without gravity.

In Part 1, we found that without gravity, the parallel and perpendicular relative velocities became equivalent at small separations for
 $St\gtrsim 0.3$
. The physical explanation is that the path-history contribution to their relative velocities decreases the coherence of the pair motion, and in the ballistic limit where the pairs move independently of each other, the parallel and perpendicular components are equal. However, with gravity, path-history effects are weaker, and thus the parallel and perpendicular velocities may not be the same in this regime.
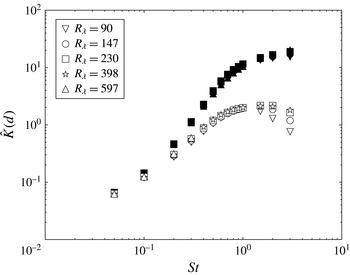
We compare these two quantities in figure 15 by plotting
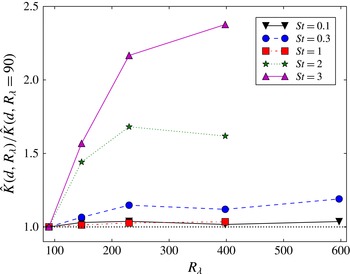
 $S_{2\bot }^{p}/S_{2\Vert }^{p}$
at
 $r/{\it\eta}=0.25$
. We see that both with and without gravity, the ratio
 $S_{2\bot }^{p}/S_{2\Vert }^{p}$
approaches 2 at low Stokes numbers, the value for fluid particles (e.g. see Pope Reference Pope2000). For
 $St\gtrsim 0.3$
without gravity,
 $S_{2\bot }^{p}$
and
 $S_{2\Vert }^{p}$
are equivalent, as expected. At high values of
 $St$
with gravity, however, the parallel and perpendicular components are not equivalent, since path-history effects are weakened by gravity. As
 $R_{{\it\lambda}}$
increases, the particle relative velocities are affected by increasingly energetic turbulence along their path histories. As a result, the relative velocities are larger and the particles move more ballistically, causing the ratio
 $S_{2\bot }^{p}/S_{2\Vert }^{p}$
to decrease with increasing
 $R_{{\it\lambda}}$
.
We now examine the effects of Reynolds number on the scaling of the relative velocities. As in Part 1, we compute the scaling exponents of the mean inward relative velocity (
 ${\it\zeta}_{\Vert }^{-}$
) and the relative velocity variance (
 ${\it\zeta}_{\Vert }^{2}$
) by performing linear least-squares power-law fits over separations
 $0.75\leqslant r/{\it\eta}\leqslant 2.75$
. While the results in figure 11 suggest that the power-law exponent may vary considerably over this range, we are forced to use this relatively large range to gather sufficient statistics at the smaller separations. Thus, while these scaling exponents allow us to assess the trends with
 $R_{{\it\lambda}}$
, they only provide a qualitative understanding, as the scaling varies considerably throughout the dissipation range and this variation is not completely captured by this analysis.
The scaling exponents are shown in figure 16. The trends at a given value of
 $R_{{\it\lambda}}$
are in agreement with our observations from figures 11 and 12, which are explained above. We also see that with gravity, the scaling exponents tend to decrease with increasing
 $R_{{\it\lambda}}$
, since the particles are more influenced by their memory of increasingly energetic turbulence and therefore tend to move ballistically, as noted above.
The scaling exponents of the mean inward relative velocities (a) and relative velocity variances (b) plotted as a function of
 $St$
for different values of
 $R_{{\it\lambda}}$
. The open symbols denote the case with gravity (
 $Fr=0.052$
) and the filled symbols denote the case without gravity. The scaling exponents are computed using linear least-squares regression over the range
 $0.75\leqslant r/{\it\eta}\leqslant 2.75$
.

Angular distributions of
 $S_{-\Vert }^{p}(\boldsymbol{r})/S_{-\Vert }^{p}(r)$
are presented in figure 17 for a range of Stokes numbers,
 $R_{{\it\lambda}}=398$
, and
 $r<{\it\eta}$
. The anisotropy of the distribution is reflected in the colour variation over the surface of the sphere. We see immediately that the asymmetry in the relative velocities follows opposite trends at small and large
 $St$
. That is, at small
 $St$
, the relative velocities are largest for particles separated in the vertical direction, whereas for
 $St\gtrsim 1$
, the opposite is true. The explanation is as follows. At small separations and
 $St\lesssim 0.3$
, particle pairs that are separated vertically will have parallel relative velocities that are proportional to
 $\unicode[STIX]{x1D61A}_{33}(\boldsymbol{x}^{p}(t),t)$
, the longitudinal velocity gradient in the vertical direction as sampled by inertial particles (see § 3.1). Particle pairs that are separated along the horizontal direction, however, will have parallel relative velocities that are proportional to
 $\unicode[STIX]{x1D61A}_{11}(\boldsymbol{x}^{p}(t),t)$
, the longitudinal velocity gradient in the horizontal direction. In § 3.1, we observed that particles tend to preferentially sample flow where the vertical velocity gradients are larger and the horizontal velocity gradients are smaller. As a result, the relative velocities are expected to be larger for particles that are separated in the vertical direction and smaller for particles that are separated in the horizontal directions. At large
 $St$
, however, the relative velocities are smallest for particles that are separated vertically. The physical explanation is that the correlation time scales of the fluid velocity gradients along this direction are the smallest (see § 3.1) and thus the particles have a weaker response to vertical fluid velocity fluctuations and correspondingly lower particle relative velocities along this direction.
The directionally dependent mean inward relative velocity
 $S_{-\Vert }^{p}(\boldsymbol{r})$
, normalized by the spherically averaged mean inward relative velocity
 $S_{-\Vert }^{p}(r)$
, shown on a unit sphere for
 $R_{{\it\lambda}}=398$
and
 $r<{\it\eta}$
with gravity (
 $Fr=0.052$
). The different columns correspond to different values of
 $St$
. (a) Shows the projection where gravity is directed into the page and (b) shows the projection where gravity is directed downward.

The second (a) and fourth (b) spherical harmonic coefficients of
 $S_{-\Vert }^{p}(\boldsymbol{r})$
, normalized by the zeroth spherical harmonic coefficient, plotted as a function of
 $r/{\it\eta}$
for different
 $St$
and
 $R_{{\it\lambda}}$
with gravity (
 $Fr=0.052$
). The different values of
 $St$
considered (
 $0.3$
,
 $0.5$
,
 $1$
,
 $3$
) are shown in black, red, blue and green, respectively, and the Stokes numbers are indicated by the line labels.

Next, we consider the dependence of the anisotropy on the separation distance by plotting the spherical harmonic coefficients of order 2 and 4 as a function of
 $r$
in figure 18. (Coefficients above order 4 are too small to measure accurately and thus are not shown.) We see that the anisotropy in the relative velocities generally decreases with increasing separation. The physical explanation is that with increasing separation distance, the particle motions are increasingly dependent on larger eddies, and the relative velocities induced by these isotropic eddies are increasingly energetic relative to the anisotropic velocities induced by gravity.
For small values of
 $St$
,
 $C_{2}^{0}$
and
 $C_{4}^{0}$
are positive, indicating that the particle relative velocities are strongest for particles that are separated vertically. The opposite is true at large
 $St$
. These observations are in agreement with the trends shown in figure 17. We also see that
 $C_{2}^{0}$
and
 $C_{4}^{0}$
tend to become more isotropic at high
 $St$
and less isotropic at low
 $St$
as
 $R_{{\it\lambda}}$
increases. While the physical explanation for the trend at low
 $St$
is unclear, at high
 $St$
, we expect that this increase in isotropy is linked to the increase in the relative velocities with increasing
 $R_{{\it\lambda}}$
. That is, as the overall relative velocities increase, the anisotropic velocities induced by gravity will be comparatively weaker, and thus the particle relative velocities will be more isotropic.
4.2 Particle clustering
In this section, we consider how gravity affects the inertial particle clustering process. We first provide a theoretical explanation for the clustering (§ 4.2.1) and then compare the predictions to DNS results (§ 4.2.2).
4.2.1 Theoretical framework for particle clustering
We use the angular distribution function
 $g(\boldsymbol{r})$
(hereafter ‘ADF,’ see Gualtieri, Picano & Casciola Reference Gualtieri, Picano and Casciola2009) to quantify the degree and orientation of particle clustering. We define
 $g(\boldsymbol{r})$
as
 $$\begin{eqnarray}g(\boldsymbol{r})\equiv \frac{N(r,{\it\theta},{\it\phi})/V(r,{\it\theta},{\it\phi})}{N/V}.\end{eqnarray}$$
In this equation,
 $N(r,{\it\theta},{\it\phi})$
denotes the number of particle pairs in a truncated spherical cone with nominal radius
 $r$
, polar angle
 ${\it\theta}$
and azimuthal angle
 ${\it\phi}$
. The volume of the truncated spherical cone
 $V(r,{\it\theta},{\it\phi})$
is given by
 $$\begin{eqnarray}V(r,{\it\theta},{\it\phi})\equiv \sin ({\it\theta}){\rm\Delta}{\it\theta}{\rm\Delta}{\it\phi}[(r+{\rm\Delta}r)^{3}-(r-{\rm\Delta}r)^{3}]/3,\end{eqnarray}$$
where
 ${\rm\Delta}r$
is the radial width,
 ${\rm\Delta}{\it\theta}$
is the extent of the polar angle and
 ${\rm\Delta}{\it\phi}$
is the extent of the azimuthal angle.
As discussed in § 4.1.1, the equation governing the relative motion of like particles, (4.1) is the same with and without gravity. Hence the theory of Zaichik & Alipchenkov (Reference Zaichik and Alipchenkov2009), developed without consideration of gravitational settling, is not explicitly changed by the presence of gravity; instead gravity modifies the equation through implicit changes to its coefficients. From Zaichik & Alipchenkov (Reference Zaichik and Alipchenkov2009) (see also Bragg & Collins Reference Bragg and Collins2014a
), the equation describing
 $g(\boldsymbol{r})$
at steady state is
 $$\begin{eqnarray}\mathbf{0}=-St{\it\tau}_{{\it\eta}}\Big(\boldsymbol{S}_{2}^{p}+{\bf\lambda}\Big)\boldsymbol{\cdot }\boldsymbol{{\rm\nabla}}_{\boldsymbol{ r}}g-St{\it\tau}_{{\it\eta}}g\boldsymbol{{\rm\nabla}}_{\boldsymbol{r}}\boldsymbol{\cdot }\boldsymbol{S}_{2}^{p},\end{eqnarray}$$
where
 ${\bf\lambda}$
is the dispersion tensor describing the influence of the fluid velocity difference field on the dispersion of the particles (see Bragg & Collins Reference Bragg and Collins2014a
).
Since
 $\boldsymbol{S}_{2}^{p}$
is anisotropic with gravity (cf. § 4.1.2), so too is the ADF
 $g(\boldsymbol{r})$
, as is evident in (4.12). We similarly adopt an expansion of the ADF in terms of spherical harmonic functions
 $$\begin{eqnarray}g(\boldsymbol{r})=\mathop{\sum }_{\ell =0}^{\infty }\mathscr{C}_{2\ell }^{0}(r)Y_{2\ell }^{0}({\it\theta}),\end{eqnarray}$$
where
 $\mathscr{C}_{2\ell }^{0}$
are the spherical harmonic coefficients for the ADF. We only attempt to model the zeroth-order term, which we denote as
 $$\begin{eqnarray}g(r)=\mathscr{C}_{0}^{0}(r).\end{eqnarray}$$
where
 $Y_{0}^{0}\equiv 1$
. Note that
 $g(r)$
is just the spherical average of the ADF
 $g(\boldsymbol{r})$
, or the equivalent of the radial distribution function (RDF) defined in Part 1. While this approach captures the leading-order contribution of gravity to the ADF, it does not predict the gravity-induced anisotropy. (Note that a similar approach was adopted by Alipchenkov & Beketov (Reference Alipchenkov and Beketov2013) to model particle clustering in a homogeneous turbulent shear flow.) We will assess the accuracy of this approach in § 4.2.2.
We therefore consider the isotropic form of (4.12), which is given as
 $$\begin{eqnarray}0=\underbrace{-St\left({\hat{S}}_{2\Vert }^{p}+\hat{{\it\lambda}}_{\Vert }\right)}_{\equiv \mathfrak{D}}{\rm\nabla}_{\hat{r}}g\underbrace{-St\left({\rm\nabla}_{\hat{r}}{\hat{S}}_{2\Vert }^{p}+2\hat{r}^{-1}\left[{\hat{S}}_{2\Vert }^{p}-{\hat{S}}_{2\bot }^{p}\right]\right)}_{\equiv \mathfrak{d}}g,\end{eqnarray}$$
where
 $\hat{Z}$
denotes a variable
 $Z$
normalized by Kolmogorov scales.
 ${\it\lambda}_{\Vert }$
denotes the projection of the dispersion tensor
 ${\bf\lambda}$
along a direction parallel to the particle separation vector. We note that the first term on the right-hand side is associated with outward diffusion (which acts to reduce the RDF), while the second is associated with an inward drift (which acts to increase the RDF). The corresponding diffusion and drift coefficients are denoted as
 $\mathfrak{D}$
and
 $\mathfrak{d}$
, respectively (see Bragg & Collins Reference Bragg and Collins2014a
).
As explained in Bragg & Collins (Reference Bragg and Collins2014a
), the overall degree of clustering is determined by the relative strength of the drift and diffusion coefficients,
 $\mathfrak{d}/\mathfrak{D}$
. Increases (decreases) in this ratio are associated with increased (decreased) clustering. To understand how gravity affects the clustering, we therefore need to understand its effect upon the ratio
 $\mathfrak{d}/\mathfrak{D}$
.
Bragg & Collins (Reference Bragg and Collins2014a
) demonstrated that in the limit
 $St\ll 1$
,
 $\mathfrak{D}$
and
 $\mathfrak{d}$
simplify to
 $$\begin{eqnarray}\mathfrak{D}\approx -\hat{r}^{2}B_{nl},\end{eqnarray}$$
and
 $$\begin{eqnarray}\mathfrak{d}\approx -St\hat{r}(\langle \hat{\unicode[STIX]{x1D61A}}^{2}\rangle ^{p}-\langle \hat{\unicode[STIX]{x1D619}}^{2}\rangle ^{p})/3,\end{eqnarray}$$
respectively, where
 $B_{nl}$
is the non-local coefficient defined in Chun et al. (Reference Chun, Koch, Rani, Ahluwalia and Collins2005) that is independent of the particle Stokes number. As is evident in (4.16), the diffusion term is independent of the Stokes number – hence
 $\mathfrak{D}$
is unaffected by gravity in this limit. In contrast,
 $\mathfrak{d}$
is proportional to both
 $St$
and
 $\langle \hat{\unicode[STIX]{x1D61A}}^{2}\rangle ^{p}-\langle \hat{\unicode[STIX]{x1D619}}^{2}\rangle ^{p}$
. Gravity reduces the correlation between the particles and the strain and rotation fields, and thereby reduces
 $\mathfrak{d}$
. The net effect of gravity in this limit is therefore to reduce the ratio
 $\mathfrak{d}/\mathfrak{D}$
and the degree of clustering. We also note that at low
 $St$
, the trends in the strain and rotation rates with
 $R_{{\it\lambda}}$
are very weak. Consistent with Part 1, these trends imply the clustering to be nearly independent of
 $R_{{\it\lambda}}$
in the limit
 $St\ll 1$
, with or without gravity.
For inertial particles with intermediate Stokes numbers in the range
 $0.2\lesssim St\lesssim 0.7$
(note that this range is approximate and is likely sensitive to changes in Reynolds number, as mentioned in Part 1), we no longer have simple relationships for the drift and diffusion terms. However, we can still make qualitative predictions for the trends in the clustering based on our physical understanding and the explanations in Bragg & Collins (Reference Bragg and Collins2014a
). Over this range of
 $St$
, Bragg & Collins (Reference Bragg and Collins2014a
) argued that both preferential sampling effects and path-history effects act to increase clustering, with the path-history effects becoming increasingly dominant as
 $St$
increases. Since gravity decreases both preferential sampling and path-history effects, we therefore expect it to reduce clustering over the approximate range of
 $0.2\lesssim St\lesssim 0.7$
.
We next use (4.15) to understand clustering at larger values of
 $St$
. In Part 1, we argued that without gravity,
 ${\hat{S}}_{2\Vert }^{p}\approx {\hat{S}}_{2\bot }^{p}$
for
 $St\gtrsim 0.3$
, and we were thus able to neglect the term
 $2\hat{r}^{-1}({\hat{S}}_{2\Vert }^{p}-{\hat{S}}_{2\bot }^{p})$
in (4.15) at high
 $St$
. However, with gravity, the parallel and perpendicular relative velocity variances are generally not equal (as discussed in § 4.1.2), and hence this term must be retained. We are still able to neglect
 $\hat{{\it\lambda}}_{\Vert }$
at small separations and high
 $St$
, since this term is inversely proportional to
 $St$
and decreases as the time scales of the fluid velocity seen by the particles decrease (see Bragg & Collins Reference Bragg and Collins2014a
).
The simplified form of (4.15) at high
 $St$
is therefore
 $$\begin{eqnarray}0=\underbrace{-St{\hat{S}}_{2\Vert }^{p}}_{\mathfrak{D}}{\rm\nabla}_{\hat{r}}g\underbrace{-St\left({\rm\nabla}_{\hat{r}}{\hat{S}}_{2\Vert }^{p}+2\hat{r}^{-1}\left[{\hat{S}}_{2\Vert }^{p}-{\hat{S}}_{2\bot }^{p}\right]\right)}_{\mathfrak{d}}g.\end{eqnarray}$$
Taking the ratio between the drift and diffusion coefficients gives us
 $$\begin{eqnarray}\frac{\mathfrak{d}}{\mathfrak{D}}=\frac{{\rm\nabla}_{\hat{r}}{\hat{S}}_{2\Vert }^{p}+2\hat{r}^{-1}\left[{\hat{S}}_{2\Vert }^{p}-{\hat{S}}_{2\bot }^{p}\right]}{{\hat{S}}_{2\Vert }^{p}}=\frac{1}{\hat{r}}\left({\it\zeta}_{\Vert }^{2}+2-2{\hat{S}}_{2\bot }^{p}/{\hat{S}}_{2\Vert }^{p}\right),\end{eqnarray}$$
where
 ${\it\zeta}_{\Vert }^{2}$
is the scaling exponent of the parallel relative velocity variance (see § 4.1.2).
From § 4.1.2, we see that with gravity,
 ${\it\zeta}_{\Vert }^{2}$
increases very strongly, while
 $2{\hat{S}}_{2\bot }^{p}/{\hat{S}}_{2\Vert }^{p}$
increases weakly. We expect that
 ${\it\zeta}_{\Vert }^{2}-2{\hat{S}}_{2\bot }^{p}/{\hat{S}}_{2\Vert }^{p}$
will therefore increase with gravity, leading to an increase in the clustering at high
 $St$
. We attribute these trends to the fact that gravity reduces the influence of path-history effects on particle relative motion in the dissipation range at high
 $St$
. Path-history effects primarily act to diminish clustering for
 $St\gtrsim 1$
(see Bragg & Collins Reference Bragg and Collins2014a
), and thus gravity reduces their influence and therefore acts to increase
 $g(\hat{r})$
. We emphasize that this does not necessarily imply that gravity increases the inward drift and decreases the outward diffusion. In fact, our data indicate that gravity decreases both
 $\mathfrak{d}$
and
 $\mathfrak{D}$
. The reduction in
 $\mathfrak{D}$
with gravity, however, is stronger than the corresponding reduction in
 $\mathfrak{d}$
, causing the ratio
 $\mathfrak{d}/\mathfrak{D}$
, and therefore the clustering strength, to increase. We also see from § 4.1.2 that increasing
 $R_{{\it\lambda}}$
, with gravity, generally leads to a decrease in both
 ${\it\zeta}_{\Vert }^{2}$
and
 ${\hat{S}}_{2\bot }^{p}/{\hat{S}}_{2\Vert }^{p}$
, due to the increased influence of path-history effects on particle relative motion at higher Reynolds numbers. While both quantities seem to be decreased by about the same amount with increasing
 $R_{{\it\lambda}}$
, the latter quantity has a greater effect on the clustering since it is multiplied by a factor of two in (4.19). This explains why
 $\mathfrak{d}/\mathfrak{D}$
decreases as
 $R_{{\it\lambda}}$
increases, leading to a decrease in the clustering.
In summary, gravity reduces clustering at low and intermediate values of
 $St$
, but increases clustering at high values of
 $St$
. Gravity reduces both preferential sampling and path-history effects. Preferential sampling effects increase clustering at low values of
 $St$
, and thus gravity reduces clustering by weakening the preferential sampling drift mechanism. At intermediate values of
 $St$
, both preferential sampling and path-history effects act to increase clustering, and thus gravity, by weakening both effects, reduces clustering. At higher values of
 $St$
, path-history effects act to diminish clustering, and gravity increases clustering by decreasing path-history effects.
This explanation is consistent with arguments put forth by Franklin et al. (Reference Franklin, Vaillancourt and Yau2007), Ayala et al. (Reference Ayala, Rosa, Wang and Grabowski2008), Onishi et al. (Reference Onishi, Takahashi and Komori2009), Woittiez et al. (Reference Woittiez, Jonker and Portela2009), Rosa et al. (Reference Rosa, Parishani, Ayala, Grabowski and Wang2013) for low-Stokes-number particles. However, at higher Stokes numbers, several of these authors argued that gravity facilitates interactions with large-scale turbulent eddies, which in turn leads to increased particle clustering (Franklin et al. Reference Franklin, Vaillancourt and Yau2007; Woittiez et al. Reference Woittiez, Jonker and Portela2009; Rosa et al. Reference Rosa, Parishani, Ayala, Grabowski and Wang2013), an hypothesis stated without supporting data, theory or a physical argument. In contrast, we argue that gravity reduces the temporal correlation radius over which the particles are affected by their path-history interactions with the turbulence, and therefore causes the particle relative motion in the dissipation range to be less affected by their interaction with larger-scale turbulence. Our hypothesis is supported by our DNS results for the relative velocities (§ 4.1.2) and also by the extension of the theoretical model of Zaichik & Alipchenkov (Reference Zaichik and Alipchenkov2009) shown above. We will show in § 4.2.2 that this model is able to reproduce the DNS clustering results very well.
Another recent paper by Park & Lee (Reference Park and Lee2014) suggests the increase in particle clustering with gravity at high Stokes numbers is linked to the skewness of the vertical velocity gradients of the underlying fluid. This proposed explanation, however, seems to be flawed, and we suggest that their finding reflects a certain correlation in the system, but not a causal relation. This conclusion is supported by the recent work of Gustavsson et al. (Reference Gustavsson, Vajedi and Mehlig2014), who observed qualitatively similarly strong clustering of high-Stokes-number particles in the presence of gravity in their random Gaussian flow field, whose fluid velocity, by definition, has no skewness.
Instantaneous particle locations in
 $1000{\it\eta}\times 1000{\it\eta}\times 10{\it\eta}$
slices of the domain for different values of
 $St$
(0.3 (a,d), 1 (b,e), 3 (c,f)) and
 $R_{{\it\lambda}}=398$
. Panels (a–c) are for the case without gravity, and (d–f) are for the case with gravity (
 $Fr=0.052$
), with the gravitational vector pointing downward.

4.2.2 Particle clustering results
We begin by first examining instantaneous snapshots of particle positions in the simulations in figure 19. From these visualizations, it is evident that gravity alters both the degree and orientation of the clusters and generally causes them to be aligned with the gravity vector. Recall that the clustering observed at
 $St\gtrsim 1$
is not related to the Maxey centrifuge mechanism (Maxey Reference Maxey1987), but rather is due to the history effect (Bragg & Collins Reference Bragg and Collins2014a
; Bragg, Ireland & Collins Reference Bragg, Ireland and Collins2015a
,Reference Bragg, Ireland and Collins
b
). This explains why higher-Stokes-number particles show signs of clustering even though they nearly uniformly sample the strain and rotation fields (cf. figure 2).
To quantify the clustering, we first consider the spherically averaged RDFs
 $g(r)$
to analyse the overall effect of gravity on the degree of clustering. Figure 20 shows plots of the RDFs both with gravity (
 $Fr=0.052$
) and without gravity. The results show gravity causes the RDFs to decrease at low
 $St$
and to increase at high
 $St$
, in agreement with our arguments in § 4.2.1 and earlier findings (Franklin et al.
Reference Franklin, Vaillancourt and Yau2007; Ayala et al.
Reference Ayala, Rosa, Wang and Grabowski2008; Onishi et al.
Reference Onishi, Takahashi and Komori2009; Woittiez et al.
Reference Woittiez, Jonker and Portela2009; Rosa et al.
Reference Rosa, Parishani, Ayala, Grabowski and Wang2013; Bec et al.
Reference Bec, Homann and Ray2014; Gustavsson et al.
Reference Gustavsson, Vajedi and Mehlig2014). For sufficiently large separations, the RDFs with and without gravity approach each other.
DNS (symbols) and theoretical (‘ZT’, lines) data for the RDFs
 $g$
plotted as a function of
 $r/{\it\eta}$
at
 $R_{{\it\lambda}}=398$
both with gravity (open symbols and solid lines) and without gravity (filled symbols and dashed lines). (a) Shows RDFs for
 $St=0.3$
, and (b) for
 $St=3$
. The theoretical predictions are calculated from the equations in Zaichik & Alipchenkov (Reference Zaichik and Alipchenkov2009) with the non-local correction from Bragg & Collins (Reference Bragg and Collins2014a
), using our DNS data to specify
 $T_{\unicode[STIX]{x1D61A}\unicode[STIX]{x1D61A}}^{p}$
,
 $S_{2\Vert }^{p}$
and
 $S_{2\bot }^{p}$
.

To test the theory in § 4.2.1, we compute
 $g(r)$
from (4.15) using the relative velocity statistics
 $S_{2\Vert }^{p}$
and
 $S_{2\bot }^{p}$
obtained from DNS. In addition, we use the directionally averaged strain time scales
 $T_{\unicode[STIX]{x1D61A}\unicode[STIX]{x1D61A}}^{p}$
from the DNS (see § 3.1) and the non-local closure proposed in Bragg & Collins (Reference Bragg and Collins2014a
) to compute the dispersion tensor. This allows us to test the formulation of (4.15) and the theoretical arguments in § 4.2.1. Figure 20 shows that the theory captures the quantitative results in the DNS well, indicating that (4.15) is an accurate model even for an anisotropic particle phase, and thus verifies the physical explanations presented in § 4.2.1.
Next, we consider the dependence of the RDFs on
 $R_{{\it\lambda}}$
in figure 21. As was the case without gravity (see Part 1), the RDFs are largely independent of
 $R_{{\it\lambda}}$
for
 $St\lesssim 1$
with gravity. This is in agreement with our arguments in § 4.2.1 and implies that small-
 $St$
clustering is a small-scale phenomenon (both with and without gravity) that is generally unaffected by the intermittency of the turbulence. For
 $St>1$
the RDFs generally increase with increasing
 $R_{{\it\lambda}}$
, since the ratio between the drift and diffusion increases, as discussed in § 4.2.1. The RDFs seem to approach a constant value, however, suggesting that any Reynolds-number dependencies may eventually saturate in the limit
 $R_{{\it\lambda}}\rightarrow \infty$
.
The normalized RDFs at
 $r/{\it\eta}=0.25$
with gravity (
 $Fr=0.052$
), plotted as a function of
 $R_{{\it\lambda}}$
. The RDFs at a given Reynolds number are normalized by their corresponding value at
 $R_{{\it\lambda}}=90$
to highlight the Reynolds-number dependence. Shaded contours denote 95 % confidence intervals for the RDFs.

We can also quantify the degree of small-scale clustering by performing a power-law fit of the RDFs (Reade & Collins Reference Reade and Collins2000) at small separations,
 $$\begin{eqnarray}g(r)\approx c_{0}\left(\frac{{\it\eta}}{r}\right)^{c_{1}},\end{eqnarray}$$
as discussed in Part 1. The power-law fits are performed over the range
 $0.75\leqslant r/{\it\eta}\leqslant 2.75$
, and the calculated values of
 $c_{0}$
and
 $c_{1}$
are plotted in figure 22. We observe that both the power-law coefficient
 $c_{0}$
and the exponent
 $c_{1}$
decrease when gravity is introduced for
 $St\lesssim 1.5$
and increase when gravity is introduced for
 $St\gtrsim 1.5$
, consistent with our explanations in § 4.2.1. The theoretical model for
 $g(r/{\it\eta})$
from (4.15) (with the relative velocities and strain time scales specified from the DNS) is in good agreement with the DNS data, both with and without gravity. We also note that our DNS results for the exponent
 $c_{1}$
agree well with those of Rosa et al. (Reference Rosa, Parishani, Ayala, Grabowski and Wang2013) and Bec et al. (Reference Bec, Homann and Ray2014) (not shown).
The (a) prefactor
 $c_{0}$
and the (b) exponent
 $c_{1}$
of the power-law fits of the RDFs using (4.20). Open symbols denote data with gravity (
 $Fr=0.052$
) and filled symbols denote data without gravity. The predictions from Zaichik & Alipchenkov (Reference Zaichik and Alipchenkov2009) for
 $R_{{\it\lambda}}=398$
(‘ZT’, where DNS data are used to specify the relative velocities and the strain time scales here) are shown with solid lines (gravity) and dashed lines (no gravity). The theoretical high-
 $St$
predictions from Fouxon et al. (Reference Fouxon, Park, Harduf and Lee2015) (‘FT’) for
 $R_{{\it\lambda}}=398$
are also included in (b).

Filled contours of the RDF evaluated at
 $r/{\it\eta}=0.25$
(a) and
 $r/{\it\eta}=9.75$
(b) for different values of
 $St$
and
 $Sv$
, for
 $R_{{\it\lambda}}=227$
. The diagonal lines denote three different values of
 $Fr$
, corresponding to conditions representative of stratiform clouds (
 $Fr=0.01$
), cumulus clouds (
 $Fr=0.05$
) and cumulonimbus clouds (
 $Fr=0.3$
).

In Fouxon et al. (Reference Fouxon, Park, Harduf and Lee2015), the authors state that
 $c_{1}$
should be independent of
 $St$
for large
 $St$
and small
 $Fr$
. This is generally consistent with our DNS results for
 $St\gtrsim 1$
in figure 22(b). They also argue that
 $c_{1}$
can be determined entirely from the fluid field as
 $$\begin{eqnarray}c_{1}=\frac{3{\rm\pi}}{4}Fr\frac{\displaystyle \int _{0}^{\infty }{\it\kappa}E({\it\kappa})\,\text{d}{\it\kappa}}{a_{{\it\eta}}}.\end{eqnarray}$$
We include comparisons between our DNS results and the theoretical predictions of Fouxon et al. (Reference Fouxon, Park, Harduf and Lee2015) in figure 22(b). We see that (4.21) predicts
 $c_{1}$
to within about 50 % at high
 $St$
. The model from (4.15), however, gives much more accurate quantitative predictions, but does require the second-order structure functions and the Lagrangian time scales for the inertial particles from the DNS.
To further investigate the two-parameter space of particle inertia and gravity, we consider the RDFs at
 $R_{{\it\lambda}}=227$
for various
 $St$
and
 $Sv$
in figure 23. While the particle clustering behaviour here is generally complex and varies strongly with
 $St$
and
 $Sv$
, we are able to provide physical explanations for several of the observed trends. For
 $St\gg 1$
, the RDFs generally decrease with increasing
 $St$
, since the particles become unresponsive to almost all of the underlying turbulence, as expected. Also, for
 $St\lesssim 1$
, the RDFs tend to decrease with increasing
 $Sv$
, since the preferential sampling and path-history mechanisms both act to increase clustering here, and they are both reduced by gravity. We also see that for
 $1<St<10$
, the RDFs generally increase with increasing
 $Sv$
, as expected, since gravity increases the ratio between the drift and the diffusion, as discussed in § 4.2.1.
We now investigate the anisotropy of the particle field by introducing higher-order spherical harmonic functions,
 $$\begin{eqnarray}\frac{g(\boldsymbol{r})}{g(r)}=\mathop{\sum }_{\ell =1}^{\infty }\frac{\mathscr{C}_{2\ell }^{0}(r)}{\mathscr{C}_{0}^{0}(r)}Y_{2\ell }^{0}({\it\theta}),\end{eqnarray}$$
in figure 24 for various values of
 $St$
with gravity (
 $Fr=0.052$
) at
 $R_{{\it\lambda}}=398$
.
The ADF
 $g(\boldsymbol{r})$
(normalized by the RDF
 $g(r)$
) shown on a unit sphere for
 $R_{{\it\lambda}}=398$
and separations
 $r<{\it\eta}$
with gravity (
 $Fr=0.052$
). The different columns correspond to different values of
 $St$
. (a) Shows the projection where gravity is directed into the page and (b) shows the projection where gravity is directed downward.

Consistent with the qualitative observations from figure 19, we see that particle clustering is strongest along the vertical direction, in agreement with earlier findings of Dejoan & Monchaux (Reference Dejoan and Monchaux2013), Bec et al. (Reference Bec, Homann and Ray2014) and Park & Lee (Reference Park and Lee2014). At low
 $St$
, the anisotropic clustering is caused by the fact that particles tend to preferentially sample downward-moving flow (see § 3.2). Bec et al. (Reference Bec, Homann and Ray2014) showed that this preferential sampling causes particles to form vertical clusters when
 $St$
is small.
When
 $St$
is large, the effects of preferential sampling vanish, and the anisotropy is related to the way gravity influences the path-history effect. Since the analysis presented in § 4.2.1 is restricted to spherically averaged clustering, the results cannot be used to predict the trends in anisotropy. However, we expect that the clustering anisotropy is linked to both the anisotropy in the relative velocities (see § 4.1.2) and the anisotropy in the strain and rotation time scales (see § 3.1). That is, directional variations in the relative velocities and the strain and rotation time scales will lead to directional variations in the ratio between drift and diffusion. This in turn will cause the particle clustering to be anisotropic. Indeed, the recent paper of Fouxon et al. (Reference Fouxon, Park, Harduf and Lee2015) argues that vertical clusters form at high
 $St$
with gravity because the velocities of particle pairs have different correlation times in the horizontal and vertical directions. We hope that this and similar theories can be further developed and tested by using the anisotropic strain and rotation time scale results presented in § 3.1.
We also note that the anisotropy increases with increasing
 $St$
. The physical explanation is that as
 $St$
(and thus
 $Sv$
) increases, gravitational forces become more significant, causing the particle motion to be more anisotropic. However, we expect that at some sufficiently large values of
 $St$
and
 $Sv$
, the particles are unaffected by the fluid turbulence, and thus clustering (and the associated anisotropy) will vanish.
We explore the degree of anisotropy as a function of the separation distance
 $r$
and the Reynolds number by plotting the spherical harmonic coefficients
 $\mathscr{C}_{2}^{0}$
and
 $\mathscr{C}_{4}^{0}$
in figure 25 (coefficients above order four are too small to be statistically significant, and hence are not shown). In agreement with figure 19, we see that the anisotropy increases with increasing
 $St$
. We also observe that as
 $r/{\it\eta}$
increases, the anisotropy approaches zero, since both the clustering and the clustering anisotropy vanish in the limit
 $r/{\it\eta}\rightarrow \infty$
.
The second (a) and fourth (b) spherical harmonic coefficients of the angular distribution function normalized by the zeroth spherical harmonic coefficient, plotted as a function of
 $r/{\it\eta}$
, for different
 $St$
and
 $R_{{\it\lambda}}$
with gravity (
 $Fr=0.052$
). The different values of
 $St$
considered (
 $0.3$
,
 $0.5$
,
 $1$
,
 $3$
) are shown in black, red, blue and green, respectively, and the Stokes numbers are indicated by the line labels.

The degree of anisotropy is also Reynolds-number dependent and decreases with increasing
 $R_{{\it\lambda}}$
for larger values of
 $St$
. Since the relative velocities of high-
 $St$
particles generally also tend to become more isotropic as
 $R_{{\it\lambda}}$
increases (see § 4.1.2), it is likely that the reduction in the anisotropy of the relative velocities will cause a similar reduction in the anisotropy of the clustering.
4.3 Particle collision kernels
The final two-particle statistic we consider is the kinematic collision kernel
 $K$
for inertial particles. Sundaram & Collins (Reference Sundaram and Collins1997) and Wang, Wexler & Zhou (Reference Wang, Wexler and Zhou2000) showed that for an isotropic particle field,
 $K$
is given by
 $$\begin{eqnarray}K(d)=4{\rm\pi}d^{2}g(d)S_{-\Vert }^{p}(d),\end{eqnarray}$$
where
 $d$
is the particle diameter. In appendix C, we show mathematically that (4.23) holds even for an anisotropic particle field. As in Part 1, we plot the non-dimensional collision kernel
 $\hat{K}(d)=K(d)/(d^{2}u_{{\it\eta}})$
in figure 26 (see also Voßkuhle et al.
Reference Voßkuhle, Pumir, Lévêque and Wilkinson2014). Note that while we simulate only point particles, we define
 $d$
from
 $St$
for this plot by prescribing the density ratio to be
 ${\it\rho}_{p}/{\it\rho}_{f}=1000$
. Since our statistics are generally not sufficient to compute the RDFs and relative velocities at separations of the order of the particle diameter, we fit both quantities using linear least-squares power-law regression and extrapolate the resulting power-law fits to
 $r=d$
(refer to Rosa et al.
Reference Rosa, Parishani, Ayala, Grabowski and Wang2013).
The non-dimensional collision kernel
 $\hat{K}(d)$
plotted as a function of
 $St$
for
 ${\it\rho}_{p}/{\it\rho}_{f}=1000$
and different values of
 $R_{{\it\lambda}}$
. The open symbols denote data with gravity (
 $Fr=0.052$
), and the filled symbols denote data without gravity.

Figure 26 shows the dimensionless collision kernel, with and without gravity, as a function of the Stokes number. Notice that the collision kernel is reduced by gravity. At low
 $St$
, the RDF and the relative velocity both decrease with gravity, thereby decreasing the collision kernel. At higher
 $St$
, the reduction in the relative velocity with gravity (see § 4.1.2) is sufficient to compensate for the slight increase in the RDF with gravity (see § 4.2.2), sustaining the net reduction in the collision kernel.
We next consider the dependence of the collision kernels on the Reynolds number. To make any dependencies more obvious, we divide the collision kernel at a given Reynolds number by the corresponding value at
 $R_{{\it\lambda}}=90$
and plot the results in figure 27. At low
 $St$
, we see almost no Reynolds-number dependence, since both the mean inward relative velocities (§ 4.1.2) and the RDFs (§ 4.2.2) are mostly independent of
 $R_{{\it\lambda}}$
here. For
 $St>1$
, the collision rates increase with increasing
 $R_{{\it\lambda}}$
, since both the relative velocity and RDF increase with increasing Reynolds number.
The ratio between
 $\hat{K}(d)$
at a given value of
 $R_{{\it\lambda}}$
to that at
 $R_{{\it\lambda}}=90$
, to highlight the Reynolds-number dependence. All data are with gravity (
 $Fr=0.052$
) and for
 ${\it\rho}_{p}/{\it\rho}_{f}=1000$
.

We found in Part 1 that
 $\hat{K}(d)$
without gravity is nearly independent of
 ${\it\rho}_{p}/{\it\rho}_{f}$
for
 $St\gtrsim 1$
, in agreement with Voßkuhle et al. (Reference Voßkuhle, Pumir, Lévêque and Wilkinson2014). The physical explanation is that
 $g(d)$
and
 $S_{-\Vert }^{p}(d)/u_{{\it\eta}}$
are either independent of
 $d$
(for
 $St\geqslant 10$
) or have inverse power-law scalings with
 $d$
that precisely cancel (for
 $1\lesssim St\leqslant 3$
). In contrast, with gravity, path-history effects are suppressed, and these quantities have different scaling behaviours (see §§ 4.1.2 and 4.2.2). We therefore find that with gravity,
 $\hat{K}(d)$
decreases with increasing
 ${\it\rho}_{p}/{\it\rho}_{f}$
at all values of
 $St$
considered, as shown in figure 28.
The non-dimensional collision kernel
 $\hat{K}(d)$
plotted as a function of
 $St$
for different values of
 ${\it\rho}_{p}/{\it\rho}_{f}$
and
 $R_{{\it\lambda}}=398$
. All data are with gravity. Filled red symbols indicate
 ${\it\rho}_{p}/{\it\rho}_{f}=250$
, open symbols indicate
 ${\it\rho}_{p}/{\it\rho}_{f}=1000$
and filled blue symbols indicate
 ${\it\rho}_{p}/{\it\rho}_{f}=4000$
.

Next, we expand our parameter space to consider the collision kernel for a wide range of
 $St$
and
 $Sv$
in figure 29. Here, we limit our analysis to cases where
 ${\it\rho}_{p}/{\it\rho}_{f}=1000$
. Once again, we caution that the statistics at the highest values of
 $St$
and
 $Sv$
may be affected by the periodic boundary conditions in the vertical direction (see appendix A), the use of a linear drag model (cf. § 2.2) and the extrapolations based on power-law fits that become questionable for
 $St>3$
. Nevertheless, the contour plot shown in figure 29 captures the qualitative trends of the collision kernel. In agreement with the discussion above, we see that the collision kernel generally increases with increasing
 $St$
and decreases with increasing gravity. A practical implication is that at a given value of
 $St$
, cumulonimbus clouds (
 $Fr\approx 0.3$
) will have more frequent droplet collisions and growth than stratiform clouds (
 $Fr\approx 0.01$
).
Filled contours of
 $\hat{K}(d)$
for different values of
 $St$
and
 $Sv$
at
 $R_{{\it\lambda}}=227$
for
 ${\it\rho}_{p}/{\it\rho}_{f}=1000$
. The contours are logarithmically scaled, and the colour bar labels indicate the exponents of the decade. The diagonal lines denote three different values of
 $Fr$
, corresponding to conditions representative of stratiform clouds (
 $Fr=0.01$
), cumulus clouds (
 $Fr=0.05$
) and cumulonimbus clouds (
 $Fr=0.3$
).

We now consider the anisotropic collision kernel,
 $K(r,{\it\theta},{\it\phi})$
, defined as
 $$\begin{eqnarray}K(d,{\it\theta},{\it\phi})\equiv 4{\rm\pi}r^{2}g(d,{\it\theta},{\it\phi})S_{-\Vert }^{p}(d,{\it\theta},{\it\phi}).\end{eqnarray}$$
 $K(d,{\it\theta},{\it\phi})$
provides a measure of the rate at which particles with diameter
 $d$
collide along an orientation defined by the radial angle
 ${\it\theta}$
and azimuthal angle
 ${\it\phi}$
. We plot the ratio between
 $K(d,{\it\theta},{\it\phi})$
and its spherical average in figure 30. (We are unable to show the anisotropic collision kernel at
 $r=d$
due to inadequate statistics at these small separations. We instead show data at
 $0\leqslant r<{\it\eta}$
, the smallest separation range over which adequate statistics are available.)
The anisotropic collision kernel
 $K(r,{\it\theta},{\it\phi})$
(normalized by the spherical average
 $K(r)$
) shown on a unit sphere for
 $R_{{\it\lambda}}=398$
and separations
 $r<{\it\eta}$
with gravity (
 $Fr=0.052$
). The different columns correspond to different values of
 $St$
. (a) Shows the projection where gravity is directed into the page, and (b) shows the projection where gravity is directed downward.

At low
 $St$
, the collision kernel is approximately isotropic, since gravitational effects are weak. Interestingly, the collision kernel also tends toward isotropy at large
 $St$
, due to the opposing trends in anisotropy of the relative velocities (see figure 17) and ADFs (see figure 24). For
 $St$
between
 $0.1$
and
 $1$
, particles are more likely to collide along the vertical direction, since both the ADFs and the relative velocities are strongest in the vertical direction for these values of
 $St$
.
Before closing this section, we emphasize two practical implications of these collision results for the cloud physics community. The first is that since the DNS indicates that the collision rates of particles with low and moderate
 $St$
are independent of
 $R_{{\it\lambda}}$
, it is likely that the collision kernels computed here will be useful for predicting droplet collisions in high-Reynolds-number atmospheric clouds. The second is that gravity significantly reduces the collision kernels for
 $St\gtrsim 0.1$
, which implies that simulations without gravity can significantly overpredict the collision rates of droplets in atmospheric clouds, and highlights the need to include gravity in the analysis of collisional droplet growth in turbulent clouds.
5 Conclusions
In this study, we explored the influence of gravity on inertial particle statistics in isotropic turbulence, with the goal of understanding the turbulence mechanisms contributing to droplet collisions. Our simulations were performed over the largest Reynolds-number range (
 $90\leqslant R_{{\it\lambda}}\leqslant 597$
), domain lengths (
 $\mathscr{L}/\ell \lesssim 40$
) and range of particle classes (
 $0\leqslant St\leqslant 56.2$
,
 $0\leqslant Sv\leqslant 100$
) to date. We showed that such large domain sizes are essential to obtain accurate statistics of settling inertial particles, suggesting that earlier published DNS studies may have errors due to the periodic boundary conditions in the vertical direction (see appendix A).
Our results indicate that preferential sampling affects the dynamics of particles with
 $St\ll 1$
, both with and without gravity. Gravity decreases the degree of preferential sampling by reducing the time the particles have to interact with the underlying turbulent fields. In particular, gravity reduces the Lagrangian time scales for strain and rotation along particle trajectories. As gravitational forces increase, the particles fall more rapidly through the flow, leading to smaller velocities and larger accelerations than in the case without gravity. We developed models for the Lagrangian strain and rotation time scales along particle trajectories and the particle acceleration variances that are valid in the limit
 $Sv\gg u^{\prime }/u_{{\it\eta}}$
. The model predictions are in reasonable agreement with the DNS in this limit. We also find that the mean settling velocity is independent of
 $R_{{\it\lambda}}$
at low
 $St$
, in agreement with Bec et al. (Reference Bec, Homann and Ray2014).
We then applied this understanding of the gravity effect on single-particle statistics to two-particle statistics relevant for predicting the collision kernel. At high
 $St$
, we observed that gravity reduces the particle relative velocities from their values without gravity by reducing the path-history effect. At low
 $St$
, gravity acts primarily to reduce the degree of preferential sampling, causing the relative velocities at small separations to be closer to those of fluid particles.
Next, we relate the trends in the relative velocities to those in the particle clustering by considering the effect of gravity on a derivative model of the theoretical work of Zaichik & Alipchenkov (Reference Zaichik and Alipchenkov2009). With gravitational effects included, the model is able to predict the spherically averaged RDFs very accurately when DNS data is used to prescribe the relative velocities and the Lagrangian strain time scales. By analysing the model at low
 $St$
, we see that the primary effect of gravity is to decrease the inward drift, leading to a decrease in the RDFs. At higher
 $St$
, in contrast, gravity modulates both the inward drift and outward diffusion by diminishing the path-history effect in such a way as to increase the drift-to-diffusion ratio, causing an increase in clustering with gravity. We also find that the degree of clustering is only weakly dependent on
 $R_{{\it\lambda}}$
at low
 $St$
, but becomes increasingly sensitive to
 $R_{{\it\lambda}}$
at higher
 $St$
. The model captures both of these trends through its internal description of the path-history effects.
We also quantify the degree of anisotropy in these two-particle statistics using a spherical harmonic decomposition. Our results indicate that the particle angular distribution functions and radial relative velocities can have anisotropies of the order of 25 %, with the degree of anisotropy generally peaking at small
 $r/{\it\eta}$
. At larger separations, the relative velocities induced by turbulence become comparatively larger, limiting the effect of gravity on particle dynamics.
We used these data for the RDFs and relative velocities to compute the particle collision kernel. As in Part 1, we find that the collision kernel is generally independent of
 $R_{{\it\lambda}}$
at low
 $St$
, while it increases with increasing
 $R_{{\it\lambda}}$
at high
 $St$
. We analyse the collision kernel using spherical harmonic decompositions, and find that the collision kernel is generally more isotropic than the ADFs and the mean inward relative velocities, since the anisotropies in the ADFs and the relative velocities have opposing trends at large
 $St$
.
We conclude by highlighting some practical implications of this work for the cloud physics and turbulence communities and suggesting promising research directions. As in Part 1, the fact that the collision rates are generally independent of
 $R_{{\it\lambda}}$
for droplet sizes representative of those in warm, cumulus clouds suggests that the collision rates predicted here (for
 $R_{{\it\lambda}}\lesssim 600$
) may be representative of those found in atmospheric clouds (
 $R_{{\it\lambda}}\sim 10\,000$
). Of course, more simulations at even higher Reynolds numbers would help to verify this conjecture, as would accurate experimental or atmospheric measurements. Also, as noted in § 4.3, we observed that collision rates with gravity are considerably lower than without gravity, suggesting that earlier work that neglected gravity may have overpredicted the collision kernels.
While our study has focused on like-sized particles, our results suggest that gravity will have a significant effect on the collision kernels of unlike (different-sized) particles. For example, we observe that gravity tends to enhance the settling speeds of particles with low and intermediate values of
 $St$
. The coupling between turbulence and gravity may thereby increase the relative velocities of unlike particles, leading to more frequent collisions. In addition, we find that gravity causes inertial particles in turbulence to experience large accelerations. Chun et al. (Reference Chun, Koch, Rani, Ahluwalia and Collins2005) found that large accelerations can contribute to higher relative velocities between unlike particles, leading to higher collision frequencies.
Finally, one especially promising finding of this study is that by extending the model of Zaichik & Alipchenkov (Reference Zaichik and Alipchenkov2009) and using DNS data to specify the Lagrangian strain time scales and relative velocities, we are able to accurately predict the RDFs both without gravity (as was also found in Bragg & Collins Reference Bragg and Collins2014a
) and with gravity. As noted in Bragg & Collins (Reference Bragg and Collins2014b
), however, this model provides poor predictions of the relative velocities of particles with moderate-to-large inertia. Future work should therefore be directed at improving these relative velocity predictions, and at introducing nonlinear drag effects into both the theoretical models and future DNS simulations. In addition, while we developed a model for the strain and rotation time scales in the limit of large
 $St$
with gravity, we generally require a model for all values of
 $St$
. If accurate models can be developed for the relative velocities and the strain and rotation time scales over the entire range of
 $St$
in atmospheric clouds, we would be able to use the theory of Zaichik & Alipchenkov (Reference Zaichik and Alipchenkov2009) to model the collision kernel accurately, both with and without gravity, without requiring any inputs from DNS.
Acknowledgements
The authors gratefully acknowledge G. Good, S. Pope and P. Sukheswalla for many helpful discussions. The work was supported by the National Science Foundation through CBET grants 0756510 and 0967349, and through a graduate research fellowship to P.J.I. Additional funding was provided by Cornell University. Computational simulations were performed on Yellowstone (ark:/85065/d7wd3xhc) at the US National Center for Atmospheric Research (Computational and Information Systems Laboratory 2012) under grants ACOR0001 and P35091057, and on resources at the Max Planck Institute for Dynamics and Self-Organization. We are grateful to D. Flieger for assistance with the computational resources at the Max Planck Institute.
Appendix A. Periodicity effects
As noted in Woittiez et al. (Reference Woittiez, Jonker and Portela2009), particle statistics in DNS may be artificially influenced by the periodicity of the domain when gravitational forces are strong. In particular, Woittiez et al. (Reference Woittiez, Jonker and Portela2009) estimated that periodicity effects become significant when the time it takes a particle to fall through the domain (
 ${\sim}\mathscr{L}{\it\tau}_{p}^{-1}\mathfrak{g}^{-1}$
) is less than the large eddy turnover time
 $T_{L}\equiv \ell /u^{\prime }$
, or equivalently, when
 $$\begin{eqnarray}Sv=\frac{St}{Fr}\gtrsim \frac{\mathscr{L}}{\ell }\frac{u^{\prime }}{u_{{\it\eta}}}.\end{eqnarray}$$
In this case, a particle can artificially encounter the same large eddy multiple times due to the finite domain length. We define
 $St_{crit}$
as the value of
 $St$
at which
 $St/Fr=\mathscr{L}u^{\prime }/(\ell u_{{\it\eta}})$
. This roughly corresponds to the largest Stokes number at which we can expect the results to be unaffected by periodicity.
To study the effects of periodicity, we systematically increased the domain size for the cases at the three lowest Reynolds numbers, while keeping the large scales, small scales and the forcing parameters the same. The simulation parameters are summarized in table 3. For convenience, we will hereafter refer to the simulations from groups I, II and III by their nominal Reynolds numbers of
 $R_{{\it\lambda}}\approx 90$
,
 $147$
and
 $230$
, respectively. In all cases,
 $0\leqslant St\leqslant 3$
and
 $Fr=0.052$
.
Simulation parameters for the periodicity study.

The resulting energy spectra are shown in figure 31. In all cases, forcing is applied deterministically to wavenumbers with magnitude
 ${\it\kappa}=\sqrt{2}$
, and thus the location of the peak in the spectra is approximately the same for all domain sizes. The spectra are nearly identical to the right of the peak, indicating that the inertial and dissipation range flow scales remain unchanged. We notice that as the domain size increases, larger-scale (i.e. lower-wavenumber) flow features become present. These features, however, account for very little of the overall energy, and thus they do not significantly affect the fluid statistics.
Energy spectra for different domain lengths
 $\mathscr{L}$
and nominal Reynolds numbers
 $R_{{\it\lambda}}=90$
(a),
 $R_{{\it\lambda}}=147$
(b) and
 $R_{{\it\lambda}}=230$
(c). All values are in arbitrary units.

We first consider the effect of the domain size on the strain and rotation rates along particle trajectories.
 $\langle \unicode[STIX]{x1D61A}^{2}\rangle ^{p}$
and
 $\langle \unicode[STIX]{x1D619}^{2}\rangle ^{p}$
(not shown) are generally invariant with changes in the domain size, since they are small-scale single-time quantities. The Lagrangian strain and rotation time scales in figure 32, however, appear to be overpredicted on the smaller domain sizes at large
 $St$
. The explanation is that these time scales involve integrals of the autocorrelations of the strain and rotation components (see (3.1)), and artificially high correlations can result when a particle is wrapped around a domain boundary, increasing the time scales. At the highest values of
 $St$
, our results suggest that the strain and rotation time scales have not yet converged to a grid-independent result, even though our scaling argument in (A 1) indicates that the Stokes numbers considered are generally well below
 $St_{crit}$
. Since these time scales are very small (
 ${\sim}0.1{\it\tau}_{{\it\eta}}$
), their values can be significantly affected by very weak correlations induced by periodicity, and thus extremely large domain sizes may be necessary for these artificial correlations to vanish. We also see that our DNS time scales are considerably larger than the theoretical predictions from § B.1. While part of this discrepancy at large
 $St$
is due to periodicity effects, it is also possible that the theory in § B.2 requires larger values of
 $Sv$
than we are able to simulate here.
The Lagrangian strain (open symbols) and rotation (filled symbols) time scales for different domain lengths
 $\mathscr{L}$
and nominal Reynolds numbers
 $R_{{\it\lambda}}=90$
(a),
 $R_{{\it\lambda}}=147$
(b) and
 $R_{{\it\lambda}}=230$
(c). The theoretical predictions for the strain and rotation time scales for
 $Sv\gg u^{\prime }/u_{{\it\eta}}$
are shown with solid and dashed lines, respectively.

We next discuss the effect of periodicity on velocity and acceleration statistics. The turbulence-induced changes in the mean particle settling speeds (not shown) are generally independent of the domain size. This is presumably because the turbulence-induced settling speed modifications of large-
 $St$
particles (which experience the strongest periodicity effects) are negligible, and thus the domain periodicity will not lead to significant changes in this statistic. It is possible, however, that the settling speeds with a nonlinear drag model (which are reduced at large
 $St$
, see Good et al. (Reference Good, Ireland, Bewley, Bodenschatz, Collins and Warhaft2014)) will be affected by the domain size.
We show acceleration variance statistics in figure 33. The acceleration variances are underpredicted at the smallest domain sizes, and converge to the theoretical predictions at high
 $St$
(see § B.2) as the domain size is increased. The vertical acceleration variances are more affected by the periodic boundary conditions than the horizontal acceleration variances, since the vertical velocities are correlated over longer length scales (as explained in § 3.3).
DNS data for
 $\langle a_{1}^{2}\rangle ^{p}/a_{{\it\eta}}^{2}$
(filled symbols) and
 $\langle a_{3}^{2}\rangle ^{p}/a_{{\it\eta}}^{2}$
(open symbols) for different domain lengths
 $\mathscr{L}$
and nominal Reynolds numbers
 $R_{{\it\lambda}}=90$
(a),
 $R_{{\it\lambda}}=147$
(b) and
 $R_{{\it\lambda}}=230$
(c). The theoretical predictions for the horizontal (B 11) and vertical (B 12) acceleration variances for
 $Sv\gg u^{\prime }/u_{{\it\eta}}$
are shown with dashed and solid lines, respectively.

We conclude this section by examining the relative velocity statistics and the RDFs. Figures 34 and 35 show the mean inward relative velocities and relative velocity variances, respectively. These statistics are only weakly sensitive to the domain size for all
 $St$
and converge to a grid-independent result. The relative velocity variances appear to be slightly more sensitive to the domain size than the mean inward relative velocities, presumably because the former are higher-order statistics and are thus sensitive to larger and more intermittent flow features.
The mean inward relative velocities (normalized by
 $u_{{\it\eta}}$
) for different domain lengths
 $\mathscr{L}$
for nominal Reynolds numbers
 $R_{{\it\lambda}}=90$
(a),
 $R_{{\it\lambda}}=147$
(b), and
 $R_{{\it\lambda}}=230$
(c). The different Stokes numbers considered (
 $St=0.3,1,2,3$
) are shown in black, red, blue and green, respectively, and the Stokes numbers are indicated by the line labels.

The parallel relative velocity variances (normalized by
 $u_{{\it\eta}}^{2}$
) for different domain lengths
 $\mathscr{L}$
for nominal Reynolds numbers
 $R_{{\it\lambda}}=90$
(a),
 $R_{{\it\lambda}}=147$
(b) and
 $R_{{\it\lambda}}=230$
(c). The different Stokes numbers considered (
 $St=0.3,1,2,3$
) are shown in black, red, blue and green, respectively, and the Stokes numbers are indicated by the line labels.

Figure 36 indicates that the RDFs are almost entirely unaffected by the finite domain sizes at low
 $St$
. At
 $St=3$
(figure 37), however, the RDFs are evidently quite sensitive to the domain size, and do not converge to a grid-independent result. It is possible that these RDFs are influenced by the small fraction of larger-scale features which appear as grid size is increased (see figure 31), or that the scaling argument in (A 1) is not sufficiently stringent for the RDF statistics. In any case, the results at large
 $St$
should be interpreted with caution, since the linear drag model and the point-particle approximation are less accurate here (see § 2.2).
RDFs for different domain lengths
 $\mathscr{L}$
for nominal Reynolds numbers
 $R_{{\it\lambda}}=90$
(a),
 $R_{{\it\lambda}}=147$
(b) and
 $R_{{\it\lambda}}=230$
(c). Data are shown for
 $St\leqslant 1$
, with the Stokes numbers indicated by the line labels. The different Stokes numbers considered (
 $St=0.1,0.3,0.5,0.7,1$
) are shown in black, red, blue, green and magenta, respectively, and the Stokes numbers are indicated by the line labels.

RDFs for different domain lengths
 $\mathscr{L}$
for nominal Reynolds numbers
 $R_{{\it\lambda}}=90$
(a),
 $R_{{\it\lambda}}=147$
(b) and
 $R_{{\it\lambda}}=230$
(c). Data are shown for
 $St=3$
.

Appendix B. Theoretical models in the strong-gravity limit
In this section, we derive theoretical models that are expected to be valid in the limit of strong gravitational forces. We require two conditions for these models to hold. First, particles must fall so quickly that the spatial decorrelation of the turbulence along their trajectories occurs much faster than the Eulerian time scale of the flow. Second, a particle’s displacement over a time
 $s$
is to leading order equal to
 ${\it\tau}_{p}\mathfrak{g}s$
.
Estimated atmospheric cloud conditions at which our strong-gravity time scale model is expected to hold.

The conditions can be shown to be satisfied when
 $Sv\gg u^{\prime }/u_{{\it\eta}}$
. It is important to note that
 $u^{\prime }/u_{{\it\eta}}\sim R_{{\it\lambda}}^{1/2}$
in isotropic turbulence, which implies that our models will only hold for very large droplets (i.e. very large values of
 $Sv$
) in high-Reynolds-number atmospheric clouds. In table 4, we provide an estimate of the droplet diameters
 $d$
at which our model is expected to be valid for three different cloud types: stratiform clouds (
 ${\it\epsilon}\sim 10^{-3}~\text{m}^{2}~\text{s}^{-3}$
), cumulus clouds (
 ${\it\epsilon}\sim 10^{-2}~\text{m}^{2}~\text{s}^{-3}$
) and cumulonimbus clouds (
 ${\it\epsilon}\sim 10^{-1}~\text{m}^{2}~\text{s}^{-3}$
).
From table 4, we see that the droplet diameters at which these models are expected to be valid (of the order of hundreds to thousands of microns) are well above those of droplets in the ‘size gap’ in atmospheric clouds (between about 30 and
 $80~{\rm\mu}\text{m}$
– see Part 1), where turbulence is expected to play a key role in droplet growth. However, while the models are not expected to yield accurate predictions of droplet dynamics in the size gap, they provide an important asymptotic limit in which to understand heavy-particle motion. Furthermore, since the Reynolds numbers in our simulations are well below those in atmospheric clouds, we expect the models to agree well with our simulation data at the largest values of
 $Sv$
.
In § B.1, we develop a model for the Lagrangian strain and rotation time scales of the flow seen by inertial particles and in § B.2, we model the particle accelerations.
B.1 Lagrangian strain and rotation time scales along particle trajectories
In the limit
 $Sv\gg u^{\prime }/u_{{\it\eta}}$
, we can model the Lagrangian strain time scale
 $T_{\unicode[STIX]{x1D61A}_{ij}\unicode[STIX]{x1D61A}_{km}}^{p}$
as
 $$\begin{eqnarray}T_{\unicode[STIX]{x1D61A}_{ij}\unicode[STIX]{x1D61A}_{km}}^{p}=\frac{1}{\langle \unicode[STIX]{x1D61A}_{ij}(\mathbf{0},0)\unicode[STIX]{x1D61A}_{km}(\mathbf{0},0)\rangle }\int _{0}^{\infty }\int _{\boldsymbol{X}}\langle \unicode[STIX]{x1D61A}_{ij}(\boldsymbol{X},s)\unicode[STIX]{x1D61A}_{km}(\mathbf{0},0)\rangle {\it\varrho}(\boldsymbol{X},s)\,\text{d}\boldsymbol{X}\,\text{d}s,\end{eqnarray}$$
where
 ${\it\varrho}(\boldsymbol{X},s)\equiv {\it\delta}(\boldsymbol{X}-{\it\tau}_{p}\boldsymbol{\mathfrak{g}}s)$
. Here and through the rest of this section, no summation is implied by repeated indices in the time scale expressions.
Note that (B 1) is constructed by assuming that the turbulence evaluated along the particle trajectories is uncorrelated with the trajectory itself (i.e. ‘Corrsin’s hypothesis’, see Corrsin Reference Corrsin1963). In the limit
 $Sv\gg u^{\prime }/u_{{\it\eta}}$
, Corrsin’s hypothesis is expected to become exact, since the particle motions are almost independent of the underlying flow field here.
Taking the integral of (B 1), we obtain
 $$\begin{eqnarray}T_{\unicode[STIX]{x1D61A}_{ij}\unicode[STIX]{x1D61A}_{km}}^{p}=\frac{1}{\langle \unicode[STIX]{x1D61A}_{ij}(\mathbf{0},0)\unicode[STIX]{x1D61A}_{km}(\mathbf{0},0)\rangle }\int _{0}^{\infty }\langle \unicode[STIX]{x1D61A}_{ij}({\it\tau}_{p}\boldsymbol{\mathfrak{g}}s,0)\unicode[STIX]{x1D61A}_{km}(\mathbf{0},0)\rangle \,\text{d}s.\end{eqnarray}$$
To derive an analytical expression for the time scales, we assume that
 $\langle \unicode[STIX]{x1D61A}_{ij}({\it\tau}_{p}\boldsymbol{\mathfrak{g}}s,0)\unicode[STIX]{x1D61A}_{km}(\mathbf{0},0)\rangle$
decorrelates exponentially, which gives us
 $$\begin{eqnarray}T_{\unicode[STIX]{x1D61A}_{ij}\unicode[STIX]{x1D61A}_{km}}^{p}=\ell _{\unicode[STIX]{x1D61A}_{ij}\unicode[STIX]{x1D61A}_{km},3}/({\it\tau}_{p}\mathfrak{g}).\end{eqnarray}$$
Here,
 $\ell _{\unicode[STIX]{x1D61A}_{ij}\unicode[STIX]{x1D61A}_{km},3}$
is the integral length scale of
 $\unicode[STIX]{x1D61A}_{ij}\unicode[STIX]{x1D61A}_{km}$
evaluated along the
 $x_{3}$
-direction. We express (B 3) in non-dimensional form,
 $$\begin{eqnarray}\hat{T}_{\unicode[STIX]{x1D61A}_{ij}\unicode[STIX]{x1D61A}_{km}}^{p}=\frac{\hat{\ell }_{\unicode[STIX]{x1D61A}_{ij}\unicode[STIX]{x1D61A}_{km},3}}{Sv},\end{eqnarray}$$
where we have used the top-hat symbol to denote a variable normalized by Kolmogorov scales. The rotation time scales
 $T_{\unicode[STIX]{x1D619}_{ij}\unicode[STIX]{x1D619}_{km}}^{p}$
are defined analogously,
 $$\begin{eqnarray}\hat{T}_{\unicode[STIX]{x1D619}_{ij}\unicode[STIX]{x1D619}_{km}}^{p}=\frac{\hat{\ell }_{\unicode[STIX]{x1D619}_{ij}\unicode[STIX]{x1D619}_{km},3}}{Sv}.\end{eqnarray}$$
B.2 Inertial particle acceleration variances
We now develop a model for the particle acceleration variances in the limit
 $Sv\gg u^{\prime }/u_{{\it\eta}}$
. Following Bec et al. (Reference Bec, Biferale, Boffetta, Celani, Cencini, Lanotte, Musacchio and Toschi2006), we write the formal solution for the particle acceleration as
 $$\begin{eqnarray}\boldsymbol{a}^{p}(t)=\frac{1}{{\it\tau}_{p}^{2}}\int _{-\infty }^{t}\exp \left[\frac{s-t}{{\it\tau}_{p}}\right]\left[\boldsymbol{u}(\boldsymbol{x}^{p}(t),t)-\boldsymbol{u}(\boldsymbol{x}^{p}(s),s)\right]\,\text{d}s.\end{eqnarray}$$
Without loss of generality, we take
 $t=0$
and write the particle acceleration covariance tensor
 $\langle \boldsymbol{a}^{p}(0)\boldsymbol{a}^{p}(0)\rangle$
as
 $$\begin{eqnarray}\displaystyle \langle \boldsymbol{a}^{p}(0)\boldsymbol{a}^{p}(0)\rangle & = & \displaystyle \frac{1}{{\it\tau}_{p}^{4}}\left\langle \!\boldsymbol{u}(\boldsymbol{x}^{p}(0),0)\boldsymbol{u}(\boldsymbol{x}^{p}(0),0)\int _{-\infty }^{0}\int _{-\infty }^{0}\exp \!\left[\frac{s}{{\it\tau}_{p}}\right]\exp \!\left[\frac{S}{{\it\tau}_{p}}\right]\,\text{d}s\,\text{d}S\!\right\rangle \nonumber\\ \displaystyle & & \displaystyle -\,\frac{2}{{\it\tau}_{p}^{4}}\left\langle \!\boldsymbol{u}(\boldsymbol{x}^{p}(0),0)\int _{-\infty }^{0}\int _{-\infty }^{0}\exp \!\left[\frac{s}{{\it\tau}_{p}}\right]\exp \!\left[\frac{S}{{\it\tau}_{p}}\right]\boldsymbol{u}(\boldsymbol{x}^{p}(s),s)\,\text{d}s\,\text{d}S\!\right\rangle \nonumber\\ \displaystyle & & \displaystyle +\,\frac{1}{{\it\tau}_{p}^{4}}\left\langle \int _{-\infty }^{0}\int _{-\infty }^{0}\exp \!\left[\frac{s}{{\it\tau}_{p}}\right]\exp \!\left[\frac{S}{{\it\tau}_{p}}\right]\boldsymbol{u}(\boldsymbol{x}^{p}(s),s)\boldsymbol{u}(\boldsymbol{x}^{p}(S),S)\,\text{d}s\,\text{d}S\!\right\rangle \!.\qquad\end{eqnarray}$$
By assuming that preferential concentration effects are weak, we can approximate the first term on the right-hand side of (B 7) as
 $$\begin{eqnarray}{\it\tau}_{p}^{-2}\langle \boldsymbol{u}(\boldsymbol{x}^{p}(0),0)\boldsymbol{u}(\boldsymbol{x}^{p}(0),0)\rangle \approx \frac{u^{\prime 2}}{{\it\tau}_{p}^{2}}\boldsymbol{I}.\end{eqnarray}$$
Based on PDF theory (Reeks Reference Reeks1993), the second term on the right-hand side of (B 7) is equivalent to the particle velocity covariance multiplied by
 $-2{\it\tau}_{p}^{-2}$
, while the third term equivalent to the particle velocity covariance multiplied by
 ${\it\tau}_{p}^{-2}$
.
For
 $Sv\gg u^{\prime }/u_{{\it\eta}}$
, we can simplify the relations for the velocity covariances presented in Wang & Stock (Reference Wang and Stock1993) to obtain
 $$\begin{eqnarray}\frac{\langle v_{1}^{p}(t)v_{1}^{p}(t)\rangle }{u^{\prime 2}}=\frac{2+StSv({\it\eta}/\ell )}{2[1+StSv({\it\eta}/\ell )]^{2}},\end{eqnarray}$$
and
 $$\begin{eqnarray}\frac{\langle v_{3}^{p}(t)v_{3}^{p}(t)\rangle }{u^{\prime 2}}=\frac{1}{1+StSv({\it\eta}/\ell )}.\end{eqnarray}$$
From these relations, we write the horizontal and vertical particle acceleration variances as
 $$\begin{eqnarray}\frac{\langle a_{1}^{2}\rangle ^{p}}{a_{{\it\eta}}^{2}}=\left[\frac{u^{\prime }}{u_{{\it\eta}}}\right]^{2}\left[\frac{Sv}{St}\right]\left[\frac{2StSv+3\left(\displaystyle \frac{\ell }{{\it\eta}}\right)}{2\left(StSv+\displaystyle \frac{\ell }{{\it\eta}}\right)^{2}}\right],\end{eqnarray}$$
and
 $$\begin{eqnarray}\frac{\langle a_{3}^{2}\rangle ^{p}}{a_{{\it\eta}}^{2}}=\left[\frac{u^{\prime }}{u_{{\it\eta}}}\right]^{2}\left[\frac{Sv}{St}\right]\left[\frac{1}{StSv+\displaystyle \frac{\ell }{{\it\eta}}}\right],\end{eqnarray}$$
respectively.
Appendix C. Kinematic collision kernel for an anisotropic particle phase
In this section, we extend the derivation of Sundaram & Collins (Reference Sundaram and Collins1997) to determine the kinematic collision kernel formulation for an anisotropic particle phase. From Sundaram & Collins (Reference Sundaram and Collins1997), we write the average number of collisions per unit volume over a time period
 ${\it\tau}$
as
 $$\begin{eqnarray}Z_{c}({\it\tau})=\frac{n^{2}}{2}\int _{\boldsymbol{w}}\int _{\boldsymbol{r}}\unicode[STIX]{x1D731}(\boldsymbol{r},\boldsymbol{w},{\it\tau})p(\boldsymbol{r},\boldsymbol{w})\,\text{d}\boldsymbol{r}\,\text{d}\boldsymbol{w},\end{eqnarray}$$
where
 $n$
is the particle number density,
 $\unicode[STIX]{x1D731}(\boldsymbol{r},\boldsymbol{w},{\it\tau})$
is the collision operator and
 $p(\boldsymbol{r},\boldsymbol{w})$
is the joint PDF of the particle-pair separation and relative velocity. At this stage, it is simpler to leave the PDF as is rather than split it into a conditional average and the RDF as was done in Sundaram & Collins (Reference Sundaram and Collins1997). The collision kernel is given as
 $$\begin{eqnarray}K(d)=\frac{2}{n^{2}}\lim _{{\it\tau}\rightarrow 0}\frac{Z_{c}({\it\tau})}{{\it\tau}}=\frac{2}{n^{2}}\frac{\text{d}}{\text{d}{\it\tau}}Z_{c}(0),\end{eqnarray}$$
or equivalently,
 $$\begin{eqnarray}\displaystyle K(d) & = & \displaystyle \int _{\boldsymbol{w}}\int _{\boldsymbol{r}}-\frac{\boldsymbol{r}\boldsymbol{\cdot }\boldsymbol{w}}{r(0)}H(t^{\ast }){\it\delta}[d-r(0)]p(\boldsymbol{r},\boldsymbol{w})\,\text{d}\boldsymbol{r}\,\text{d}\boldsymbol{w}\nonumber\\ \displaystyle & = & \displaystyle \int _{\boldsymbol{r}}-H(t^{\ast }){\it\delta}[d-r(0)]\frac{\boldsymbol{r}}{r(0)}\boldsymbol{\cdot }\int _{\boldsymbol{w}}\boldsymbol{w}p(\boldsymbol{r},\boldsymbol{w})\,\text{d}\boldsymbol{w}\,\text{d}\boldsymbol{r}\nonumber\\ \displaystyle & = & \displaystyle \int _{\boldsymbol{r}}-H(t^{\ast }){\it\delta}[d-r(0)]\frac{\boldsymbol{r}}{r(0)}\boldsymbol{\cdot }{\it\varrho}\langle \boldsymbol{w}^{p}(t)\rangle _{\boldsymbol{ r}}\,\text{d}\boldsymbol{r}.\end{eqnarray}$$
In the above equations,
 $t^{\ast }$
denotes the time required to reach the minimum particle separation,
 $H$
is the Heaviside function,
 ${\it\delta}$
is the Dirac delta function and
 ${\it\varrho}$
is the particle-pair PDF.
From the definition of
 $t^{\ast }$
in Sundaram & Collins (Reference Sundaram and Collins1997), we require
 $\boldsymbol{r}\boldsymbol{\cdot }\boldsymbol{w}\leqslant 0$
for
 $H(t^{\ast })\geqslant 0$
. Since
 $$\begin{eqnarray}\boldsymbol{r}\boldsymbol{\cdot }\langle \boldsymbol{w}^{p}(t)\rangle _{\boldsymbol{ r}}\equiv \langle \boldsymbol{r}^{p}(t)\boldsymbol{\cdot }\boldsymbol{w}^{p}(t)\rangle _{\boldsymbol{ r}},\end{eqnarray}$$
then in order to satisfy
 $H(t^{\ast })\geqslant 0$
, we replace
 $$\begin{eqnarray}\frac{\boldsymbol{r}}{r(0)}\boldsymbol{\cdot }{\it\varrho}\langle \boldsymbol{w}^{p}(t)\rangle _{\boldsymbol{ r}},\end{eqnarray}$$
with
 $$\begin{eqnarray}-\frac{\boldsymbol{r}}{r(0)}\boldsymbol{\cdot }{\it\varrho}\langle \boldsymbol{w}^{p-}(t)\rangle _{\boldsymbol{ r}},\end{eqnarray}$$
where
 $$\begin{eqnarray}{\it\varrho}\langle \boldsymbol{w}^{p-}(t)\rangle _{\boldsymbol{ r}}\equiv -\int _{-\boldsymbol{\infty }}^{\mathbf{0}}\boldsymbol{w}p(\boldsymbol{r},\boldsymbol{w})\,\text{d}\boldsymbol{w}.\end{eqnarray}$$
Furthermore, since
 $$\begin{eqnarray}\frac{\boldsymbol{r}}{r(0)}\boldsymbol{\cdot }{\it\varrho}\langle \boldsymbol{w}^{p-}(t)\rangle _{\boldsymbol{ r}}=\frac{1}{r(0)}{\it\varrho}\langle \boldsymbol{r}^{p}(t)\boldsymbol{\cdot }\boldsymbol{w}^{p-}(t)\rangle _{\boldsymbol{ r}}=\frac{r}{r(0)}{\it\varrho}S_{-\Vert }^{p}(\boldsymbol{r}),\end{eqnarray}$$
and we are considering the limit
 ${\it\tau}\rightarrow 0$
(in which
 $r(0)\rightarrow r$
), we have
 $$\begin{eqnarray}K(d)=\int _{\boldsymbol{r}}{\it\delta}[d-r]{\it\varrho}S_{-\Vert }^{p}(\boldsymbol{r})\,\text{d}\boldsymbol{r}.\end{eqnarray}$$
Since we are interested in collisions on a sphere, we write (C 9) in spherical coordinates by replacing
 $\boldsymbol{r}$
with
 $(r,{\it\theta},{\it\phi})$
and
 $d\boldsymbol{r}$
with
 $r^{2}\sin {\it\theta}\,\text{d}r\,\text{d}{\it\theta}\,\text{d}{\it\phi}$
. This gives us
 $$\begin{eqnarray}\displaystyle K(d) & = & \displaystyle \int _{r}\int _{0}^{2{\rm\pi}}\int _{0}^{{\rm\pi}}{\it\delta}[d-r]{\it\varrho}S_{-\Vert }^{p}(r,{\it\theta},{\it\phi})r^{2}\sin {\it\theta}\,\text{d}{\it\theta}\,\text{d}{\it\phi}\nonumber\\ \displaystyle & = & \displaystyle d^{2}\int _{0}^{2{\rm\pi}}\int _{0}^{{\rm\pi}}g(d,{\it\theta},{\it\phi})S_{-\Vert }^{p}(d,{\it\theta},{\it\phi})\sin {\it\theta}\,\text{d}{\it\theta}\,\text{d}{\it\phi}.\end{eqnarray}$$
For an isotropic particle phase, we recover the expected result,
 $$\begin{eqnarray}K(d)=4{\rm\pi}d^{2}g(d)S_{-\Vert }^{p}(d),\end{eqnarray}$$
where
 $$\begin{eqnarray}g(d)=\frac{1}{4{\rm\pi}}\int _{0}^{2{\rm\pi}}\int _{0}^{{\rm\pi}}g(d,{\it\theta},{\it\phi})\sin {\it\theta}\,\text{d}{\it\theta}\,\text{d}{\it\phi},\end{eqnarray}$$
and
 $$\begin{eqnarray}S_{-\Vert }^{p}(d)=\frac{1}{4{\rm\pi}}\int _{0}^{2{\rm\pi}}\int _{0}^{{\rm\pi}}S_{-\Vert }^{p}(d,{\it\theta},{\it\phi})\sin {\it\theta}\,\text{d}{\it\theta}\,\text{d}{\it\phi}.\end{eqnarray}$$
For an anisotropic particle phase, however, (C 13) no longer holds. Note that
 $S_{-\Vert }^{p}(d)$
is an average over particle pairs on the entire surface of the sphere, while
 $S_{-\Vert }^{p}(d,{\it\theta},{\it\phi})$
is an average over particle pairs on a differential element of the sphere. When the particle phase is anisotropic, we must compute
 $S_{-\Vert }^{p}(d)$
by weighting each of the averages on the differential elements
 $S_{-\Vert }^{p}(d,{\it\theta},{\it\phi})$
by the number of particle pairs contributing to that average. In this case, we have
 $$\begin{eqnarray}S_{-\Vert }^{p}(d)=\frac{1}{4{\rm\pi}}\int _{0}^{2{\rm\pi}}\int _{0}^{{\rm\pi}}S_{-\Vert }^{p}(d,{\it\theta},{\it\phi})\frac{g(d,{\it\theta},{\it\phi})}{g(d)}\sin {\it\theta}\,\text{d}{\it\theta}\,\text{d}{\it\phi},\end{eqnarray}$$
which reduces to (C 13) for an isotropic particle phase. From (C 14), we can therefore show that
 $$\begin{eqnarray}4{\rm\pi}d^{2}g(d)S_{-\Vert }^{p}(d)=d^{2}\int _{0}^{2{\rm\pi}}\int _{0}^{{\rm\pi}}g(d,{\it\theta},{\it\phi})S_{-\Vert }^{p}(d,{\it\theta},{\it\phi})\sin {\it\theta}\,\text{d}{\it\theta}\,\text{d}{\it\phi},\end{eqnarray}$$
which is precisely the result we derived in (C 10) for the anisotropic collision kernel. We have therefore demonstrated mathematically that (C 11) holds for both isotropic and anisotropic particle phases. This explains the empirical observations in Ayala et al. (Reference Ayala, Rosa, Wang and Grabowski2008), from which the authors argue that (C 11) holds even when the particle distribution is anisotropic.