


1. Introduction
The two fundamental units of a snow cover are the snow grain and the snow layer. Various definitions have been proposed for snow grains, though none is universally accepted. On the other hand, snow layers, while rarely explicitly defined, seem in practice to be easily identified. Consistent with geologic usage (AGI, 1960), a reasonable definition might be: a tabular body of snow marked by well-defined boundaries above (younger) and below (older), having characteristics that distinguish it from the surrounding strata due to unique deposition and post-deposition processes. The definition hinges on the fact that the microstructure (grain-size, shape, and arrangement and nature of bonds) differs from one layer to another, inextricably linking layers and grains.
The layer concept is simple, but real snow layers can be complex. Under natural conditions they exhibit irregular boundaries and a wide range of grain and bond characteristics when traced laterally. This heterogeneity is widely recognized but has rarely been quantified or discussed. Moreover, in the absence of comprehensive data indicating whether snow stratigraphy should be thought of as fundamentally regular or irregular, two contradictory views have been adopted. In one view, layers are assumed to be well behaved and laterally homogeneous, the perfect basis for spatial extrapolation of snow-cover properties. In the other view, layers are assumed to vary so much as to make cross-correlation over distances of kilometers, perhaps even as little as hundreds of meters, nearly impossible. The truth lies somewhere between.
The purpose of this paper is to understand the spatial heterogeneity of layers. We have approached the problem by collecting stratigraphic data at several scales, then using the data to investigate layer variability as a function of scale and setting. Our data come from the perennial snow covers of Greenland and Antarctica and the seasonal snow cover of arctic Alaska, U.S.A. These snow covers look remarkably similar at the surface, with wind-sculpted sastrugi and snow dunes. Indeed, the similarity extends below the surface as well, with seasonal snow layers in arctic Alaska closely resembling the layers in the uppermost annual unit of the Greenland and Antarctic ice sheets. The similarity simplifies the comparisons, but there are differences in layer heterogeneity that are great enough to deserve comment and from which we can draw some general conclusions about snow-layer heterogeneity. In all cases, we have focused on relatively flat-lying layers in order to make it easier to recognize similarities and differences in heterogeneity.
2. The Sources of Layer Heterogeneity
Layering is the result of variations and pauses in snow deposition that lead to differences in snow characteristics. Layering can be altered, sometimes emphasized, sometimes destroyed, by subsequent metamorphism. Local and regional variations in weather (wind, temperature, snowfall rate, solar radiation), both during and after deposition, interact with heterogeneity in the depositional environment (slope, aspect and nature of the substrate, presence or absence of vegetation, etc.) to produce the variations. The agents producing layer heterogeneity can be divided into those that work within the snow cover and those that are essentially external or environmental in nature. A subdivision based on this division is shown in Table 1. It suggests that there should be greater heterogeneity for seasonal snow layers than for perennial snow layers, since fewer agents act on the perennial snow.
A simplified subdivision of the sources of snow-layer heterogeneity (see text)
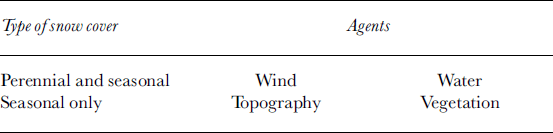
The chief agents of layer heterogeneity are wind, which produces drifts, and temperature, which when it reaches the melting point produces water that percolates into the snow and generates ice columns and lenses. There are other agents including temperature gradients, gravitational settlement, wind pumping and snow-grain crystal kinematics. These, however, produce relatively minor amounts of layer heterogeneity in comparison to wind drifting and water percolation. The chief landscape agents are topography and vegetation, which are often linked, and both of which affect the micrometeorology of the near-snow surface.
Perennial in this context denotes the predominantly flat-lying snow covers found on large glaciers, ice caps and ice sheets in Antarctica and central Greenland where layers form annual units that accumulate indefinitely. In those locations snow settles evenly on surfaces that are relatively flat. Wind conditions tend to be uniform, and storms track over the landscape in a fairly regular manner. In the Alps, in other high mountains and on smaller ice caps, it is possible to find perennial snow that is heavily impacted by topographic effects and irregular winds and weather, but these areas are only a small fraction of the worldwide area covered by perennial snow. One caveat we discuss later: even though the ice caps seem flat and unaffected by surface topography, in fact they are not.
3. Data
We begin by examining a series of stratigraphic profiles collected from the tundra snow of arctic Alaska between 1989 and 2002 (see Reference Benson and SturmBenson and Sturm, 1993; Reference Sturm, Holmgren and ListonSturm and others, 1995). The data span distances ranging from 10m in length to 4200 km. Next, we compare the layer heterogeneity demonstrated in these Alaskan seasonal examples to the heterogeneity of perennial snow layers from Byrd Station, Antarctica, and from central Greenland. In all cases, pit and trench profiles were measured using standard protocols (Reference BensonBenson, 1962; Reference ColbeckColbeck and others, 1990), with the addition that, up to the 100m scale, layer cross-sections have been precisely mapped by establishing a level datum (a taut cord) and a horizontal coordinate system (a tape measure). Unless otherwise noted, profiles depict layer boundaries accurate to ±1cm. Unfortunately, for many types of snow covers like maritime or alpine snow, few long profiles and few if any nested-scale stratigraphic data are available, so here we are at best able to draw only preliminary inferences.
The reason for the dearth of data is that the collection of stratigraphic information is laborious, requiring the excavation of a set of closely spaced snow pits or long snow trenches. Perhaps in the future, radar, penetrometers or other geophysical methods will replace digging, but until then our understanding of layer behavior is likely to remain rudimentary, with comprehensive conclusions awaiting the availability of more extensive data from a wider variety of snow environments.
4. Results
4.1. Heterogeneity of arctic snow layers
Figure 1 shows a 10m long profile from a trench cut into the tundra snow cover north of the Brooks Range in Alaska (68°37’N, 149°18’W). The profile crosses three small frozen puddles on the relatively level floor of Imnavait Creek. There are several salient layer characteristics:
A 10 m long snow stratigraphic profile from a near-level area of arctic tundra at Imnavait Creek, Alaska (68°37’N, 149°18’W), 26 March 1989. Symbols for snow in this and all other figures are from The International Classification for Seasonal Snow on the Ground (Colbeck and others, 1993). Layer geometry was surveyed to ±1cm.

They are not level, despite a nearly level base. They are also not planar, but in most cases (six out of nine layers) they are laterally continuous.
They undulate in a way that mimics the microtopography of the tundra, with the largest variations in layer thickness at the base of the pack, and the smallest near (though not at) the surface. In a nearby snow trench that had fewer layers, from the bottom to the top of the snowpack, the coefficient of variation in the layer thickness was in the ratio of 4 :2:1, suggesting that the impact of the tundra microtopography on layer geometry died out with height in a regular manner.
They exhibit distinct variations in snow texture over distances of a few meters. This lateral variation in texture is most developed in layers that have been subjected to reworking by the wind.
Metamorphic textures (in this case, depth hoar) are prevalent, but in general are relatively uniform along layers and may have even reduced the heterogeneity. One notable exception is that in locations where a lens of softer snow has been deposited in a wind slab, the soft snow has subsequently metamorphosed into depth hoar, producing a laterally discontinuous snow texture.
Figure 2 shows the stratigraphy from 21 snow pits, each >1m wide, excavated at 5 m intervals at Imnavait Creek. The profile depicts the layer heterogeneity at the 100m scale. Vertical exaggeration makes it look like the pits were dug in an area with significant topography, but in fact the area was flat and level. In general, the cross-section looks similar to the 10 m cross-section (Fig. 1) despite an order-of-magnitude increase in horizontal scale. However, there are two key differences: (1) the lateral continuity of layers is noticeably poorer, and (2) the main source of heterogeneity no longer seems to be the microtopography of the tundra. Instead, wind effects, manifest in both the amplified undulation of layers and the conspicuous presence of lenses of depth hoar embedded in wind slab, now seem to dominate the layer heterogeneity. Similar features were present in Figure 1, but not as prominent, suggesting that these wind features are generally >10m long. Additionally, as before, the heterogeneity in one layer propagates upward (with damping or amplification), affecting the overlying layers.
A 100 m long stratigraphic profile from Imnavait Creek, 27 March 1996, produced from 21 snow pits, each >1m wide, spaced at 5 m intervals.
At the landscape scale (1–10 km), a stratigraphic profile based on observations from 34 snow pits dug on a transect between two creeks near Ivotuk, Alaska (68°29’ N, 155°45’W), is shown in Figure 3a. The topographic profile and the snow depths along the transect are shown in Figure 3b. Over this distance, the snow surface was obviously not level, but to make it easier to display and relate the stratigraphic results, we have assumed the surface was level and projected the layers downward using measured layer thicknesses. All of the variability in snow depth appears as undulations in the tundra surface. Once again, some of the layers (two out of four) tend to be laterally discontinuous, though not to the extent observed at the 100 m scale. Both microtopography and wind drifting appear to contribute to the spatial heterogeneity equally. Somewhat puzzling is the third layer down from the top, a depth-hoar layer that exhibits significant undulations and is missing or very thin over distances as great as 200 m.We suspect that the wind event that deposited the slab which overlies this depth-hoar layer eroded the layer before laying down the slab itself. Except at 2500 m (where the traverse line crosses Iteriak Creek and the basal depth-hoar layer swells noticeably), the stratigraphy seems to be independent of the landscape. Partially contributing to this “disconnect” is the fact that the predominant winter winds in this area are from the north or south, directions that are approximately perpendicular to the traverse direction.
(a) A 4 km stratigraphic snow profile from Ivotuk (68°29’N, 155°45’W) derived from 33 snow pits, 15 November 2000. For simplicity, a level surface has been assumed and the base of the snow allowed to vary. (b) The topographic profile associated with (a), with the snow-depth distribution. Snow-pit locations are marked. Iteriak Creek is the low point at 2500 m.
Finally, at the largest scale (sub-regional: about 200 km), the stratigraphic story remains much the same. In this case, the data were collected during two over-snow traverses of the Kuparuk Basin in 1996 and 1997 (see Reference König and SturmKönig and Sturm, 1998; Reference Liston and SturmListon and Sturm, 2002; Reference Taras, Sturm and ListonTaras and others, 2002). Imnavait Creek is at the head of the basin; Prudhoe Bay on the north end where the Kuparuk River empties into the Arctic Ocean. During the traverse, the stratigraphy was measured at stations spaced at 5–10 km intervals (Fig. 4a), with about 40 stations spanning the basin from south to north. The same layers of snow were unambiguously identified and cross-correlated across the basin, a point to which we return for perennial snow. Here for simplicity we shift from plotting actual stratigraphic profiles to plotting the station average percentage of three types of snow: depth hoar, wind slab and “other” (mostly recent and fine-grained snow). In doing so, we lose some information on the vertical ordering of layers, but we can accentuate regional trends that would otherwise be more difficult to identify. There was in general a higher fraction of depth hoar in 1997 than in 1996, but in several places the relative patterns are similar between the two years. For example, there is a consistent low wind-slab zone between 68.8° and 69.4°N, and a high wind-slab zone between 69.5° and 70° N. These zones coincide with known areas of low and high winds, respectively (Reference Li and SturmLi and Sturm, 2002; Reference Olsson, Sturm, Racine, Romanovsky and ListonOlsson and others, 2003). They are the manifestation of variations in weather and seem to have a scale length of about 70 km. Perhaps the most important result is that while in some locations snow-texture fractions varied on spatial scales of just a few kilometers (spiky areas in Fig. 4b and c), for the most part the variations occurred over distances of 10–25 km, with consistent trends for several stations along the traverse. While in Figure 3 we could discern no “landscape” signal in the stratigraphy, we would suggest that in Figure 4b and c the variations at scales of 10–25 km are the landscape signal, a scale length that was too large to be sampled in Figure 3.
(a) Longitudinal profile of the Kuparuk Basin in northern Alaska, showing the steady drop in elevation with distance north. Station locations (black circles) are marked and indicate local ridge and valley topography. Larger variations in snow texture over distances of 10–25 km are observed where relative elevation differences of stations are large (i.e. see data from 69.1°N). (b, c) Stratigraphic profiles for the Kuparuk Basin for 1997 (b) and 1996 (c). For each station along the south–north traverse route, the snow cover has been divided into depth-hoar, wind-slab and other fractions. The cumulative fraction is shown. In 1996 the mean snow depth was 51.2 cm (SD =19.3 cm); in 1997 the mean was 57.3 cm (SD =13.5 cm).
4.2. Heterogeneity of other types of seasonal snow
The primary agents producing layer heterogeneity in the examples presented so far were wind drifting and its interaction with substrate microtopography. Depth-hoar metamorphism accentuated or damped the heterogeneity to a limited degree in some cases. For snow covers in which water percolation and snow–vegetation interactions occur, there is a marked increase in layer heterogeneity. In Figure 5 (from Reference SturmSturm, 1992), the addition of shrubs and trees has amplified the heterogeneity, through both primary (depositional) and secondary (post-depositional) processes. Shedding of snow from canopies has produced tapering and deformation of snow layers near tree trunks. Ventilation of the snow where shrubs and small trees have been buried has caused laterally irregular metamorphism that is far more pronounced than in Figure 1. Subsequent surface thawing and percolation of water into the snowpack has produced very irregular and laterally discontinuous ice lenses, as well as the incorporation of the icy balls of snow that have fallen from the tree limbs. Similar results from other forest snow covers have been obtained by Reference In der GandIn der Gand (1978) and Reference ImbeckImbeck (1987). Combined, these show that snow layers undulate more, consist of laterally more variable textures and are more heterogeneous than in the examples presented in Figure 1–4. In Figure 5, all four agents (Table 1), especially vegetation in the form of trees, have combined to produce a high level of heterogeneity.
A 5 m stratigraphic cross-section from the taiga snow near Fairbanks, Alaska (64°50’N, 147°50’W), 22 January 1991, showing increased layer heterogeneity due to vegetation (trees and shrubs), water percolation and the interaction of both.
4.3. Perennial vs seasonal snow
A stratigraphic profile from the perennial snow cover at Byrd Station (80° S, 120°W) is shown in Figure 6 (from Reference BensonBenson, 1971). Byrd Station is in the dry-snow facies (Reference BensonBenson, 1962; Reference PatersonPaterson, 1981), and surface melt events are uncommon. The local accumulation rate is about 15 cmw.e. a–1. The length of this profile is comparable to that of the one from the tundra snow at Imnavait Creek , and surface conditions at the two locations can look remarkably similar. The layers are more planar and flat-lying than those at Imnavait. They are also denser, in large measure because all have weathered several annual cycles, been reworked by wind over a period of several winters and been subjected to >3m of overburden. Perhaps of most interest, the Byrd layers are more continuous than those at Imnavait, with only 5 of the 17 layers pinching out laterally. Conspicuously absent are the effects of substrate microtopography on overlying layers.
Three snow pits bracketing the location of the cross-section in Figure 6 and spanning a distance of about 250m were dug. It is difficult to cross-correlate layers between these pits (Fig. 7) based solely on the snow texture, so density and ram hardness have also been used to draw the isochrones shown in the figure. The difficulty highlights that once again layer heterogeneity at the 100 m scale appears to be greater than at the 10m scale. In this case, the contrast is even more pronounced than in the case of the seasonal snow layers (Fig. 1 and 2) because over 14 m (Fig. 6) the perennial snow layers are so regular. The source of this 100 m scale variability is uncertain, but Reference BensonBenson (1971) has documented that, in the area where the snow pits were dug, the 1961 snow surface had a distinct slope to the northeast of 0.5°, despite the fact that the ice sheet in this area is level. We speculate that this slope was either the result of wind transport of snow at a mega-dune scale (Reference Fahnestock, Scambos, Shuman, Arthern, Wine-brenner and KwokFahnestock and others, 2000; Reference Frezzotti, Gandolfi and UrbiniFrezzotti and others, 2002a, Reference Gowb), or a subtle response to bottom topography (personal communication from S. Arcone, 2003). The slope and these references suggest that the idea that perennial snow layers are not affected by topography is an abstraction that is probably never actually achieved.
A 14 m stratigraphic profile from near Byrd Station, in the dry-snow facies, after Reference BensonBenson (1971). The profile was observed in a deep trench cut for construction of Byrd Station. The top of the snow had been worked by a Peter Snow Miller machine to increase its density; a separate pit was dug to sample these layers (not shown). Layers are shown diagrammatically, not using the international snow symbols.
Despite the marked local (100m scale) heterogeneity exhibited (Fig. 7), individual snow layers and annual units of snow have been tracked for hundreds of kilometers across the Greenland ice sheet (Reference BensonBenson, 1962) and have served as the basis for mass-balance studies. An example of this long-distance spatial persistence is shown in Figure 8, where a packet of distinctive layers, consisting of a wind slab overlying a coarse-grained unit with fine-grained lenses and icy features, has been tracked for 160 km down the crest of the ice sheet. The packet or sequence of layers remains distinctive over the entire distance, though some of the individual layer characteristics evolve and change. These changes are the result of synoptic-scale variations in the weather and are similar to the layer variations at the same scale shown in Figure 4 for the seasonal snow of the Kuparuk Basin. For example, the icy lenses at 320 cm depth at 75°N give way to fine-grained lenses in the south, where melting and percolation were less pronounced. These are essentially facies changes, though they are of a subtle enough nature that they do not impede cross-correlation.
Three snow pits spanning the location of Figure 6, showing the strong variation of the surface snow over a distance of 280 m.
We have observed much more extreme facies changes in the characteristics of a single layer when it has been followed up the ice sheet to the summit (topography-driven heterogeneity). The best example is that of a layer formed on 11 July 1954. At an altitude of 1919m, in the upper part of the percolation facies, significant melt evidence formed; at 2616 m, in the dry-snow facies, the same layer showed no melt evidence but instead was a hard, well-developed wind slab (Reference BensonBenson, 1962, figs 25 and 32c). Cross-correlation was aided greatly by the fact that snow pits were dug at regular (16 km) intervals. If the layers had not been followed at intervals, it is unlikely that an unambiguous correlation would have been possible. A similar need for regularly spaced snow pits because of facies changes has been observed for seasonal snow on a 1000 km transect in north-west Alaska (M. Sturm, unpublished data).
5. Discussion
The examples we have presented support the simplified view of layer heterogeneity presented in Table 1, at least at the 10m scale. Because fewer agents act on the perennial snow, layer heterogeneity is less. Observations indicate perennial snow layers are more level, planar and continuous than their seasonal counterparts (cf. Fig. 1 and 6), even when comparing two dry, wind-affected snowpacks that otherwise share many similar characteristics. Several factors account for these differences. First, even in flat areas, substrate microtopography affects seasonal snow (and not just the basal layers), but not perennial snow, where basal topography induces variations at a much larger scale. This absence of microtopography in the perennial snow cover also eliminates a critical nucleating agent for additional heterogeneity through wind–snow interactions triggered by the micro-relief. As a consequence, perennial snow layers pinch and swell less. Second, perennial layers generally weather one or more annual cycles and more than one winter of wind transport, while seasonal snow layers do not. A number of investigators have commented on the smoothing and leveling effects of these and summer surface processes on ice sheets. Erosion of sastrugi (Reference GowGow, 1965; Reference OrheimOrheim, 1968), differential heating by solar radiation (Reference WellerWeller, 1969), and wind redistribution (Reference BensonBenson, 1962) all combine to decrease the heterogeneity of the perennial layers in contrast to seasonal layers. Third, seasonal snow can be acted upon directly and indirectly by agents like vegetation that do not affect perennial snow (Fig. 6). Water percolation and the heterogeneity it produces in snow layering may be similar in both types of snow covers, but when combined with snow–vegetation interactions in seasonal snow, heterogeneity is maximized.
For scales >10m, our examples suggest that the heterogeneity of seasonal and perennial snow layers converges. More importantly, they also suggest that the heterogeneity for both types of snow reaches a near maximum at a scale on the order of 100m. In both seasonal and perennial settings, snow pits spaced more widely (several kilometers to hundreds of kilometers) do not seem to exhibit much more heterogeneity than might be found in a 100m long trench. This point is demonstrated by the fact that virtually every slab- and hoar-fraction combination found in Figure 4b and c can be obtained from Figure 2. While for perennial snow covering a scale of 100m the data are less extensive, a comparison of Figures 6 (10m scale) and 7 (order 100m scale) suggests the same sort of scaling relationship exists in perennial snow. For snow layers in complex terrain like the Alps, it is possible that heterogeneity peaks at a smaller scale, but we note that recent measurements (Reference Kronholm, Schweitzer and SchneebeliKronholm and others, 2004) indicate that, at least to 20 m, snow layers still exhibit a fair degree of regularity.
We speculate that layer heterogeneity peaks near the 100m length scale because it is the scale of many wind-drift features. The most widely recognized drift features (Reference DoumaniDoumani, 1967) range from sub-meter to a few tens of meters in length, but there is evidence of the existence of much larger features, including mega-ripples, in Antarctica and Greenland (Reference BensonBenson, 1971; Reference Fahnestock, Scambos, Shuman, Arthern, Wine-brenner and KwokFahnestock and others, 2000; Reference Frezzotti, Gandolfi and UrbiniFrezzotti and others, 2002a, Reference Gowb). In Figure 2, the pinching-out of some of the layers higher in the pack may be the edges of wind deposits nearly 100m long.
For scales >100m, two different effects become important, one related to the interaction of landscape and weather, the other to the way we obtain, examine and think about stratigraphic data. In complex and steep terrain, variations in wind, gravitational effects, precipitation and solar radiation can individually or in combination produce great heterogeneity in seasonal snowpacks at scales comparable to that of the landscape. The channeling of wind or snow squalls down a canyon is a good example of this landscape–weather effect, though in Figure 3 these landscape-scale variations are not obvious. On the ice sheets, the absence of strong local topography reduces landscape–weather interactions so that the source of the larger-scale heterogeneity shifts toward synoptic gradients in snowfall, temperature, wind fields and other weather phenomena. The scale over which these gradients vary is on the order of tens to hundreds of kilometers. This synoptic-scale variation can be seen in Figure 8 where a distinctive packet of snow layers remains recognizable over 160 km, yet textural aspects of the packet change due to synoptic gradients. Seasonal snow covers are also affected on this synoptic scale, but landscape-scale variations can easily mask these larger-scale trends. In Figure 4, the 30–70 km long regions of relatively low and high wind-slab fractions, somewhat difficult to see because the signal is noisy, are probably the result of such synoptic weather gradients. One caveat to this general situation: there is ounting evidence that basal topography and surface processes produce subtle topography at the surface of ice sheets, and that this topography, despite being subtle, interacts with the wind to produce heterogeneity in the same way that topography and wind interact in seasonal snow layers.
Cross-correlation of distinctive layers and sequences of layers over a distance of 160 km down the spine of central Greenland (see Reference BensonBenson, 1971, for more details). The numbers at the top (S4-150, etc.) are station numbers.
Perhaps of equal importance, the way we obtain and deal with information about snow layers at scales 4100 m is quite different than the way we can deal with layers at smaller scales. The amount and richness of the available data are much lower at these larger scales. Except in very rare cases, the digging required to obtain continuous exposures of stratigraphic layers is prohibitive. Heterogeneity, or its converse, layer continuity, is assessed by cross-correlating layers from one pit to another. Pit spacing determines how refined our understanding of the layer variations will be. For those who engage in cross-correlation art, a long-standing but unstated premise is that some layers cannot be matched from one pit to another. We ignore these. The cross-correlation is almost always achieved instead by matching unique sequences of layers, and by keying on layers that have very distinctive and pronounced textural characteristics. Both methods have been used to line up the layers in Figure 8. In the same figure, a number of layers cannot be matched from one pit to another. We would suggest that these “unmatched” layers are manifestations of the order 100m scale heterogeneity exhibited in Figures 2, 3 and 7 and are rightly ignored. Further, we would suggest that this 100m scale variability will almost always be present to confound cross-correlation. Synoptic-scale heterogeneity can also be observed in Figure 8, but it is manifested as gradual changes in layer characteristics that do not prevent cross-correlation. Tracing layers from one pit to another with smaller intervals between pits (40 km in Fig. 8) makes the cross-correlation easier because the changes are more easily resolved, but the underlying 100m heterogeneity is always present and always confounds cross-correlation of at least some of the layers.
6. Conclusions
Two glaciological views of snow layers, smoothly regular or wildly irregular, bracket the actual nature of these fundamental building blocks of the snow cover. Unfortunately, due to the difficulty of observing layer heterogeneity over distances of more than a few meters (the width of a snow pit), we know very little about the range of layer heterogeneity or how it varies with landscape, vegetation and glaciological setting. The examples we have presented from arctic tundra snow in Alaska and the perennial snow in Greenland and Antarctica suggest that the heterogeneity increases up to a scale length of about 100m, after which it remains relatively constant through two-orders-of-magnitude greater scales. Since much of the heterogeneity in these dry, high-latitude snow covers is the result of wind action on the snow, we think the 100m scale length is related to wind-drift structures of approximately this size. At scales of 10m and less, arctic seasonal snow layers are more irregular and less planar than their perennial counterparts, consistent with the fact that there are twice as many agents able to produce heterogeneity in seasonal snow as in perennial snow. At the largest scales, over distances of tens to hundreds of kilometers, gradual variations in layer characteristics are related to synoptic-scale variations in weather. These are fully analogous to the geologic concept of facies changes in sedimentary rocks. At these large scales, attempts to cross-correlate layers from one location to another frequently reveal layers that “do not correlate”, along with unique sequences of layers or distinctive individual layers that are easily related. These distinctive layers have (tacitly) served as the basis for cross-correlation for many years. We would suggest that the existence of maximum heterogeneity by the 100m scale helps to explain why there are always uncorrelated layers.
Acknowledgements
We would like to thank D.Trabant, G.Liston, J.Holmgren, M. König, K. Tape, A. Cheuvront, E. Pyne, R. Flaherty and all of the other people who have helped to excavate trenches in the snow and record the stratigraphy. J. Holmgren and K. Tape provided valuable insight into layer heterogeneity. C. Pielmeier and M. Schneebeli kindly provided us with their review of snow stratigraphy indraft. S. Arcone, C. Garcia and ananonymous reviewer provided comments that improved the text. E. Martin helped the work as scientific editor. The work was supported by U. S. National Science Foundation grant OPP-97433556 and by U.S. Army Cold Regions Research and Engineering Laboratory AT-24 funding.



