


INTRODUCTION
Language and interactive skills are learned hand-in-hand: language is critical for children's daily interactions with others, and interaction is where children receive their primary linguistic input. Despite this interdependence of language and interaction, we know very little about how interactive skills are acquired or how they develop alongside linguistic knowledge. In this paper we focus on the longitudinal development of an interactive skill that emerges in early infancy but is not mastered until middle childhood: conversational turn-taking.
Interactional development affects theories of language learning because interaction shapes the way children hear and use language. Turn-taking and language are closely intertwined for adults (Levinson, Reference Levinson, Stivers and Sidnel2013; Levinson & Torreira, Reference Levinson and Torreira2015) but, long before their first words, children regularly produce vocal ‘turns’ without language (e.g. Bateson, Reference Bateson1975; Snow, Reference Snow, Snow and Ferguson1977; Jasnow & Feldstein, Reference Jasnow and Feldstein1986; Hilbrink, Gattis & Levinson, Reference Hilbrink, Gattis and Levinson2015). It's only around age twelve months, when they start producing their first words, that children need to use language and interactive skills simultaneously. Their shift to verbal responses requires them to integrate two, formerly independent, systems – linguistic and interactional – which may well be a major contributor to children's prolonged, non-linear, development of turn timing (Ervin-Tripp, Reference Ervin-Tripp, Ochs and Schieffelin1979; Hilbrink et al., Reference Hilbrink, Gattis and Levinson2015).
We report here on a longitudinal study of children's timing as they respond to questions. We focus on the interplay of linguistic ability (the complexity of their responses) and interactive skill (their timing in turn-taking) from age one to three. Our results suggest that children's turn timing is affected by the complexity of their responses throughout early childhood, and that linguistic gains translate piece-by-piece into more adult-like turn-timing skills. These findings overturn the notion that children's turn timing is simply slow to develop, and instead suggest that children acquire turn-timing skills early on, but that response planning plays a major role in limiting children's ability to respond on time.
Children's early turn timing
When adults converse with one- and two-year-olds, they often encounter long delays between turns at talk. Young children have difficulty getting their turn timing right, occasionally initiating their turns too early, but more often initiating them too late (Ervin-Tripp, Reference Ervin-Tripp, Ochs and Schieffelin1979; Garvey & Berninger, Reference Garvey and Berninger1981). Even in preschool, children's response latencies can be up to ten times longer than adults': in child–child conversation, the average response latencies for three-year-olds range between 1·1 and 1·8 seconds, and for five-year-olds between 0·8 and 1·5 seconds (Lieberman & Garvey, Reference Lieberman and Garvey1977; Garvey & Berninger, Reference Garvey and Berninger1981).
Despite this, children's long latencies rarely hinder one-on-one conversations with adults. Even conversations with toddlers generally proceed smoothly in the face of frequent delays and irrelevant responses because adults can accommodate the turn-taking behaviors of their young interlocutors (Ervin-Tripp, Reference Ervin-Tripp, Ochs and Schieffelin1979; Dunn & Shatz, Reference Dunn and Shatz1989). In one study of six children aged 1;0 to 1;6, raters judged 90% of one-year-olds' utterances as relevant to the prior turn, provided the children had initiated their response within 4·25 seconds – more than eight standard deviations from adults' average latency in the same language (Balog & Roberts, Reference Balog and Roberts2004; Stivers et al., Reference Stivers, Enfield, Brown, Englert, Hayashi, Heinemann, Hoymann, Rossano, de Ruiter, Yoon and Levinson2009).
Once another child or a third speaker becomes involved, children's delays in turn-taking are more likely to cause misunderstandings in conversation. With three or more participants, it is less clear who will speak next, so there is more pressure to respond quickly in order to secure the floor. In this context, a two-year-old may plan to make a relevant contribution, but will often execute that plan too late for the ongoing exchange (Dunn & Shatz, Reference Dunn and Shatz1989). Peer-to-peer conversation between children is even more difficult with no adult to mediate. Misunderstandings and non-coordinated turn-taking are frequent in talk among peers (Ervin-Tripp, Reference Ervin-Tripp, Ochs and Schieffelin1979).
When adults take turns in conversation, they usually follow the constraint of ‘one speaker at a time’ (Sacks, Schegloff & Jefferson, Reference Sacks, Schegloff and Jefferson1974). This leads to a pattern of minimal-gap and minimal-overlap between turns. That is, when one speaker passes the floor to another, the two work together to minimize both vocal overlap and silence between the turns. To do this, the participants need to jointly manage who speaks when. Even though this presents a tricky problem of coordination, adults are adept at beginning their turns with average response latencies of approximately 200 ms (ten Bosch, Oostdijk & Boves, Reference ten Bosch, Oostdijk and Boves2005; de Ruiter, Mitterer & Enfield, Reference de Ruiter, Mitterer and Enfield2006; Stivers et al., Reference Stivers, Enfield, Brown, Englert, Hayashi, Heinemann, Hoymann, Rossano, de Ruiter, Yoon and Levinson2009), and with minimal overlaps of zero to two syllables (Schegloff, Jefferson & Sacks, Reference Schegloff, Jefferson and Sacks1977). Adult speakers hear these rapid transitions as having no gap and no overlap, and cross-linguistic evidence suggests that this pattern is universal (Stivers et al., Reference Stivers, Enfield, Brown, Englert, Hayashi, Heinemann, Hoymann, Rossano, de Ruiter, Yoon and Levinson2009).
To take turns with such accuracy, adult speakers need to predict when the current turn will end and begin planning their response in advance so they can start speaking at the very moment the current speaker stops (Sacks et al., Reference Sacks, Schegloff and Jefferson1974; de Ruiter et al., Reference de Ruiter, Mitterer and Enfield2006; Tice & Henetz, Reference Tice (Casillas), Henetz, Carlson, Hoelscher and Shipley2011; Levinson & Torreira, Reference Levinson and Torreira2015). To do this, they must begin planning their next turn while simultaneously predicting when the current speaker will finish talking. For both planning and predicting, they make use of their linguistic, world, and interpersonal knowledge (e.g. Ford & Thompson, Reference Ford and Thompson1996; Wells & Corrin, Reference Wells, Corrin, Couper-Kuhlen and Ford2004; de Ruiter et al., Reference de Ruiter, Mitterer and Enfield2006; Forrester, Reference Forrester2013; Clark & Lindsey, Reference Clark and Lindsey2015), and greater predictability leads to more accurate timing estimations (Magyari & de Ruiter, Reference Magyari and de Ruiter2012). In adjacency pairs, like question–answer pairs, the first speaker's turn makes the second speaker's turn more predictable; it projects the type of response that is needed next, and the addressee is then obligated to give his or her relevant response in the next turn (Schegloff & Sacks, Reference Schegloff and Sacks1973; Sacks, Reference Sacks1992; Schegloff, Reference Schegloff2007; Heritage & Clayman, Reference Heritage and Clayman2011).
It is challenging for children to take turns like adults do because they do not yet know enough about language and language use to (a) predict turn end boundaries with accuracy and (b) begin planning the next turn ahead of time. If it takes children longer than adults to understand the current speaker, or if it takes them longer to access, plan, and articulate an utterance, their response will be delayed. Equally, if they can't predict the end of a turn accurately, they will not come in on time (Gearhart & Newman, Reference Gearhart and Newman1977; but see Casillas & Frank, Reference Casillas, Frank, Knauff, Pauen, Sebanz and Wachsmuth2013). Children can demonstrate adult-like skill in taking turns by jumping smoothly into multi-party conversations, but such smooth transitions may not appear until age six (Ervin-Tripp, Reference Ervin-Tripp, Ochs and Schieffelin1979). Before that, children need to work out the juggling act of coordinating their attention to the current speaker, predicting when that speaker's turn will end, and planning their own response, finally executing their response within milliseconds of the current speaker's turn end.
We report two studies in which we examine children's answers to questions. We show that young children's responses are delayed by the need to formulate complex answers: they answer more quickly when the answers are simple than when they are complex (e.g. Yeah vs. Yeah red one), and they show improvement on simpler answer types earlier than complex ones (e.g. Yeah vs. Yeah, I'd rather read Itsy Bitsy Spider). Because children's answers and their caregivers' questions also exhibit more complexity as they get older, our results point toward an intricate relationship between speech input and production in natural conversation.
Answering questions
We tracked children's timing in adjacency pairs. Adjacency pairs consist of utterances where Speaker 1's utterance elicits an immediate follow-up from Speaker 2 (e.g. Hello – Hello, Thank you – You're welcome, etc.). Questions and their answers are a common type of adjacency pair. When speakers ask a question, they often expect a specific type of answer in the next turn (e.g. yes or no in response to an invitation; Schegloff, Reference Schegloff2007). Question–answer pairs are useful for the study of timing because the content of each answer is contingent on the content of the question posed, as well as on the content of any other questions currently at issue (see, e.g. de Ruiter, Reference de Ruiter2012).
We focused on the timing of questions in the current study because questions are frequent throughout childhood, they vary widely in the types of responses children can give, and they require an answer (Shatz, Reference Shatz1979; Fitneva, Reference Fitneva and de Ruiter2012). Because the form an answer takes is determined, in large part, by the question itself, it is also easier to discard irrelevant responses (i.e. those not contingent on the prior turn) compared to utterances following non-questions. Question types also differ in the answers they project. Yes/no questions minimally require assent or denial, whereas wh-questions require that the answer contain specific pieces of information. Yes/no questions should therefore be easier to process overall than wh-questions. Prior work has shown that, in peer-to-peer conversation, children exhibit significantly longer latencies for complex and unpredictable responses than for simple or predictable responses (Garvey & Berninger, Reference Garvey and Berninger1981; see also Lieberman & Garvey, Reference Lieberman and Garvey1977). So we can accept that children's response latencies depend on the formulation and planning of the next turn, whether that turn is an answer to a question or some other contingent response.
If children's response latencies are linked to linguistic processing, their latencies should be longer when processing demands are greater. But how can we gauge the processing demand for different response types? The processing required for any response depends on multiple factors, including children's age, the type of information to be retrieved, and any facilitating factors stemming from the interactional context (e.g. through repetition of given information).
We can estimate the processing demands for responses by noting (a) the total information the speaker needs to retrieve to formulate the response and (b) any contextual factors that might facilitate information retrieval (e.g. the use of a frequent routine, an immediate repetition, etc.). The total information needed to answer a question depends both on the question asked and the answer given: the question asked largely determines the minimal content needed for a relevant answer (e.g. yes or no in response to a yes/no-question). However, responders can also include information over and above the minimum required (e.g. reasoning or alternatives in addition to a yes/no response). The total information retrieved then derives from both the question asked and the actual answer offered (Schegloff, Reference Schegloff2007; Heritage & Clayman, Reference Heritage and Clayman2011).
Another important aspect of estimating processing demands is accounting for changes in children's linguistic abilities with age. Children's language changes enormously over the first few years, and their responses generally become more complex as they develop. Processing demands are then relative to age: for example, two-word utterances are likely to be more challenging at 24 months than at 36 months because older children have had more practice articulating two-word sequences.
We looked at spontaneous conversations in the home for five children from ages 1;8 to 3;5. We expected that, throughout early childhood, more complex answers would have longer response latencies. But what counts as a ‘complex answer’ changes as children master new linguistic elements and constructions. Caregivers pick up on these changes, ask more difficult questions as children get older, and pursue hitches in communication with variations on the question being asked (e.g. Who is this? What's he called? Who is he? What is his name?; Shatz, Reference Shatz1979; also Filipi, Reference Filipi2009). We expected that, as they did this, the range of complexity in children's answers would expand, and that children's timing would improve first for response types that emerged earlier and were practiced more often. We propose that this trade-off – between children's improvement on earlier-acquired linguistic knowledge and the continuous addition of new linguistic material – is the cause of the prolonged developmental trajectory in children's turn timing (Ervin-Tripp, Reference Ervin-Tripp, Ochs and Schieffelin1979; Garvey & Berninger, Reference Garvey and Berninger1981; Hilbrink et al., Reference Hilbrink, Gattis and Levinson2015). Finally, because caregiver–child conversations minimize linguistic processing demands for adult responses (because of longer delays, a slower pace, and decreased complexity), we expected that caregivers answering their children's questions would be unaffected by the complexity of any answers that they themselves produced.
We tested these predictions in two corpus studies. The first reveals complexity effects across a range of children's answer types and the second looks more closely at two answer types to pinpoint the developmental trends underlying the broader patterns in children's turn timing.
STUDY 1: THE EFFECT OF RESPONSE COMPLEXITY ON TURN TIMING
To investigate whether children's response latencies are linked to the complexity of their responses, we first considered the variety of early response types that children produce, and investigated how these change with age in content and in response latency.
METHOD
To detect simultaneous changes in children's timing and language development, we analyzed longitudinal data from the CHILDES Archive (MacWhinney, Reference MacWhinney2000) for five children from the Providence corpus of American English: Alex, William, Lily, Naima, and Violet (Demuth, Culbertson & Alter, Reference Demuth, Culbertson and Alter2006). We omitted data from a sixth child who was later diagnosed with mild Asperger Syndrome since this syndrome can affect the development of conversational skills (cf. Baron-Cohen Reference Baron-Cohen1997; Ochs, Kremer-Sadlik, Sirota & Solomon, Reference Ochs, Kremer-Sadlik, Sirota and Solomon2004). The recordings in this corpus were made for each child at roughly two-week intervals from ages one to three. The recordings start at a time when children begin to take intelligible turns (E. V. Clark, Reference Clark2009). Most recordings are approximately one hour long, and capture spontaneous caregiver–child interaction at home. The caregivers and children wore wireless microphones and were filmed with a stationary camera somewhere in the room.
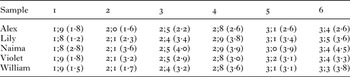
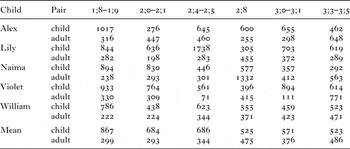
We sampled thirty question–answer (Q-A) pairs at six evenly spaced age points for each child (Table 1). In each age sample we took: (a) the first fifteen questions asked by the adult and answered by the child (A-asks-C), and (b) the first fifteen questions asked by the child and answered by the adult (C-asks-A). At least one author reviewed each transcript together with its recording to identify Q-A pairs.
Age (MLU) of each child at each of the six time samples

All questions in the dataset had rising intonation and/or question-syntax (e.g. subject–auxiliary inversion, wh-initial phrases, etc.). If a question was asked several times in succession (e.g. What's that? while looking at a picture book), we sampled only the first instance in that chain of questions. If there were fewer than fifteen tokens in one of the recordings (e.g. C-asks-A tokens), we continued with the next recording session that was closest in age for the same child, looking through a maximum of three recordings for any child in a single age sample. Using this technique, there was only one case where we were unable to find thirty Q-A pairs; in Violet's youngest sample, we only found eight C-asks-A questions. The final dataset included 893 Q-A sequences. Table 1 shows the approximate age and MLU of each sample in the final dataset. MLU values reported in the table represent average utterance length in morphemes for each time sample using CLAN's MLU command (MacWhinney, Reference MacWhinney2000; see ‘Appendix A’ for the list of recordings for each time sample, provided in supplementary materials at <http://www.journals.cambridge.org/JCL>).
Coding
We coded each Q-A pair for its question type, question complexity, answer type, answer complexity, answer givenness, and routine familiarity (‘Appendix B’; see supplementary materials at <http://www.journals.cambridge.org/JCL>). We coded for complexity because we expected that the complexity of an utterance would relate to timing: greater complexity should lead to more processing time in comprehending the question, in planning a response, or both. Question type was determined by syntactic category (yes/no, wh-, X-or-Y), with separate codes for each wh- type (e.g. what, who, when). We coded how questions like How about this one as yes/no questions since they generally expect a yes or no response, just like a syntactically defined yes/no prompt.
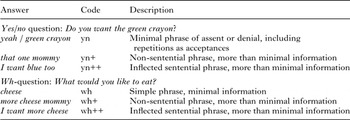
The code for answer type was two-dimensional: it was jointly determined by the question type plus the total information given in the answer. Minimal answers (e.g. Do you want more? –Yes; Where is it? – There) were coded separately from complex answers within each question type (e.g. yes/no++: Yes I can; where++: It's over there; see Table 2). The answer type code reflects the complexity of the answer, as determined by (a) the question asked and (b) the answer chosen. Because utterance length often reflects the amount of information contained in the answer (Wasow, Reference Wasow1997), we indexed each question and answer's overall complexity separately by computing their lengths in morphemes and clauses.
Codes for six example answers to yes/no and wh-questions

This left us with several measures of complexity. While total length of an utterance in morphemes and clauses is a popular measure of complexity, it treats each morpheme and clause as equal, such that a simple wh answer (cheese) and a simple yes/no (yeah) answer would be assumed to have the same complexity, even though the wh answer was retrieved from a larger set of alternatives (cereal, apple, yogurt, etc.). Also, while syntactic question type captures the kind of information asked for, it doesn't distinguish between answers that contain a minimal response (yeah), and answers that contain a more-than-minimal response (I want blue too). This is why we included a third measure of complexity – answer type – to capture the total complexity required for answering questions by including both question type and answer form (Table 2). In the examples in Table 2, as in the overall data, the length of an answer alone was not a reliable indicator of its complexity category. In response to yes/no questions, many young children used verbatim repetitions as confirmatory responses (e.g. green crayon in Table 2). We counted these verbatim confirmations as equal in planning complexity to a ‘yes’ or ‘no’ response since they don't require the child to retrieve any new information.
In addition to response complexity, we expected familiarity and recency to impact children's timing; children should find it easier to formulate answers that contain highly familiar words or that simply reuse words from the question (Dapretto & Bjork, Reference Dapretto and Bjork2000). We coded whether each Q-A was part of an iterated sequence (e.g. as in picture-book reading What's that? – Cat!; What's that? – Dog!; How 'bout that one? – Sheep!) or of a regular caregiver–child routine (e.g. Red means? – Stop! – Green means? – Go!). We also coded the givenness of each answer by: (1) information status (all new / some new / nothing new), (2) topic recency (how often material in the answer was mentioned in the three prior utterances), and (3) repetition of the prior turn (immediate repeat or not). Information status, recency, and repetition were coded independently and were not mutually exclusive.
We also coded for three other sources of variation in children's turn timing: whether the question asked was a ‘true’ (information-seeking) or a ‘test’ question, the preference status of answers to invitations and offers (confirming or disconfirming), and the phonetic properties of the turn boundaries. Parents often ask children questions that they already know the answers to, the most frequent example being ‘test’ questions like What does a cat say? – Meow, and What do you say? – Please).
Test questions, by their nature, are practiced in routine child–caregiver interactions, and may result in faster responses. We therefore coded whether each A-asks-C question was information-seeking, i.e. whether the question was asked without knowing the answer. To assess information-seeking status, the first author (coder) had to infer what caregivers might or might not have known when they asked each question. The second author independently re-coded 25% (118) of the questions, resulting in a 93% agreement rate. Additionally, because adults give faster confirming than disconfirming answers to many yes/no questions (Stivers et al., Reference Stivers, Enfield, Brown, Englert, Hayashi, Heinemann, Hoymann, Rossano, de Ruiter, Yoon and Levinson2009; but see Kendrick & Torreira, Reference Kendrick and Torreira2015), we coded for whether participants' answers to invitations and offers were confirming or disconfirming.
Finally, we annotated questions ending in fricatives and answers beginning with fricatives because fricative segments are difficult to measure consistently, given variation in microphone distance and noisy home recording environments. Some fricatives are also more prone to phrase-final lengthening, which could artificially shorten the gap from question to answer (Cooper & Danly, Reference Cooper and Danly1981). We annotated all turn-initial and turn-final fricatives in order to assess this source of variation.
Measurement
Two research assistants, naive to the purpose of the study, measured the response latencies for the 893 Q-A pairs. Both had prior training in phonetics, and they received additional instruction from the first author in using Praat software to identify turn end and turn start boundaries (Boersma & Weenink, Reference Boersma and Weenink2012). They followed detailed notes on measurement conventions and, for difficult measurements, checked boundary placement with the first author.
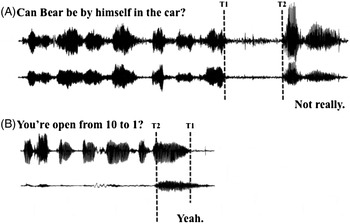
In cases of positive response latency (gap), the onset of the answer was marked at the first phonetic cue to the answerer's speech (e.g. the start of voicing, the release of a stop, the start of visible frication; see Figure 1A). We included turn-initial delay-markers like uh and um as the first word of a turn when they occurred, since they are probably planned parts of the child's utterance (H. H. Clark & Fox Tree, Reference Clark and Fox Tree2002; Casillas, Reference Casillas, Arnon, Casillas, Kurumada and Estigarribia2014). When a responder began speaking before the questioner finished, the turn-exchange had a negative response latency (overlap). In these cases, the research assistants were instructed to use spectral, waveform, and auditory information, respectively, in identifying each boundary (Figure 1B), such that careful review usually made these judgments reliable within a few glottal pulses. We determined the response latency for each Q-A pair to the nearest millisecond. A separate set of research assistants re-measured 10% of the 893 latencies. Of these, 82% showed less than 100 ms difference from their original measured values, and 95% showed less than 200 ms difference from their original measured values (inter-rater correlation: r 2 = ·74, p < ·001).
Examples (from nai83) of answers to questions that left a gap (A) and that overlapped (B). The latencies (T2–T1) in this example are 641 ms in A and –292 ms in B.

Our final analyses excluded the 3·3% of response latencies that were more than 2·5 SDs from the child and caregiver group means. All the response latencies excluded as outliers were gaps. We also removed question and answer types with fewer than ten tokens for the children and caregivers as groups (a further 22·5% of the original data) because we needed enough examples of each answer type to account for variation in givenness and familiarity across ages and among speakers.
RESULTS AND DISCUSSION
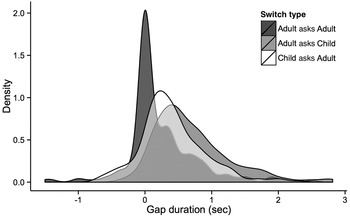
Children's timing was slow compared to adults, but got faster from age 1;8 to 3;5. Most children did not display a monotonic decrease in overall response latency over time (Table 3), possibly because of differences in the types of answers they gave at each age. To account for this variation across children and samples, we added interactions between age and answer type to the analyses described below. The median response latency for children was more than one and a half times longer than adults' (625 vs. 371 ms), whose timing, if anything, became slightly slower as their children got older (Table 3). The adults' response latencies were slow compared to Q-A timing for adult–adult spontaneous American English (medians of 371 vs. 0 ms overall; Stivers et al., Reference Stivers, Enfield, Brown, Englert, Hayashi, Heinemann, Hoymann, Rossano, de Ruiter, Yoon and Levinson2009; Figure 2). This may indicate that the caregivers were accommodating to their young children's turn timing. We report median response latencies because the turn transition latencies have skewed distributions.
Density plot of adult and child response latencies for polar questions. The adult-asks-adult latencies come from Stivers and colleagues' (2009) American English data.

Median response latency (milliseconds) for adults and children for all Q-A types at each age sampled

Complexity effects
We expected that, for children, response latencies would be longer for complex questions and answers. The total processing needed to access and formulate an answer depends on both the question asked and the answer provided. To look at each source of processing demand, we coded the complexity of questions and their answers separately. But, because answer type is determined in part by the question (e.g. a location phrase following a where question), question and answer types were highly correlated and we could not analyze both in the same statistical model. In what follows, we first consider the effects of question and answer complexity individually, and then we present the results from our statistical model.
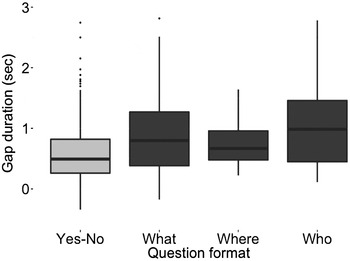
Differences between the response latencies of the question types were small (Figure 3). Children answered yes/no questions the fastest, and wh-questions the slowest. Among wh-questions, the types that children typically acquire first were also those with the shortest latencies (what, where before who; see E. V. Clark, Reference Clark2009, Ch. 9 and references therein). There were no significant differences in children's response latencies based on the length of the question or answer alone.
Children's response latencies for the four commonest question types.

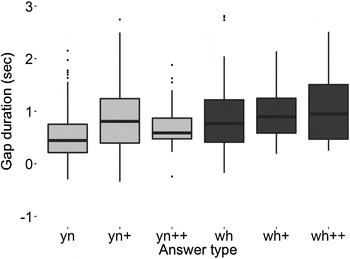
Answer type – our two-dimensional measure of complexity – had the biggest impact on children's timing. As a combination of question type and answer complexity, it captured the type of information accessed (e.g. for a wh- or yes/no question), plus the level of grammatical complexity children used in their response (e.g. yn, yn+, or yn++; see Table 2). When their answers were more complex, children had longer latencies, both within and across syntactic question type categories (Figure 4; median response latencies of different answer types in ms: yes/no = 442 (N = 180), yes/no+ = 806 (N = 32), yes/no++ = 587 (N = 19), wh = 765 (N = 80), wh+ = 895 (N = 10), wh++ = 948 (N = 16)). Simple yes/no answers generally had shorter latencies than simple wh- answers, but when children added more grammatical material to their yes/no responses (e.g. yeah I'd rather read the Itsy Bitsy Spider; yn++), their latencies grew closer to those for simple wh- answers. The same held for answers to wh-questions: when they had more material in their answers, they had longer latencies (Figure 4). In contrast, adults showed no reliable effects of complexity for question or answer type.
Children's response latencies for the six most frequent answer types over all ages.

Variation in timing across answer types appears to be small; there is substantial distributional overlap in the gap durations (Figure 4). However, by testing the effect of answer type against other predictors of response timing, and by testing the interaction of answer type with age, we found support for robust differences across answer types in the statistical analyses reported below.
Mixed-effects model
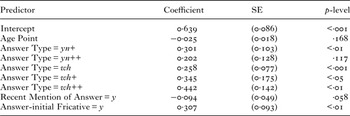
We tested the effects described above in separate mixed-effects linear regression models (Bates, Maechler & Dai, Reference Bates, Maechler and Dai2009) of the children's and adults' response latencies. The regression analyses were carried out using the lme4 package in the statistical software application R (R Core Team, 2015). For all random and fixed effects included in the final model, we confirmed an improvement in the goodness-of-fit with an ANOVA comparing two models – a pair with and without each variable included. Because of the correlation between answer type and question type, we constructed separate models using each coding scheme and found that answer type was a more reliable predictor of children's response latencies (p < ·001). This was anticipated since answer type codes were designed to maximally account for variation in the complexity of children's answers. The final model of children's response latencies included fixed effects of age (age points 1–6), answer type (yes/no, yes/no+, yes/no++, wh, wh+, or wh++), whether the answer began with a fricative (yes or no), and whether material in the answer was mentioned in the previous three utterances (by the child, by the parent, or by neither); child was a random effect. Each fixed effect was added to the final model because it yielded a significantly higher value of the maximum likelihood estimate of the final model than versions without each of the effects, (answer type: χ 2(5) = 23·137, p < ·001; answer-initial fricative: χ 2(1) = 10·289, p < ·01; recent mention: χ 2(1) = 3·767, p = ·052). Although including the children's age did not significantly improve the model overall (χ 2(1) = 2·013, p = 0·16), we included age as a predictor to test our developmental hypothesis. There were no significant interactions between these factors. The results of the final model are given in Table 4.
Summary of the fixed effects in the final model of children's response latencies (N = 337; log-likelihood = –274·73; df = 11). Answer type contrasts are with respect to simple yes/no answers.

Children's response latencies increased with the complexity of the answer. Simple yes/no answers had significantly shorter latencies than yes/no+ answers (β = 0·301; SE = 0·103; p < ·01) and than wh, wh+, and wh++ answers (β = 0·258; SE = 0·077; p < ·001; β = 0·345; SE = 0·175; p < ·05; and β = 0·442; SE = 0·142; p < ·01). Yes/no++ answers did not have significantly longer latencies than simple yes/no answers, which may partly be due to the small number of yes/no++ responses in our sample (N = 19). Our model did not reveal any significant differences among wh answer types of different complexity, even though the latencies did trend in the expected direction. We suspect again that this is partly due to the small number of wh+ (N = 10) and wh++ (N = 16) tokens in our sample. In sum, children began their simple yes/no answers significantly more quickly than all other answer types, and their yes/no response latencies were longer when they were more complex.
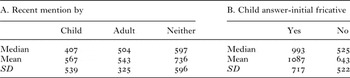
There was no significant main effect of age on response latency (β = –0·025; SE = 0·018; p = 0·168), though there was a numerical decrease (Table 3). This is consistent with earlier findings that children's improvement in the timing of their turns follows a prolonged, sometimes non-linear trajectory (Ervin-Tripp, Reference Ervin-Tripp, Ochs and Schieffelin1979; Garvey & Berninger, Reference Garvey and Berninger1981; Hilbrink et al., Reference Hilbrink, Gattis and Levinson2015). When the answer contained information mentioned in prior turns, children's response latencies were marginally shorter (β = –0·094; SE = 0·049; p = ·058; Table 5A). Finally, answers beginning with a fricative had longer latencies than answers beginning with other segments (β = 0·307; SE = 0·093; p < ·01; Table 5B). This could reflect a consistent measurement error or some other underlying consistency that affected the data uniformly. We explore this issue further in the ‘General discussion’. There were no significant effects of givenness, routine familiarity, or (dis)confirmation on the children's latencies. None of these factors significantly affected adult response latency.
Children's mean and median response latencies (milliseconds) for answers with recently mentioned material (A) and utterance-initial fricatives (B)

Overall, children's response latencies tended to became shorter with age, decreasing from a median of 867 ms at 1;8 to 523 ms at 3;5, although this trend was not significant. The absence of a significant improvement with age seems to be indirectly contradicted by other findings. For example, in on-line non-interactive word-to-picture matching tasks, 18-month-old infants speed up so much by 30 months that they are almost as fast as adults in recognizing familiar words (Fernald, Perfors & Marchman, Reference Fernald, Perfors and Marchman2006) – a task central in interpreting and monitoring ongoing turns. Yet at 2;8 in our sample, children who presumably also experienced these processing gains are still slower than adults in producing turns on time (with median response latencies of 525 ms). If we assume that children are continuously improving in their linguistic processing, there must be another factor in our conversational data that obscures a developmental effect. We propose that the bottleneck is in children's concurrent linguistic growth.
Changing answers and questions
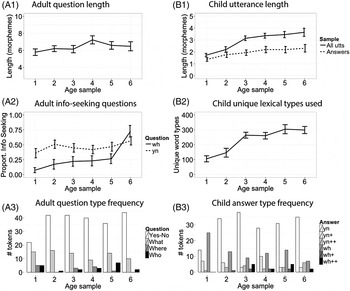
As children get older, the language they produce becomes more sophisticated. A phrase that is difficult or complex for children at 1;8 may have become easy for them at 3;5. By this logic, very simple answers should be fast from the start, and become faster still with age, while more complex answers should emerge later, start more slowly, and then gradually become faster with age. If all answer types emerged in children's speech at the same time, there would be a more uniform decline in response latency with age. But if answer types emerge and develop at separate rates, the overall picture of turn timing is more intricate. Our data are consistent with the latter scenario: Children's (and caregivers') speech becomes more complex as children get older (Figure 5 Footnote 1 ), with some answer types emerging later and with different developmental trajectories (Figure 6).
Developmental change in (A) caregiver questions (A1: length in morphemes; A2: proportion information-seeking questions; A3: frequency of different question types) and (B) child answers (B1: length in morphemes; B2: number of unique lexical types used across the transcript; B3: frequency of different answer types).

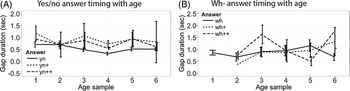
Developmental change in children's timing for the six most frequent answer types with age (A: yes/no answers, B: wh- answers).

Note, for example, that the very first wh+ and wh++ answers don't emerge until the second age sample and remain infrequent thereafter. While simple wh answers show minor decreases in timing between the last two samples, the developmental trajectories for more complex wh+ and wh++ answers are less linear and even show overall increases in gap duration with age. Meanwhile the timing of yn, yn+, and yn++ answers shows small but stable decreases with age. These same patterns were reflected in the output of our statistical model. The developmental trajectory for answers to yes/no questions then appears to differ from that for answers to wh-questions. What is driving this difference in our sample?
Differences in the developmental trajectories for yes/no and wh- answers may in part result from how caregivers themselves use questions to elicit responses from their children (Figure 5A1–3). Caregivers in our sample used yes/no questions to elicit information (via offers, invitations, and clarifications) throughout their children's development. In contrast, they used wh-questions for different purposes at different ages. Most early occurring wh-questions took the form of non-information-seeking questions – most often what or where – that caregivers used to elicit labels for objects, colors, and sounds (e.g. What's a train say? – Choo choo!; lil16). By the final age sample, the same wh- formats were used to ask ‘true’ information-seeking questions – ones the caregivers didn't know the answers to already (e.g. What are you doing over there? – Trying to put the donkey's face in; lil73).
This shift in the epistemic quality of caregivers' questions to their children (Shatz, Reference Shatz1979; Fitneva, Reference Fitneva and de Ruiter2012; Forrester, Reference Forrester2013) appears to be one part of the developmental cycle of adaptation within caregiver–child conversation: the child improves on something, the caregiver ups the ante in response, then the child improves on that with practice, then the caregiver ups the ante again, and so on. At the first age point in our data, 89% of children's answers to wh-questions were single nouns (e.g. trees), but by 3;5, only 38% of them were that brief. Some of the linguistic complexity added with age is likely related to the fact that, later on, caregivers asked ‘true’ wh-questions more often. It takes more effort (and more words) to communicate something that isn't already shared (H. H. Clark & Wilkes-Gibbs, Reference Clark and Wilkes-Gibbs1986; E. V. Clark, Reference Clark, MacWhinney and O'Grady2015).
In this first analysis we found that children took longer to initiate complex yes/no and wh- answers in comparison to simple yes/no answers. These simple yes/no answers showed the shortest response latencies from early on and were also the most frequent in our data. More complex answer types were generally slower, so that added complexity was linked with longer response latencies. Children's more complex responses may in part have come as a reaction to changes in their caregivers' questions, which themselves arose from advances in the children's linguistic ability. Studies of child-directed speech rate and word use have demonstrated that children's developing language patterns can drive changes in caregiver language (Roy, Frank & Roy, Reference Roy, Frank, Roy, Taatgen and van Rijn2009; Ko, Reference Ko2012).
In sum, children's advancing linguistic abilities may actually obscure developmental patterns in their turn timing as a whole. Relatedly, changes in parental behavior (e.g. test vs. true questions) can introduce uncertainty into the interpretation of some answer types (e.g. wh answers). However, decreases in timing with age should be more detectable within answer types that are more stable across development. This is what we looked at in Study 2.
STUDY 2: THE EFFECT OF AGE ON TURN TIMING
In Study 2, we aimed for an in-depth study of yes/no questions to test our predictions about the interaction between answer complexity and age under more controlled conditions, and with more data. By limiting our analyses in this second sample to yes/no questions, we focused on a question type that caregivers use to elicit the same types of answers throughout development (i.e. offers, invitations, and clarifications). By targeting yn and yn++ responses, we were able to test our earlier predictions that (a) children are fast in giving simple answers from the start, (b) they are slow to give complex answers at the start, and (c) they get faster with practice, so that their complex answer forms eventually become as fast as their simple ones.
METHOD
We did not have enough yes/no++ answer tokens in our sample from Study 1. We therefore resampled the corpus from scratch for a new set of yes/no and yes/no++ responses. We sampled twenty question–answer (Q-A) pairs at the same six evenly spaced age points for the same five children (Table 1). At each age sample we took: (a) the first ten A-asks-C pairs with simple yn responses, and (b) the first ten A-asks-C pairs with yn++ responses. Because adult responses in Study 1 showed no effects of age or complexity, we omitted C-asks-A tokens in Study 2. The first author and a research assistant naive to the purpose of the study independently reviewed each transcript together with its recording to identify each Q-A pair. All tokens were agreed upon as clear examples with yn and yn++ responses. All questions in the dataset had rising intonation and/or question syntax (e.g. subject–auxiliary inversion, How about + a suggestion). As before, if a question was one in a sequence of similar questions, we sampled only the first instance in the sequence. If there were fewer than ten tokens of an answer type in one of the recordings (e.g. yn++), we continued with the next recording session that was closest in age for the same child, searching a maximum of three recordings for any child at a single age sample. Using this technique, there were only five cases where we were unable to find the desired twenty Q-A pairs; in William, Alex, and Lily's first sample, we found only six, six, and seven yn++ responses, respectively, and in William and Alex's second sample, we found only one and three yn++ responses, respectively. The final dataset included 573 Q-A sequences. See ‘Appendix A’ (supplementary materials) for the list of sampled recordings.
Coding
We coded each Q-A pair for its answer type using the same criteria as before (Table 2). We also coded two other predictors from Study 1: whether the response began with a fricative and whether the answer was partially repeated from the previous three utterances.
Measurement
The first author measured the response latencies for all 573 Q-A pairs using the same criteria as the first study. A research assistant naive to the purpose of the study re-measured 10% of the latencies. Of these, 79% showed less than 100 ms difference from their original measured values, and 98% showed less than 200 ms difference from their original measured values (inter-rater correlation: r 2 = ·98, p < ·001). Our final analyses excluded the 2·7% of latencies that were more than 2·5 SDs from the group mean. All the response latencies excluded as outliers were gaps, leaving 557 tokens for statistical analysis.
RESULTS AND DISCUSSION
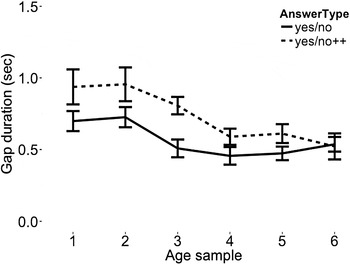
Children's timing showed significant effects of answer type, age, and an interaction between the two. We expected that response latencies would be longer for yn++ than for yn answers overall, that both answer types would get faster with age, and that there would be a significant interaction between age and answer type, showing greater improvement for yn++ responses. We found significant support for all three predictions; indeed, the yn and yn++ response latencies converged by the final age sample (age 3;4–3;5; see Figure 7).
Response latencies for children's yn and yn++ responses with age.

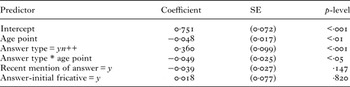
We tested these effects in a mixed-effects linear regression model of the children's response latencies that was built to match our analyses from Study 1. Thus, the model included fixed effects of age (age points 1–6), answer type (yes/no and yes/no++), whether the answer began with a fricative (yes or no), and whether material in the answer was mentioned in the previous three utterances (by the child, by the caregiver, or by neither); child was included as a random effect. The results of this model are given in Table 6.
Summary of the fixed effects in the model of children's response latencies for Study 2 (N = 557; log-likelihood = –404·1; df = 8). Answer type contrasts are with respect to simple yes/no responses.

Children's response latencies increased with the complexity of the answer: simple yes/no answers had significantly shorter latencies than yes/no++ answers (β = 0·36; SE = 0·099; p < ·001). This replicates the finding from our first study that greater response complexity shows longer response latencies in yes/no responses. Children's response latencies also decreased significantly with age (β = –0·048; SE = 0·017; p < ·001). Their median latency in the first age sample was 651 ms, but by the last sample it had reduced to 469 ms. Children's improvement with age also interacted with the answer type they produced: they improved more with the yn++ answer types than the yn answer types, which were already fast in the first sample (β = –0·049; SE = 0·025; p < ·05); more complex answer types may be slower at the start, but this leaves more room for improvement. The significant main effect of age here shows that children are improving their turn timing during early childhood (1;8–3;5), though the change was not visible in Study 1. The significant interaction between age and answer type supports the view that, despite the apparently gradual overall decrease in average turn timing, children get significantly faster within individual developmental trajectories that underlie the messier, more global patterns of question and answer in conversation.
In contrast to the first study, there were no significant effects of recency of answer material or fricative-initial answers (β = –0·039; SE = 0·027; p = ·147 and β = 0·018; SE = 0·077; p = ·82, respectively). This may be due to the simple fact that children frequently answer yes/no questions with forms of ‘yes’ and ‘no’, thereby limiting the number of fricative-initial responses (neither ‘yes’ nor ‘no’ begins with a fricative) and not yielding much benefit from recent mention (because both ‘yes’ and ‘no’ are high frequency and easy to retrieve).
GENERAL DISCUSSION
When young children take turns in spontaneous conversation, their timing is slower than that of adults. Achieving minimal gap and minimal overlap in turn-taking requires a lot of practice. Even in our oldest age sample, children averaged response latencies that were longer than their caregivers’, and much longer than turns in adult–adult speech (Stivers et al., Reference Stivers, Enfield, Brown, Englert, Hayashi, Heinemann, Hoymann, Rossano, de Ruiter, Yoon and Levinson2009). In both our studies we found that the complexity of children's answers significantly predicted their response latencies: the more complex the answer, the longer the response latency. In both studies, from the earliest sample on, children's timing was fastest when they gave basic answers (e.g. simple yes/no answers) compared to more complex ones (e.g. wh-, or complex yes/no answers). Our results support the view that, although children's timing reveals little development on the surface, many changes are brewing underneath. In the present case, we showed that specific answer types become faster with development, despite children's and caregivers’ constant addition of new sources of complexity.
Quite a lot changes in the conversational environment between 1;8 and 3;5 – the types of questions children hear from their caregivers, the types of answers they choose to give, and their general linguistic abilities, all of which are probably interconnected. For example, we see simultaneous change in children's answer types, their answer complexity, and their caregivers information-seeking questions with age (Figure 5). Children shift from one- to two-morpheme utterances around age two, while their caregivers increase the number of yes/no and wh- information-seeking questions they ask. Later on, after children begin responding to wh-questions with more-than-minimal responses (wh+), their parents dramatically increase the number of information-seeking wh-questions (Figure 5A2). All the while, child utterance length, lexical diversity, and caregiver question length steadily increase with age.
In addition to the effects of age and answer complexity, we also found a marginal effect of recent mention in Study 1: children had shorter latencies when giving answers that contained recently mentioned material. This suggests that using a recently mentioned word may reduce planning demands on children as they formulate their answers, presumably by facilitating their access to lexical and syntactic units (just as with adults: Bock, Reference Bock1986; in natural conversation: Gries, Reference Gries2005; Reitter, Moore & Keller, Reference Reitter, Moore, Keller and Sun2006; but see also Healey, Purver & Howes, Reference Healey, Purver and Howes2014). Interestingly, children's median response latencies were fastest when they were repeating a word from their own recent speech compared to one from their caregivers' speech (Table 5A). This effect, however, was not replicated in Study 2, potentially because lexical retrieval is minimized in many yes/no responses.
Answers beginning with fricatives were significantly slower than those beginning with other segments in Study 1. We had coded fricatives at turn transition onsets and offsets because they can be difficult to measure in these noisy home recordings, but it is possible that there is a processing explanation behind this effect as well. Fifty-nine percent of the fricative-initial answers began with this/that, here's/there's, he/she/they, or the, which are used in grammatically more complex utterances and include later-acquired pronouns and demonstratives (see, e.g. E. V. Clark, Reference Clark, Bruner and Garton1978; E. V. Clark & Sengul, Reference Clark and Sengul1978). Answers beginning with these terms were substantially longer (MLU = 3·79) than other fricative-initial responses (MLU = 1·69) and occurred mainly in answers to wh-questions. If this effect is indeed due to processing effects, future work should test for the same effects with similar, non-fricative initial words across responses with a comparable range of complexity.
When children could answer with minimal latency, they did: the median latency for children's simple yes/no answers was close to the overall median for their caregivers (442 ms vs. 371 ms). So even though children under four are generally slower than adults, they already appear to be aware of the social imperative to provide answers with a minimal gap and minimal overlap. This result supports recent work on children's use of markers such as uh and um to mitigate upcoming delays (Casillas, Reference Casillas, Arnon, Casillas, Kurumada and Estigarribia2014). In contrast, adults' answers were consistent; caregivers showed no effects of complexity, age, or recency in their response timing.
Planning an answer
Integrating linguistic processing into turn structure is complicated. Proto-turn-taking begins as early as age three months, but managing adult-like entries into ongoing exchanges may not be achieved until age six or later (e.g. Snow, Reference Snow, Snow and Ferguson1977; Ervin-Tripp, Reference Ervin-Tripp, Ochs and Schieffelin1979; Hilbrink et al., Reference Hilbrink, Gattis and Levinson2015). We have shown that more complex answer types are associated with longer response latencies in children's spontaneous conversation. We propose that the mechanism underlying this relationship derives from the processing demands of formulating responses in real-time conversation.
Responding places demands on both comprehension and production. In comprehension, addressees must understand ongoing speech and identify upcoming turn ends by monitoring current topics under discussion, parsing incoming linguistic information, and making predictions about upcoming material (e.g. DeLong, Urbach & Kutas, Reference DeLong, Urbach and Kutas2005; Brown-Schmidt & Tanenhaus, Reference Brown-Schmidt and Tanenhaus2008; Levy, Reference Levy2008). In production, addressees must first settle on an answer, taking into account whatever obligatory material was projected by the prior turn (e.g. a locative phrase in response to a where question), plus any other factors such as choice of perspective, common ground, and anticipated problems. Then their answer has to be put into words, requiring retrieval of the relevant lexical information, positioning of grammatical components, accessing phonological forms, and applying syllabification for articulatory planning and execution (e.g. Levelt, Roelofs & Meyer, Reference Levelt, Roelofs and Meyer1999; Griffin & Bock, Reference Griffin and Bock2000; Levelt, Reference Levelt2001). Addressees must then monitor ongoing speech to find out when exactly to launch articulation. Given that answers in adult–adult conversation are usually produced with latencies under 200 ms (Stivers et al., Reference Stivers, Enfield, Brown, Englert, Hayashi, Heinemann, Hoymann, Rossano, de Ruiter, Yoon and Levinson2009), some production processes are likely to overlap with the end of the prior speaker's turn. The precise mechanisms by which adults accomplish this are still under investigation, but it is clear that accurate prediction of turn ends relies on linguistic information including lexical, prosodic, pragmatic, and non-verbal cues (Schegloff & Sacks, Reference Schegloff and Sacks1973; Ford & Thompson, Reference Ford and Thompson1996; de Ruiter et al., Reference de Ruiter, Mitterer and Enfield2006; Heritage & Clayman, Reference Heritage and Clayman2011; see also Levinson & Torreira, Reference Levinson and Torreira2015).
For children too, linguistic processing is an integral part of taking turns on time, but because their linguistic abilities are less sophisticated than adults', they may not be able to achieve the same rapid turn-taking patterns. We have shown here that differences in linguistic processing demands explain some variation in children's turn timing. For example, yes/no answers only require children to select ‘yes’, ‘no’, or to repeat a single phrase from the question (e.g. Would you like some more animals? – More animals!). As a result, they don't need to access additional information – all they need is already given in the adult's question. But wh-questions differ in the kind of information that must be retrieved and the complexity of the resulting response; while what, where, and who questions can often be answered with one word (or even with a gesture), why and when questions generally require more complex responses.
Question function is another source of variation in planning a response. Caregivers frequently use wh-questions as ‘test’ questions early on (e.g. What does an owl say? and Where's the circle?), and only start to use ‘true’ wh-questions as children get older, thereby adding another level of complexity to a familiar linguistic form (Shatz, Reference Shatz1979; Fitneva, Reference Fitneva and de Ruiter2012). In the studies presented here, we only looked at questions that were answered successfully. But planning demands may also affect questions that go unanswered. Before age four, children prefer to answer questions whose form is restricted over questions whose form is freer (e.g. requests for repair vs. rhetorical questions; Olsen-Fulero, Reference Olsen-Fulero.1982; Olsen-Fulero & Conforti, Reference Olsen-Fulero and Conforti1983), perhaps because restricted questions project smaller, more manageable answer sets.
The complexity of the response that children opt for also has an impact on how long children take to produce an answer. Children, especially as they grew older, added additional material to their yes/no responses (e.g. Is this the train track? – Yes, let's do the choo choo, and I'm gonna eat and then read, okay? – No no Mommy, I want to read them), sometimes even answering without a ‘yes’ or ‘no’ at all (e.g. You want me to read that to you? – Read this book first). The additional material children added usually involved alternatives, reasoning, or redirections in relation to the question asked, suggesting that when children add material, they often place further processing demands on their own speech with referents and syntactic structures that are not immediately available from the child's or adult's prior utterances. Children presumably opt for new material to achieve interactional goals linked to their co-participants (here, their caregivers).
One crucial follow-up to our proposal will be to test the relationship between response planning and turn timing more directly, with both experimental control of response complexity and analysis of variation in individual children as well as groups. For example, gestural answers to yes/no and wh-questions should require less effort than verbal responses and so should be faster (E. V. Clark & Lindsey, Reference Clark and Lindsey2015). With respect to variation across groups, children from different cultural or socioeconomic backgrounds might arrive at adult-like timing earlier or later than reported here. There is wide variation in the number of opportunities children have to practice answering questions. Studies relating to child-rearing practices in the US and Italy report that middle-class and big-city parents are more likely to engage in pedagogical talk with their children about what is happening (e.g. in a book, on a show, in the present moment) than lower-class and small-village parents (Hart & Risley, Reference Hart and Risley1992; Camaioni, Longobardi, Venuti & Bornstein, Reference Camaioni, Longobardi, Venuti and Bornstein1998; Weisleder & Fernald, Reference Weisleder and Fernald2013). Despite such variation, we would still expect answer types to emerge in the same general order, just not necessarily at the same age, in different social and cultural groups.
This study has highlighted a domain where language and interactional skills are closely entwined during language acquisition: conversational turn-taking. Although turn-taking begins to emerge in infancy, children must learn how to integrate turn-taking with language production in order to become fully skilled participants in conversation. In coming to understand how children develop turn-taking skills, we can also uncover how children take an active role in their own language learning. Taking turns allows children to get feedback from other speakers, to adopt more complex ways of coordinating with others, and to test hypotheses about the language they hear around them. These outcomes are all critical in interaction, and all stem from organized turn-taking. It takes children several years to achieve the appropriate timing for their turn-taking, but once they succeed, they are on their way to making full use of the rich, finely tuned mode of communication we know as ‘conversation’.
SUPPLEMENTARY MATERIALS
The supplementary material referred to in this paper can be found online at <http://www.journals.cambridge.org/JCL>.