Introduction
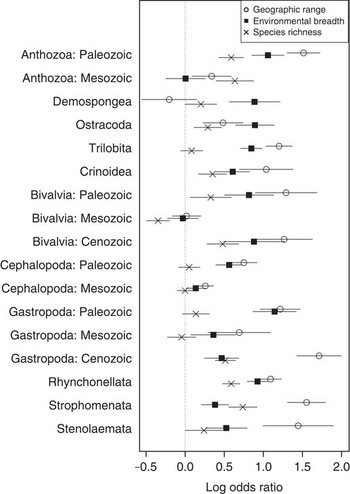
Analyses of the global fossil record show strong associations between the geographic range of marine animal taxa and their survival through time (e.g., Kiessling and Aberhan Reference Kiessling and Aberhan2007; Payne and Finnegan Reference Payne and Finnegan2007; Powell Reference Powell2007; Finnegan et al. Reference Finnegan, Payne and Wang2008, Reference Finnegan, Anderson, Harnik, Simpson, Tittensor, Byrnes, Finkel, Lindberg, Liow, Lockwood, Lotze, McClain, McGuire, O’Dea and Pandolfi2015; Foote et al. Reference Foote, Crampton, Beu and Cooper2008; Jablonski Reference Jablonski2008; Crampton et al. Reference Crampton, Cooper, Beu, Foote and Marshall2010; Harnik et al. Reference Harnik, Simpson and Payne2012). During the Mesozoic, however, geographic range fails to predict whether marine animal genera, in aggregate, survive past their stage of first occurrence (Foote and Miller, Reference Foote and Miller2013: Fig. 6); this same null result holds within bivalves, and the effect is minimal in cephalopods and gastropods (Foote and Miller Reference Foote and Miller2013: Fig. 9) (Fig. A1). Meanwhile, the odds of survival of established genera—those beyond their first stage of occurrence—remain strongly associated with geographic range (Foote and Miller Reference Foote and Miller2013: Fig. 8A), consistent with similar analyses (Jablonski and Raup Reference Jablonski and Raup1995; Kiessling and Aberhan Reference Kiessling and Aberhan2007; Payne and Finnegan Reference Payne and Finnegan2007; Harnik et al. Reference Harnik, Simpson and Payne2012; see “Discussion”). To probe this unexpected and unexplained result, we examine genus survivorship in the Mesozoic—specifically whether a genus survives beyond its stage of first appearance—using data from the Paleobiology Database (paleobiodb.org). We first consider the combined effects of geographic range and temporal heterogeneity in the data, specifically variation in stage duration, long-term trends in survivorship, and stage-to-stage variation in survivorship and geographic range. Next, for the subset of data representing the most diverse classes, we explore survival with respect to class membership, as well as superfamily membership for cephalopods. The best-fitting models consider both temporal and taxonomic heterogeneity and reveal a persistent, strong association between geographic range and survival.
Materials and Methods
We downloaded data on fossil occurrences of marine animals from the Paleobiology Database on 23 February 2012 and on 20 November 2013; the latter download was restricted to records entered after the date of the first download. We chose to add to the 2012 data in this way to avoid replicating the effort involved in vetting the initial data (for download and vetting protocols, see Foote and Miller Reference Foote and Miller2013; Foote et al. Reference Foote, Ritterbush and Miller2016). All told, the Phanerozoic data consist of occurrences of 25,757 genera during 79 stratigraphic intervals; here we focus on the stages of the Mesozoic.
Range and Survival through Mesozoic Time
We used logistic regression to model survival beyond the stage of first appearance as a function of geographic range, initially combining all 7511 genera with Mesozoic first appearances into a single, aggregate analysis. We assessed geographic range as the maximum great-circle distance (GCD) encompassing all occurrences of each genus in each stage. Distinguishing genera that occur first in a single location versus those with a larger range produces a binary variable that we use to predict genus survival. We used the great-circle range measure for consistency with our previous study (Foote and Miller Reference Foote and Miller2013); because roughly half of genera are known from a single pair of coordinates during their stage of first occurrence, other measures of range would yield similar results. Next, we added the stage in which each genus first appears as a predictor variable, including 30 stages from the Induan to the Maastrichtian. In one set of analyses we included the stages as an ordered time series to account for the general trend toward increased survival through the Mesozoic (see Foote and Miller Reference Foote and Miller2013: Fig. 2). Alternatively, we included them as levels of an unordered factor.
Range and Survival within and among Classes
We used logistic regression to model survival as a function of geographic range and of class membership, restricting the analysis to eight large classes that together include more than 75% of genera first appearing in the Mesozoic: Anthozoa, Bivalvia, Cephalopoda, Demospongea, Echinoidea, Gastropoda, Ostracoda, and Rhynchonellata. We compared results of models predicting survival as a function of range only; class membership only; and range plus class membership.
Within each of these classes we carried out regressions just as for the aggregate data, modeling survival as a function of range alone and range plus stage of first occurrence. In addition, to portray among-class variation in range and survival, we tabulated the proportion of genera in each class that were initially widespread (occurring in more than a single location) and the proportion that survived their first stage. We further examined trends within cephalopods by assigning genera to superfamilies, using opinions collected in the Paleobiology Database and references from Treatise volumes and recent literature (Arkell et al. Reference Arkell, Kummel and Wright1957; Tozer Reference Tozer1981; Donovan et al. Reference Donovan, Callomon and Howarth1981; Page Reference Page1996; Wright et al. Reference Wright, Calloman and Howarth1996; Dagys Reference Dagys1997; Guex et al. Reference Guex, Hungerbühler, Jenks, O’Dogherty, Atudorei, Taylor, Bucher and Bartolini2010; Hoffman and Keupp Reference Hoffmann and Keupp2010; Ware et al. Reference Ware, Jenks, Hautmann and Bucher2011; Galácz and Kassai Reference Galácz and Kassai2012; Bruhwiler et al. Reference Bruhwiler, Bucher, Goudemand and Galfetti2012; Howarth Reference Howarth2013; Shigeta and Nguyen Reference Shigeta and Nguyen2014). Of Paleobiology Database taxonomic opinions, we selected the most recently published and those cited with evidence to sort genera into subfamilies, then families, then superfamilies, when applicable. We grouped genera into orders for Belemnitida and Nautilida, and binned 9.3% of the cephalopod genera lacking higher taxon assignments into “other cephalopods.” Combining just the higher taxa of cephalopods with 20 or more genera, we modeled survival as a function of geographic range, with stage of first occurrence and superfamily membership as additional factors.
Results
Range, Survival, and Geologic Stage
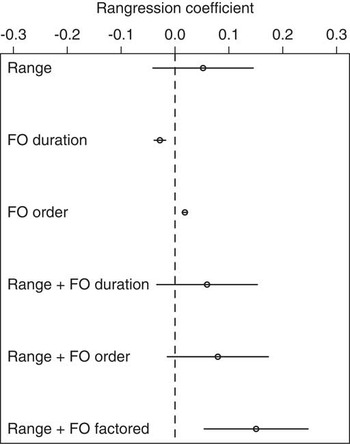
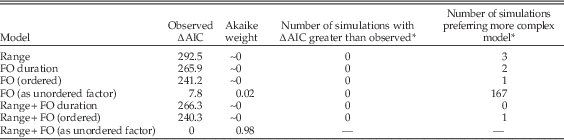
Genus geographic range alone is not a significant predictor of survival when genera from all animal groups and Mesozoic stages are combined (Fig. 1, Table 1). The duration of the stage of first occurrence is negatively associated with survival; a longer stage appears to carry greater extinction risk. This result is consistent with the expected scaling between proportional extinction and interval length in a homogeneous birth–death model (Foote Reference Foote1994: Fig. 2). (It is likely that longer stages also spuriously inflate geographic range by aggregating noncoeval occurrences; however, stage length and range of new genera are virtually uncorrelated in our data: r=0.011, p=0.347 for all genera; and r=0.017, p=0.318 if we omit genera with point occurrences.) The order of the stage of first occurrence is positively associated with survival; survivorship rates increase over time when all genera are pooled (Foote and Miller Reference Foote and Miller2013: Fig. 2). Survival levels of new genera vary dramatically between stages, from a low of 22.5% during the Olenekian to a high of 68.8% during the Aalenian. Genus geographic range is not a predictor of survival when combined with either stage duration or stage order in a logistic regression (Fig. 1). When the logistic regression includes stage as an unordered factor, however, a widespread geographic range contributes significantly to survival (with a moderate increase in effect size). This result suggests that there may be an among-stage relationship between the proportion of genera that are widespread and the proportion that survive, a relationship that obscures differential survival of genera with different ranges within a stage. We will return to this possibility below. Table 1 includes the Akaike information criterion (AIC) and Akaike weight for the models. The greatest Akaike weight is allotted to the model with the greatest likelihood, adjusted for the number of parameters (Burnham and Anderson Reference Burnham and Anderson2002). The best-fitting model predicts survival as a function of geographic range and stage of first appearance (as a factor rather than an ordered variate). According to this model, widespread genera have odds of survival about 15% higher than restricted genera, once stage of first occurrence is accounted for (see Table 1).
Results of logistic regression models predicting survival as a function of range and/or stage of first appearance. In this and subsequent figures, positive regression coefficients indicate higher relative odds of survival, and error bars are ±2 SE. Because geographic range is treated as a binary variate, the regression coefficient for this variate is precisely the same as the log odds ratio from a contingency table comparing range with survival. In this case, 2089 genera are restricted and fail to survive; 2129 are restricted and survive; 1588 are widespread and fail to survive; and 1705 are widespread and survive. Thus the odds of survival for restricted genera equals 2129/2089, or 1.019; that for widespread genera equals 1705/1588, or 1.074; and the odds ratio is equal to (2089×1705)/(1588×2129), or 1.074/1.019, or 1.053 (see line for “Range”). Duration and order of a genus’s stage of first occurrence yield significant negative and positive associations with survival, respectively (see lines for “FO duration” and “FO order”). Geographic range emerges a significant predictor of survival only when stage of first occurrence is included in the regression as an unordered factor (final three lines show the value attributed to range by each model).

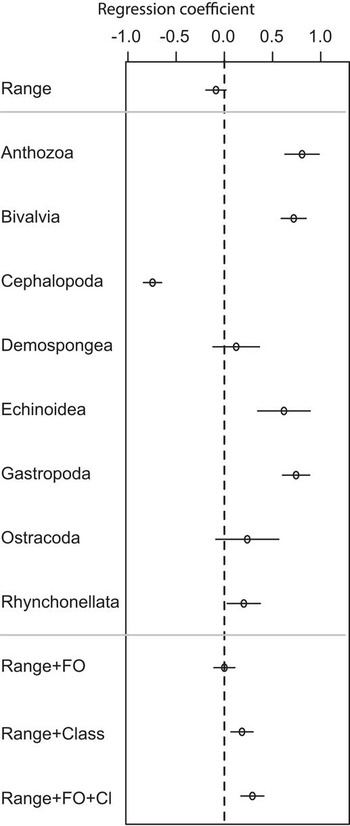
Results of logistic regression models predicting survival as a function of range and/or class membership. Genus geographic range alone is an insignificant predictor of genus survival for 5868 genera in the most diverse marine classes (see line for “Range”). Modeled as predictive factors, several classes have significantly higher or lower than average odds of survival (see lines for each class). Note the strong negative result for cephalopods. Range has a significant effect when combined with classes as predictive variables and a stronger effect (and better model fit, Table 2) when combined with both class and stage (final three lines show the value attributed to range by each model).

Coefficients for logistic regression models of survival predicted by geographic range and stage of first occurrence (FO) for 7511 genera first appearing in the Mesozoic. Bold indicates a significant result or best-fitting model.

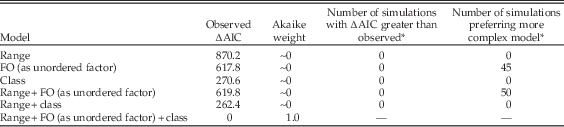
Given the complexity of the best-fitting model—31 parameters compared with two or three parameters for the simpler models—we carried out a test to explore the possibility of model overfitting (Burnham and Anderson Reference Burnham and Anderson2002). For each of the simpler models, we used the parameter estimates from the fitted model to obtain the predicted probability of survival for each genus. For example, if x 1 and x 2 are the geographic range and duration of stage of first appearance for a given genus in a model predicting survival from these two variates, then the modeled survival probability is equal to exp(α+β1 x 1+β2 x 2)/[1+exp(α+β1 x 1+β2 x 2)], where α is the intercept and β1 and β2 are the regression coefficients (Agresti Reference Agresti1990: p. 85). We simulated survival data by comparing a uniform random number for each genus with its survival probability. We then fitted the simpler and more complex models to the simulated data and noted the difference in AIC between the two, where the more complex model is always our preferred model predicting survival from range and stage of first appearance as a factor. The goal is to determine whether the more complex model fits better, even though the simulated data are known to be generated by the simpler model. This simulation was repeated 1000 times for each pair of models. Rarely does the more complex model fit better, and never is the simulated difference in AIC close to the observed difference (Table A1). Evidently, preference for the best-fitting model (Fig. 1, Table 1) is unlikely to be spurious.
Predicting Survivorship with Class and Geographic Range
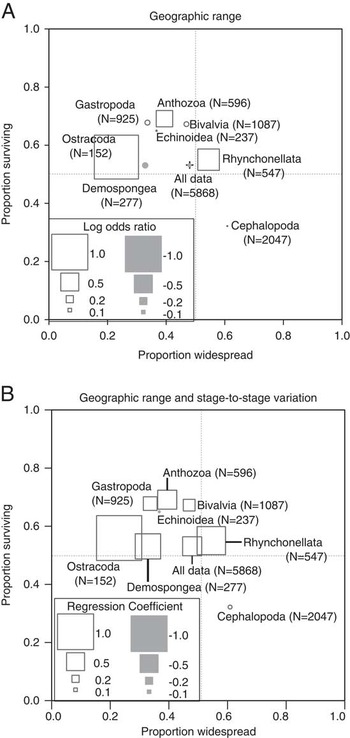
Results of models predicting survival as a function of range and class membership are shown in Figure 2. As for the aggregate analysis (Fig. 1), geographic range alone is not a significant predictor of survival for the eight principal classes combined. The central panel of Figure 2 shows the results when class alone is used as a factor to predict genus survival. Anthozoans had the highest genus survival rate, comparable to that of bivalves, gastropods, and echinoids, and considerably higher than that of demosponges, ostracodes, and rhynchonellate brachiopods. Cephalopods had the lowest survival by far. Finally, the bottom panel displays the results of combining class membership and geographic range to predict genus survival. Once class membership is taken into account, geographic range yields a significant positive regression coefficient (0.183, SE=0.057, p=0.0014), a value similar to that obtained when temporal variation is included. The effects attributable to each class are persistent. Thus, heterogeneity among classes obscures the effect of geographic range; in particular, as we will discuss below, the fact that cephalopod genera tend to be wider ranging and shorter lived than genera in other classes swamps the selectivity present in other classes. Once survival heterogeneity between classes is taken into account, widespread genera have about 20% greater odds of survival than restricted genera. Finally, the model combining range with both temporal and taxonomic heterogeneity yields the best fit to the survival data (Table 2). As with the results of Figure 2, simulations suggest that preference for this model is not a matter of overfitting (Table A2). Figure 3 displays the (natural) log odds ratio of association between geographic range and survival within each of the classes, both ignoring (Figure 3A) and accounting for stage-to-stage variation (Figure 3B).
Genus geographic range and survivorship within eight marine animal classes. Symbols indicate the proportion of constituent genera that are widespread (x-axis) and surviving (y-axis). Symbols shows magnitude of log odds ratio (keyed to symbol size), direction of association (open symbols for positive effect, filled for negative effect), and statistical significance of association (squares, p<0.05; circles, p≥0.05). A, Log odds ratios of association between geographic range and survival for genera in each class. B, Effect size attributable to geographic range once temporal heterogeneity (stage of first occurrence, treated as an unordered factor) is included in the model. Most classes show a positive, even if not significant, association between range and survival, which is generally strengthened when stage of first occurrence is taken into account.

Coefficients of logistic regression models for survival predicted by geographic range, class, and stage of first occurrence (as an unordered factor) for 5868 genera in eight target classes. Bold indicates a significant result or best-fitting model.

Cephalopods: Closer Scrutiny of Temporal and Taxonomic Heterogeneity
Null Results for Range
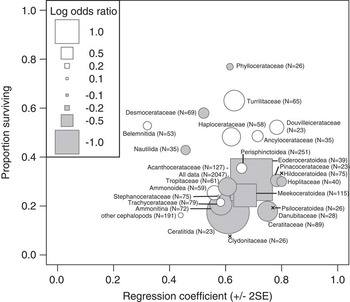
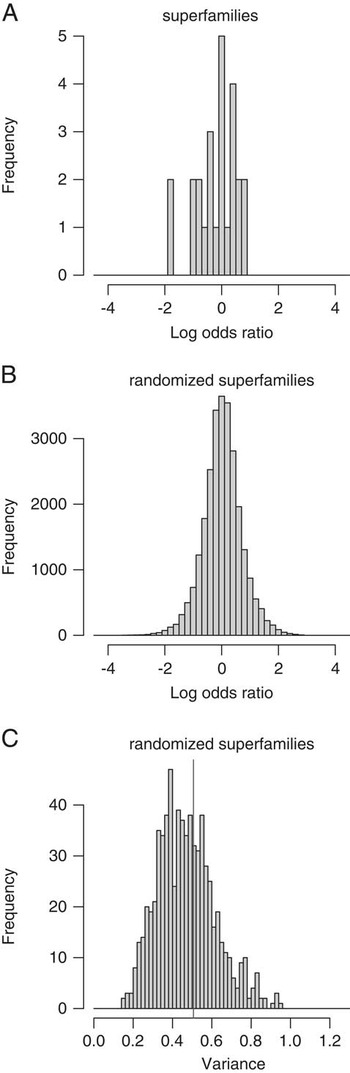
Geographic range, as dichotomized herein, does not significantly predict survival of new Mesozoic cephalopod genera, even if stage or superfamily are included as predictive variables (Table 3). The association between range and survival varies within each geologic stage but is only significant for a few stages. The association between range and survival varies across time within each superfamily but is only significant in the Eoderoceratoidea and Meekoceratoidea, in which restricted genera survived preferentially (Fig. 4). Moreover, selectivity with respect to geographic range differs between superfamilies across a spectrum commensurate with what could be expected if the cephalopod genera are aggregated irrespective of evolutionary heritage. Figure 5A shows the numbers of superfamilies demonstrating a spectrum of range-survival associations (from the analysis shown in Fig. 4). We assigned each Mesozoic cephalopod genus to a randomly simulated superfamily, keeping the sizes of these superfamilies the same as the real ones, and repeated the analysis for 1000 iterations. Figure 5B shows that the randomization creates a distribution of range–survival associations similar to the observed distribution. Finally, Figure 5C shows a histogram of the variance of the distribution of log odds ratios from each of the 1000 randomizations, with a thin vertical line noting the variance from the original analysis, which fits well within the distribution of randomized results. Thus, the heterogeneity among real superfamilies is within the range of what would be expected as a result of stochastic variation if genera came from a common statistical population.
Genus geographic range and survivorship within 26 superfamilies of Cephalopoda. Only superfamilies (or combined groups: belemnites, nautiloids, and “other cephalopods” lacking superfamily assignment) with at least 20 genera are shown. Symbols as in Fig. 3 (note the log odds ratio of Eoderoceratoidea is −1.76). Superfamilies are highly variable in geographic range, survivorship, and the magnitude and direction of association between the two (but see Fig. 5).

Histograms showing log odds ratios of the association between cephalopod genus initial geographic range and initial survival. A, Log odds ratios for the cephalopod superfamilies shown in Fig. 4. B, Log odds ratios obtained by randomly assigning 2047 new Mesozoic cephalopod genera into 26 synthetic “superfamilies” corresponding in genus richness to the actual superfamilies. C, Variance of the log odds ratios for the 26 synthetic “superfamilies.” Results in B and C based on 1000 randomizations. The vertical line indicates the variance of the log odds ratios for the actual superfamilies (0.506). Heterogeneity among superfamilies in the association between range and survival is generally no greater than would be expected by chance.

Regression coefficients of geographic range from logistic regression models predicting survival by geographic range, stage of first occurrence, and superfamily membership for 2047 cephalopod genera.

Importance of How Range Is Scaled
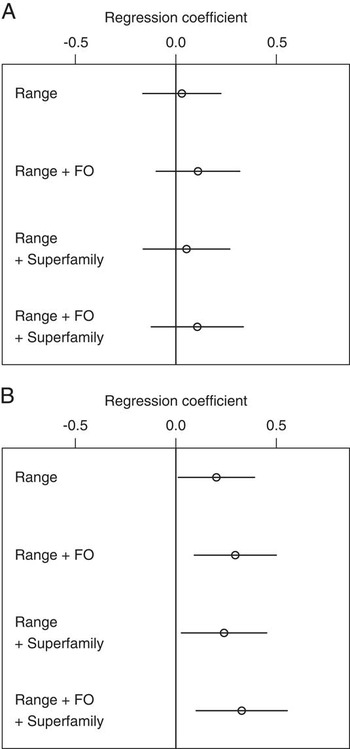
Cephalopods account for more than a quarter of new Mesozoic genera but demonstrate an apparent lack of survival sensitivity to range. Because cephalopods contain the highest proportion of widespread genera of all the classes (Fig. 3), we reclassified new cephalopod genus ranges as widespread or restricted based on the median first-stage range within the class (a GCD of ~370 km). Defining “widespread” as having a range greater than the cephalopod median, we see that widespread cephalopod genera have significantly higher odds of survival than restricted genera (Fig. 6, Table 4). Including temporal and taxonomic (superfamily) heterogeneity increases the effect of range and increases the model fit (Table 4). Cephalopod survival clearly depended on geographic range but with a different sensitivity compared with other classes.
Logistic regression coefficients for variables predicting the survival of Mesozoic cephalopod genera. A, When range is defined with respect to the median initial value across animal classes (point occurrence vs. greater range), none of the tested factors significantly predict cephalopod survival. B, When a widespread range is defined as greater than the median initial cephalopod range (370 km), each test significantly predicts cephalopod survival. The best supported model (Table 4) combines range, stage of first occurrence (as a factor), and superfamily membership to predict survival, and yields the highest coefficient for range.

Regression coefficients of geographic range from logistic regression models predicting survival by geographic range (with widespread genera taken to be those with a range greater than the cephalopod median), stage of first occurrence, and superfamily membership for 2047 cephalopod genera. Bold indicates significant results or best-fitting model.

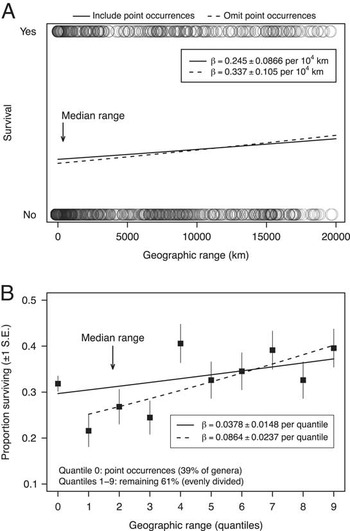
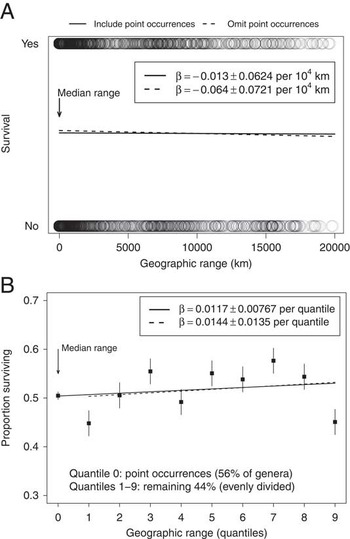
We can gain some insight into the cephalopod results by probing the relationship between range and survival in more detail. Figure 7 shows logistic regression results when geographic range is expressed along its full continuum of values or when it is divided into quantiles. Geographic range has a clear, positive effect on survival, even disregarding factors such as stage of first occurrence and superfamily membership. However, for reasons that are not clear, genera known from point occurrences have nearly the same proportional survival (31.8%) as all other genera combined (32.4%). Thus the effect of range is obscured when we dichotomize ranges as point occurrences versus all others. Whereas dissecting the full spectrum of geographic range reveals selectivity within cephalopods that is not apparent with dichotomized ranges, the same is not the case for Mesozoic animal genera in aggregate (Fig. 8), for which additional predictors still need to be taken into account to detect the effects of geographic range.
Logistic regression of cephalopod survival with respect to geographic range, treated as a continuous variate (A) or quantized (B) rather than dichotomous. No other factors, such as stage of first occurrence, are included as predictors. Regression coefficients (β) show effect of range on the log odds of survival; regression lines translate this effect into the expected proportion surviving: P(x)=exp(α+βx)/[1+exp(α+βx)]. (Proportional survival by quantile is superimposed in A; the regression is not fitted to these points but rather to range and survival for all genera.) All regressions are significant at p<0.01. Treating range as a binary variable (e.g., Fig. 6) discards information and thereby obscures the influence of range on survival. Moreover, genera known from point occurrences have unexpectedly high survival, for reasons that are unclear; their inclusion therefore diminishes the apparent effect of range on survival.

Logistic regressions for Mesozoic animal genera in aggregate, carried out as in Fig. 7. In contrast to cephalopods alone, the effect of geographic range cannot be discerned unless other factors, such as class membership and time of first appearance, are taken into account.

Survival Rates within Cephalopod Superfamilies Increase through Time
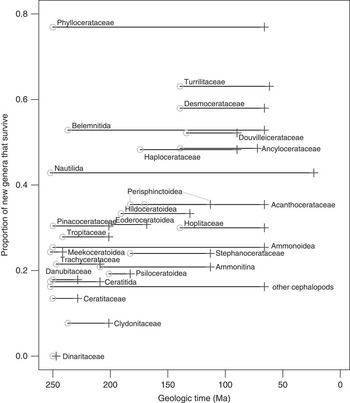
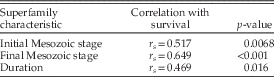
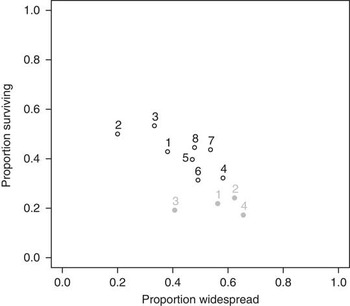
Increase in genus survival rates through the Mesozoic is a general feature of the entire data set analyzed (Foote and Miller Reference Foote and Miller2013: Fig. 2), and the superfamily-level analysis of cephalopods allows a more detailed examination of interaction between temporal trends and taxonomic sorting. Figure 9 shows a timeline with the durations of cephalopod superfamilies (x-axis) compared with the survivorship of their constituent genera (y-axis). The proportion of genera surviving past their stage of first appearance is positively correlated with Mesozoic values of superfamily origination time, superfamily termination time, and superfamily duration (Table 5). In Figure 8 we compare the survivorship and geographic range of constituent genera for superfamilies confined to the early Mesozoic (Early Triassic through Early Jurassic) with that of superfamilies that include occurrences in the late Mesozoic (Middle Jurassic through Late Cretaceous). When aggregated, superfamilies that last into the late Mesozoic have higher genus survivorship despite having fewer initially widespread taxa (exclusively early Mesozoic superfamilies have 54% widespread genera but only 22% survival, while late-lasting Mesozoic superfamilies have 48% widespread genera and 37% survival). Perhaps more importantly, early representatives of these late-lasting superfamilies have higher survivorship rates than contemporaneous genera belonging to early Mesozoic superfamilies, which suggests the possibility of a phylogenetic influence on initial genus survival rates (Fig. 8).
Differential survivorship within cephalopod superfamilies through time. Each line shows the duration of a superfamily in geologic time (x-axis) plotted to indicate the proportion of constituent genera that survive their stage of first occurrence (y-axis). Open circles indicate origination of the superfamily; crosses indicate termination (with respect to the Mesozoic or Recent). The axes also provide a scatter plot of significantly correlated variables. The crosses indicate a positive association between the time of superfamily termination and constituent genus survivorship. The circles indicate a positive association between the time of superfamily initiation and constituent survivorship. Spearman’s rank-order correlation coefficients are shown in Table 3.


Discussion
The results of this study show clear selectivity of survival of new genera with respect to geographic range during the Mesozoic. Variance in survival and average ranges through time and among taxa appears to explain the previous result, in which range did not predict survival of aggregated new Mesozoic genera (Foote and Miller Reference Foote and Miller2013). Nonetheless, survival sensitivity to geographic range is still weaker for new genera in the Mesozoic than other eras, in which widespread genera had much greater odds of initial survival despite taxonomic aggregation (log odds ratios >1.0; Foote and Miller Reference Foote and Miller2013: Fig. 6). Again, the emphasis of this study and our previous work was on new genera; selectivity is much more conspicuous when all taxa within a time interval are aggregated (Jablonski and Raup Reference Jablonski and Raup1995; Kiessling and Aberhan Reference Kiessling and Aberhan2007; Payne and Finnegan Reference Payne and Finnegan2007; Harnik et al. Reference Harnik, Simpson and Payne2012; Foote and Miller Reference Foote and Miller2013: Fig. 8).
Temporal Heterogeneity
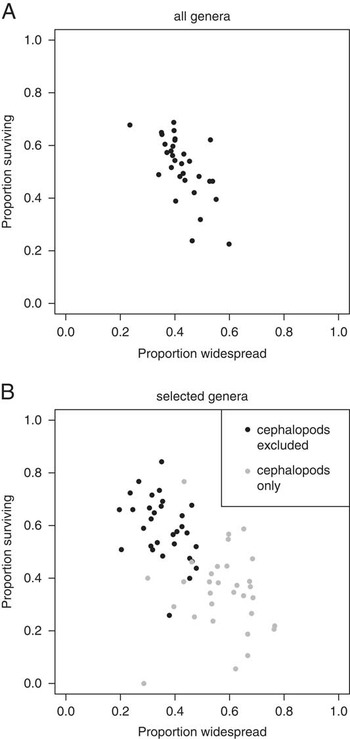
We find that we can detect the influence of geographic range on genus survival if we include stage of first occurrence as a factor in regression models (Fig. 1). Why should this be? Tabulating the proportion of genera that are widespread and the proportion that survive separately for each stage suggests a simple explanation. For reasons that are not clear, the stages that have a higher proportion of widespread genera also have a lower proportion surviving (Fig. 11A; r s =−0.66, p<0.001). Thus, the among-stage relationship between range and survival is opposite in direction to the within-stage relationship that has generally been documented, wherein coeval genera are compared and those that are more widespread are found to have higher chances of survival. Factoring out this among-stage variation allows the underlying differences among coeval genera to be detected.
One obvious potential explanation for the relationship depicted in Figure 11A is that both the proportion of surviving genera and the proportion of widespread genera are mutually influenced by sampling. Better sampling, all else being equal, could tend to yield broader geographic ranges. It could also decrease apparent survival, as genera found in a well-sampled interval would be less likely to be recovered in a subsequent interval with “normal” sampling, even if they truly survived. To explore this possibility, we used the standard gap approach (Paul Reference Paul1982, as modified by Foote and Raup Reference Foote and Raup1996) to estimate the aggregate per-genus sampling probability for each stage. We then calculated the correlations between the first differences of the time series of sampling, proportion of widespread genera, and proportion of genera surviving past their stage of first appearance. The proportion of widespread genera is significantly correlated with the proportion of surviving genera (r s =−0.62, p<0.001). However, even though the correlations with sampling probability are in the postulated direction, they are weak and not significant (sampling vs. proportion widespread: r s =0.26, p=0.17; sampling vs. proportion surviving: r s =−0.18, p=0.35). Moreover, if genus range and survival were mutually influenced by sampling in such a way as to produce a negative among-stage correlation, as in Figure 11A, we would expect to see such a correlation outside the Mesozoic as well. But that is not the case (Paleozoic: raw values, r s =−0.18, p=0.30; first differences, r s =−0.03, p=0.84; Cenozoic: raw values, r s =0.31, p=0.36; first differences, r s =0.33, p=0.35). Thus, although we cannot specify the reason why Mesozoic stages with broader-ranging genera overall also tend to have lower survival on the whole, we can have some confidence that the relationship is not an artifact of temporal variation in sampling. Presumably a common underlying factor, yet to be determined, is at work.
Taxonomic Heterogeneity
Including class membership as a predictor of survival clarifies the influence of geographic range (Fig. 2), and the effect of range on survival is about as large in a model of range + class and in a model of range+stage of first occurrence. A model including both stage and class yields the best support (Table 2) and best clarifies the important role of initial geographic range. Once the class and stage of first occurrence are taken into account, widespread genera have about 29% higher odds of survival than restricted genera (Fig. 2, Table 2). Classes differ considerably in the strength of association between geographic range and survival, though most have a positive association once stage variation is included (compare symbol sizes in Fig. 3). For genera in aggregate, the apparent effect of geographic range on survival is diminished by the inclusion of cephalopods, which are numerically diverse, have a weak association between range and survival, and have lower than average survival rates and broader geographic ranges overall.
Cephalopods: Finer-Scale Examination of Taxonomic Heterogeneity in Survival
When a widespread or restricted geographic range is defined with respect to the median range of all new Mesozoic genera, geographic range does not significantly predict the survival of new cephalopod genera, even if temporal or taxonomic (superfamily) heterogeneity are included as predictive variables. If broad or narrow geographic range is instead defined with respect to the median geographic range of new Mesozoic cephalopod genera (~370 km), or if range is measured on a continuum, then geographic range does have a significant positive effect on survival. Acknowledging survival variation among stages and/or superfamilies clarifies the effect of geographic range and increases model fit, even though survival appears indifferent to range when most stages or superfamilies are considered individually.
Cephalopod survival rates increase substantially through the Mesozoic, even while cephalopod genera increasingly have restricted ranges (Figs. 9 and 10). This increase in survivorship could be influenced by organismal or emergent traits characteristic of the late-lasting superfamilies in particular, because early representatives of these superfamilies also have higher survivorship than contemporaneous members of early superfamilies (Fig. 10). Increases in survivorship within individual late-lasting superfamilies, however, may be additionally influenced by broad environmental or ecological changes, because survivorship increases among genera in other marine animal classes as well.
Comparison of early Mesozoic cephalopod superfamilies (restricted to the Early Triassic through Early Jurassic) and later-lasting superfamilies. Each point indicates the proportion of widespread genera and proportion of surviving genera within exclusively early (filled dots) or late-lasting (open circles) Mesozoic superfamilies during one epoch (here widespread range is evaluated relative to the median value for all cephalopods, as in analyses in Table 4). Points marked 1–3 represent Early, Middle, and Late Triassic; 4–6 represent Early, Middle, and Late Jurassic; and 7 and 8 represent Early and Late Cretaceous. Genera within later-lasting superfamilies have higher survival rates than contemporaneous genera from superfamilies restricted to the early Mesozoic.

Temporal and taxonomic heterogeneity in selective survival is so great, and in particular is structured in such a way that covariation in range and survival among stages and among classes opposes a positive association, that the signal is lost when aggregating all Mesozoic genera. This presents an example of Simpson’s paradox, wherein the trend within subsets of data is obscured by data aggregation (see Wang and Bush Reference Wang and Bush2008). Recognizing the importance of geographic range requires acknowledging stage-to-stage variation in both average survivorship and average geographic range, and differences between classes. When cephalopods are entirely excluded, a widespread geographic range imparts a 38.5% greater odds of survival for marine genera arising during the Mesozoic (p≪0.001 for 5464 genera, with stage-to-stage and class variation included). Because cephalopods have lower survivorship and broader ranges on the whole, they contribute heavily to the negative among-stage correlation between average range and average survivorship (Fig. 11B). However, even if they are excluded, this correlation, albeit weaker, persists (Fig. 11B; when cephalopods are excluded, r s =−0.45, p<0.05).
A, Proportion of genera that are widespread (x-axis) and proportion of genera that survive their first stage of occurrence (y-axis) tabulated for each stage of the Mesozoic (n=7511; r s =−0.66, p<0.001). B, Tabulations of data for all marine genera except cephalopods (n=5464; black dots; r s =−0.45, p<0.05) show a negative relationship between range and survival among stages. Tabulations for cephalopods only (n=2047; gray dots; r s =0.15, p=0.43) show no significant trend. The very different properties of cephalopods compared with other genera may contribute to the overall negative trend among stages when all genera are aggregated.

In light of the steps needed to detect a signal of selectivity for new genera in the Mesozoic, a skeptic might suppose that our goal at the outset was to find such selectivity no matter how hard we had to tweak the data to do so. However, given what we know about temporal and taxonomic variation in average survivorship (Wang and Bush Reference Wang and Bush2008), these two sources of heterogeneity in survivorship and the range–survivorship relationship itself are the obvious ones to investigate. The Mesozoic is still different from the rest of the Phanerozoic, for which even a crude aggregate analysis reveals strong selectivity (Foote and Miller Reference Foote and Miller2013). Mesozoic selectivity in new genera may be more subtle and more complex, but it is real.
Conclusions
Initial geographic range positively influences survival for Mesozoic genera, but the ability to detect selectivity with respect to range is complicated by temporal and taxonomic heterogeneity in the data. Considering variation in survivorship and geographic range between stages and between classes allows us to document geographic range as a positive correlate of survival and to understand our previous and unexpected result that Mesozoic genera in aggregate show no consistent relationship between range and survival.
Acknowledgments
We thank the contributors to the Paleobiology Database (paleobiodb.org) for their commitment to building a community resource. Major contributors to the data used herein include: M. Aberhan, J. Alroy, D. Bottjer, M. Carrano, M. Clapham, S. Finnegan, F. Fürsich, S. Gouwy, N. Heim, A. Hendy, S. Holland, M. Hopkins, L. Ivany, D. Jablonski, W. Kiessling, M. Kosnik, B. Kröger, A. McGowan, A. Miller, T. Olszewski, P. Novack-Gottshall, J. Pálfy, M. Patzkowsky, A. Stigall, M. Uhen, L. Villier, and P. Wagner. We also thank G. Hunt, D. Jablonski, A. I. Miller, and P. M. Smits for advice and discussion. Supported by NASA Exobiology (NNX10AQ44G).
Appendixes
Selectivity of genus survival within several higher taxa with respect to geographic range, environmental breadth, and species richness. Error bars are ±1 SE. This is a correction of Fig. 7 from Foote and Miller (Reference Foote and Miller2013), which contained several errors; to allow comparison with that figure, analyses are based on the data from that paper. Although selectivity of survival is stronger in some higher taxa during the Mesozoic than we reported previously, it is nonetheless generally weaker than during the Paleozoic and Cenozoic. See Foote and Miller (Reference Foote and Miller2013) for further details.