1. Introduction
The number of international migrants around the world reached 232 million in 2013. Of these, about 11 million were migrants of Mexican origin over the age of 15 years in the United States, representing more than 10% of the Mexican population in that age group [UN-DESA and OECD (2013)]. Because these migrants constitute such a large part of their economies of origin, researchers have sought to establish the effect of the change in labor supply on the wages of those who remain in Mexico [Aydemir and Borjas (Reference Aydemir and Borjas2006), Hanson (Reference Hanson and Borjas2007a), Mishra (Reference Mishra2007), Conover et al. (Reference Conover, Khamis and Pearlman2015)].
Previous studies, however, have not considered the effect of such migration on the gender wage gap. Mexico is still a country with relatively low female labor force participation: 44.3%, as compared with 53.7% in Latin America as a whole and 51.3% worldwide [UNDP (2013)], ranking 118th among the world's 140 countries. This low rate is one of the factors behind the country's high degree of gender inequality [WEF (2014)]. Mexico's high marriage rate and low rate of women's migration render it extreme among Latin American countries [Massey et al. (Reference Massey, Fischer and Capoferro2006)]. In the past two decades, however, women have increased their participation in the labor force: among urban households, female labor force participation rose from 40% in 1988 to 57% in 2010 [Campos-Vázquez et al. (Reference Campos-Vázquez, Hincapié and Rojas-Váldes2012)], a change that can be explained in part by changes in family structure caused by predominantly male migration to the United States [Raphael (Reference Raphael2013), Conover et al. (Reference Conover, Khamis and Pearlman2015)]. Women have also increased their participation in white-collar, male-dominated jobs focused on mental effort [Conover et al. (Reference Conover, Khamis and Pearlman2015)]. However, the precise effect on wages of such changes in the relative supply of male and female workers has not been analyzed for Mexico. In this study, we aim to establish their impact on the wage gap between men and women.
One of the obstacles to analyzing these effects is the difficulty in finding exogenous factors that increase the gap. Instead of phenomena that directly affect female labor force participation, this study uses the exogenous component of labor migration to the United States as the main factor modifying the gender composition of the Mexican labor market. The study relies on two peculiarities of Mexican migration to the United States: the greater proportion of men who migrate [Massey et al. (Reference Massey, Fischer and Capoferro2006), UN-DESA and OECD (2013)], and the concentration of the migration in specific states in central Mexico, a pattern that changed in the 1990s with a rise in migration from southern states [Massey et al. (Reference Massey, Rugh and Pren2010), Weeks et al. (Reference Weeks, Stoler and Jankowski2011)]. Our empirical strategy uses data from the Mexican censuses of 1990, 2000, and 2010 in municipalities with 10,000–100,000 inhabitants. These are the municipalities with greater rates of international migration, where such migration is concentrated among men. Specifically, we hypothesize that proximity to the U.S. border explains the mostly male migration in earlier periods. Thus, we expect to find a greater relative labor supply of men farther from the border in 1990, but decreasing over time. We use interactions of the census period and distance by rail to the U.S. border at the beginning of the twentieth century as instruments to analyze changes in the relative labor supply of men and women between regions and census periods. This use of historical distance from the border in international migration studies was first used by Demirgüç-Kunt et al. (Reference Demirgüç-Kunt, López Córdova, Martínez Pería and Woodruff2011) in a study of the impact of remittances on the banking sector.
To our knowledge, this is the first study analyzing the effect of changes in the relative labor supply of men and women on the gender wage gap in Mexico. Acemoglu et al. (Reference Acemoglu, Autor and Lyle2004) have studied a similar phenomenon in the context of a developed country, the United States, using differences in mobilization rates during World War II as the main factor modifying the labor force participation of women. They found that greater female labor force participation negatively affected the wages of men and women, with a greater negative effect on women. A 10% increase in the labor supply of women relative to men decreased women's wages by 7–8% and men's by 3–5%, implying an elasticity of substitution of approximately 3. The effect on men was concentrated among the unskilled. In a neoclassical theory of supply and demand, these results can be interpreted as showing that men and women in an aggregate production function are not perfect substitutes. Using a similar framework to examine the abolition of compulsory military service and sex ratios at birth in Italy as factors explaining the relative supply of male and female workers, De Giorgi et al. (Reference De Giorgi, Paccagnella, Pellizzari, Polachek, Tatsiramos and Zimmermann2015) also found evidence of imperfect substitutability with an elasticity of approximately 1. Freire (Reference Freire2011) analyzed the effects of the relative supply of men and women on wages in Brazil, examining rural–urban migration as the exogenous factor that produces changes in urban economies, and found that greater female participation increased the wage gap between men and women, with an estimated elasticity of substitution of 1.78. The imperfect substitutability of men and women in the latter two studies implies that female labor force participation has a substantial short-run effect on the wage gap. Instead of using push factors in the source economy as instruments for change in the relative supply of women and men in the urban destination economy, our study uses exogenous factors that increase migration to the United States, mainly by men, and it analyzes the effects on the source economy.
In addition to its direct effect on the relative supply of men and women, resulting from the decrease in the number of men in the economy, migration can also change the incentives to participate in the labor force. Among households receiving remittances, there is evidence of a decline in the labor supply of women, possibly due to an effect from this income [Amuedo-Dorantes and Pozo (Reference Amuedo-Dorantes and Pozo2006), Hanson (Reference Hanson2007b), Binzel and Assaad (Reference Binzel and Assaad2011)]. This phenomenon could affect the usefulness of our instrument if the resulting changes in relative labor supply are small. However, more recent studies suggest that there is no such impact among the women left behind [Wang (Reference Wang2018), Kan and Aytimur (Reference Kan and Emre Aytimur2019)], and that women in households with return migrants participate to a greater extent in the labor force [Mendola and Carletto (Reference Mendola and Carletto2012)]. More general changes in the relationships between men and women can also affect the incentives for female labor force participation. A smaller number of men may imply a lower expected probability of marriage, which could encourage more women to enter the labor force. Evidence from Mexico shows an overall positive impact of international migration on female labor force participation at the state level [Raphael (Reference Raphael2013), Conover et al. (Reference Conover, Khamis and Pearlman2015)]. As we will show, this also holds for the relative supply of hours of work at the municipality level.
Our results indicate that the elasticity of substitution between men and women is high, but not perfect. In our preferred specification, a 10% decrease in the labor supply of men causes an increase of 2.5% in women's wages and a 3.7% increase in men's, although the effect for women is not statistically significant. This result implies that a 10% reduction in the labor supply of men will increase the gender wage gap by 1.2 percentage points, with an elasticity of substitution of 8.64 between men and women and a labor demand curve elasticity of 2.71. Predominantly, male migration increases the gender wage gap in the short term. Our results are consistent with previous studies that imply imperfect substitution between men and women, although the degree of substitution we find is greater, except among the less educated population. These findings imply a lesser impact of increasing labor force participation on the gender wage gap. They and the related literature could be concealing the total effect of increased labor force participation of women who bring complementary skill sets to the labor market, increasing overall productivity [Weinstein (Reference Weinstein2017)]. We believe this issue in the Mexican labor market deserves further inquiry.
Previous studies have pointed out that men and women do not offer the same set of skills for the same level of education. Women tend to offer more cognitive and interpersonal than physical skills [Beaudry and Lewis (Reference Beaudry and Lewis2014)]. This difference could affect the gender mix of the labor force across sectors [Olivetti and Petrongolo (Reference Olivetti and Petrongolo2014)], one of the main sources of the gender wage gap [Blau and Kahn (Reference Blau and Kahn2017)]. This division of labor across activities or sectors has been used to show how changes in sectoral specialization, driven by public policy or openness to international trade, can change the relative income of men and women; these changes have repercussions beyond the labor market, affecting the probability of children's survival and shifts in expenditures on goods associated with men preferences [Qian (Reference Qian2008), Aguayo-Tellez et al. (Reference Aguayo-Tellez, Airola and Juhn2010)]. Men and women also tend to differ in their negotiating abilities, risk-taking, and social preferences [Azmat and Petrongolo (Reference Azmat and Petrongolo2014)]. In Mexico, women entering the labor force tend not to do so to the same extent in male-dominated occupations [Conover et al. (Reference Conover, Khamis and Pearlman2015)]. Thus, changes in the supply of one gender will have a greater effect on the wages of that gender: that is, as our results show, there is imperfect substitution between women and men.
In the next section, we provide the theoretical framework guiding the interpretation of our results. In section 3, we present data and the identification strategy. The results are presented in section 4, and in section 5, we offer some concluding remarks.
2. Theoretical framework
To analyze the effect of a change in the relative supply of men and women in the labor market caused by male migration, we follow the model in Acemoglu et al. (Reference Acemoglu, Autor and Lyle2004). This framework builds on the general assumption of competitive labor markets, where supply and demand determine wages without rigidities, and is, broadly speaking, based on neoclassical theory. Assume we have an aggregate Cobb–Douglas production function between capital K t and labor L t and that labor is composed of male M t and female F t workers through a constant elasticity of substitution function:

The elasticity of substitution between men and women is equal to σ mf = 1/1 − ρ, with ρ ≤ 1, where β represents the share of the income paid to capital. Assuming that labor is paid according to its marginal productivity in equilibrium, wages for men and women can be expressed as:


In this setting, it is assumed that the quantities F t and M t are exogenous and that $w_t^f$ and $w_t^m$
 are endogenous. We are interested in how male migration affects the wages of men and women through changes in the relative labor supply. If we assume that the number of women in the labor market remains constant, we need to know how changes in M t/F t affect wages without considering effects through $( \alpha _t^f F_t) ^{-\beta }$
 in either equation. Using logarithms and deriving expressions (2) and (3) with respect to log (M t/F t), we obtain:


The proportion of wages paid to men is $s_t = w_t^m M_t/w_t^m M_t + w_t^f F_t\;$ . Previous expressions show us that the effect on wages of a change in relative labor supply is not equal for men and women: the difference is − (1/σ mf). The last equality of equation (5) shows that the inverse of the derivative, σ m, is the short-run elasticity of labor demand for men. At the limit of infinite elasticity of substitution, meaning that men and women are perfect substitutes in the production function, we can expect that the effect on wages of a reduction in the male labor supply due to migration is positive and identical for men and women. On the other hand, if men and women are imperfect substitutes, we expect a greater positive effect on men's wages resulting from their reduced labor supply. Previous studies of the effect of international migration on wages in Mexico have either treated the effects on men and women separately or have considered them to be perfect substitutes [Aydemir and Borjas (Reference Aydemir and Borjas2006), Hanson (Reference Hanson and Borjas2007a), Mishra (Reference Mishra2007)]. Studies of the effects on women in the labor market concentrate on their incorporation into specific occupations or high-paid jobs, without analysis of the gender wage gap [Conover et al. (Reference Conover, Khamis and Pearlman2015)]. Intuitively, what equations (4) and (5) indicate is that changes in the labor supply of men have a greater impact on prices in their own labor market if other factors, such as capital, remain constant. They also indicate that changes in relative labor supply do not affect the specific productivity of men and women, measured by $\alpha _t^f$
 and $\alpha _t^m$
 , or other determinants of wages, such as bargaining power. This could not be true if women bring complementary skill sets to the labor market, increasing overall productivity, and if their greater labor force participation changes their bargaining power [Weinstein (Reference Weinstein2017)].
3. Data and empirical strategy
3.1 Data and descriptive statistics
Data for this study come from the expanded questionnaire of the Mexican population censuses for 1990, 2000, and 2010.Footnote 1 These censuses have information on labor force participation, hours worked in the previous week, and wages in the current year, as well as other variables including age, years of schooling, employment sector, locality size, and indigenous language. With these data, we can build variables at the municipality level for hourly wages, the population of men and women, and the number of hours worked. We include the population aged 18–60 years living in municipalities with 10,000–100,000 inhabitants, a total of 960 municipalities or metropolitan areas. In the estimation, we exclude 41 municipalities of the region of the country farthest from the border, where migration rates are very low, and four municipalities where there was no female labor force participation in some subsamples in 1990. The final sample includes 1,837,536 individuals with valid hourly wages in 915 municipalities.
International migration from Mexico to the United States is a phenomenon historically related to the distance from the border as well as to distance over railroad networks [Durand et al. (Reference Durand, Massey and Zenteno2001)]. Our identification strategy uses as an exogenous factor the migratory networks around the railways built at the end of the nineteenth century. The railways lowered the cost of transportation to the border, facilitating migration. We use the distance from the municipality to the nearest railway station added to the distance divided by 5 from the station to the border to capture the effect of the decrease in transportation costs due to the introduction of railroads. Then we find the lesser of that distance versus the direct distance to the border; we call this historical distance. This instrument has also been used to measure the impact of remittances on banking breadth at the municipality level using cross-sectional data for the year 2000 [Demirgüç-Kunt et al. (Reference Demirgüç-Kunt, López Córdova, Martínez Pería and Woodruff2011)]. If instead of reducing the costs of transportation due to railroads at the beginning of the twentieth century by a factor of five, we use a more conservative factor of three, that is, if we consider a lesser reduction of costs more correlated to the simple distance to the border [Coatsworth (Reference Coatsworth1979)], we find similar results in our main specifications.
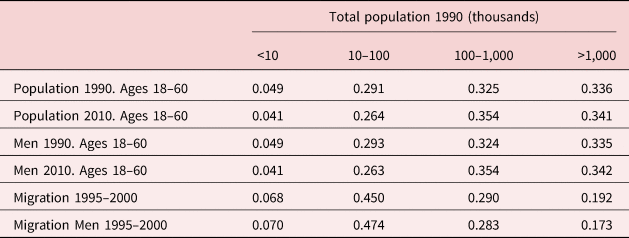
The importance of networks in explaining migration is clearest in the case of people with low income and a lack of access to credit. Their economic constraints can be overcome only through informal mechanisms of credit from prior migrants. Those with more resources might migrate as a family. In this case, the effect of the historical distance on relative population and hours worked on men and women is more noticeable in poorer municipalities or metropolitan areas: generally small municipalities with high rural populations or small cities. This phenomenon can be seen in Table 1. The proportion of the Mexican population aged 18–60 decreased in municipalities with fewer than 100,000 inhabitants, from 4.9% in 1990 to 4.1% in 2010 in municipalities with fewer than 10,000 inhabitants, and from 29.1% to 26.4% in those with populations between 10,000 and 100,000 (these figures exclude municipalities that are part of larger metropolitan areas). This population loss is even greater if we focus only on men. The last two rows show migration data from 1995 to 2010 by size of municipality. Here we can see that close to 52% of international migrants who left at least one household member in Mexico come from municipalities with fewer than 100,000 inhabitants. In addition, male involvement in migration is greater in this type of municipality. Our analysis thus focuses on municipalities with less than 100,000 inhabitants. We exclude those with populations less than 10,000: our variable of hours worked is constructed from a sample of 10% of the population and women's labor force participation is low, which could lead to high measurement error in these smaller municipalities.
Migration and municipality size

Notes: Data come from the 1990, 2000, and 2010 Mexican census expanded questionnaire sample using expansion factors. Data consider metropolitan areas as one municipality according to the classification of SEDESOL, CONAPO, and INEGI (2004).
3.2 Preliminary evidence
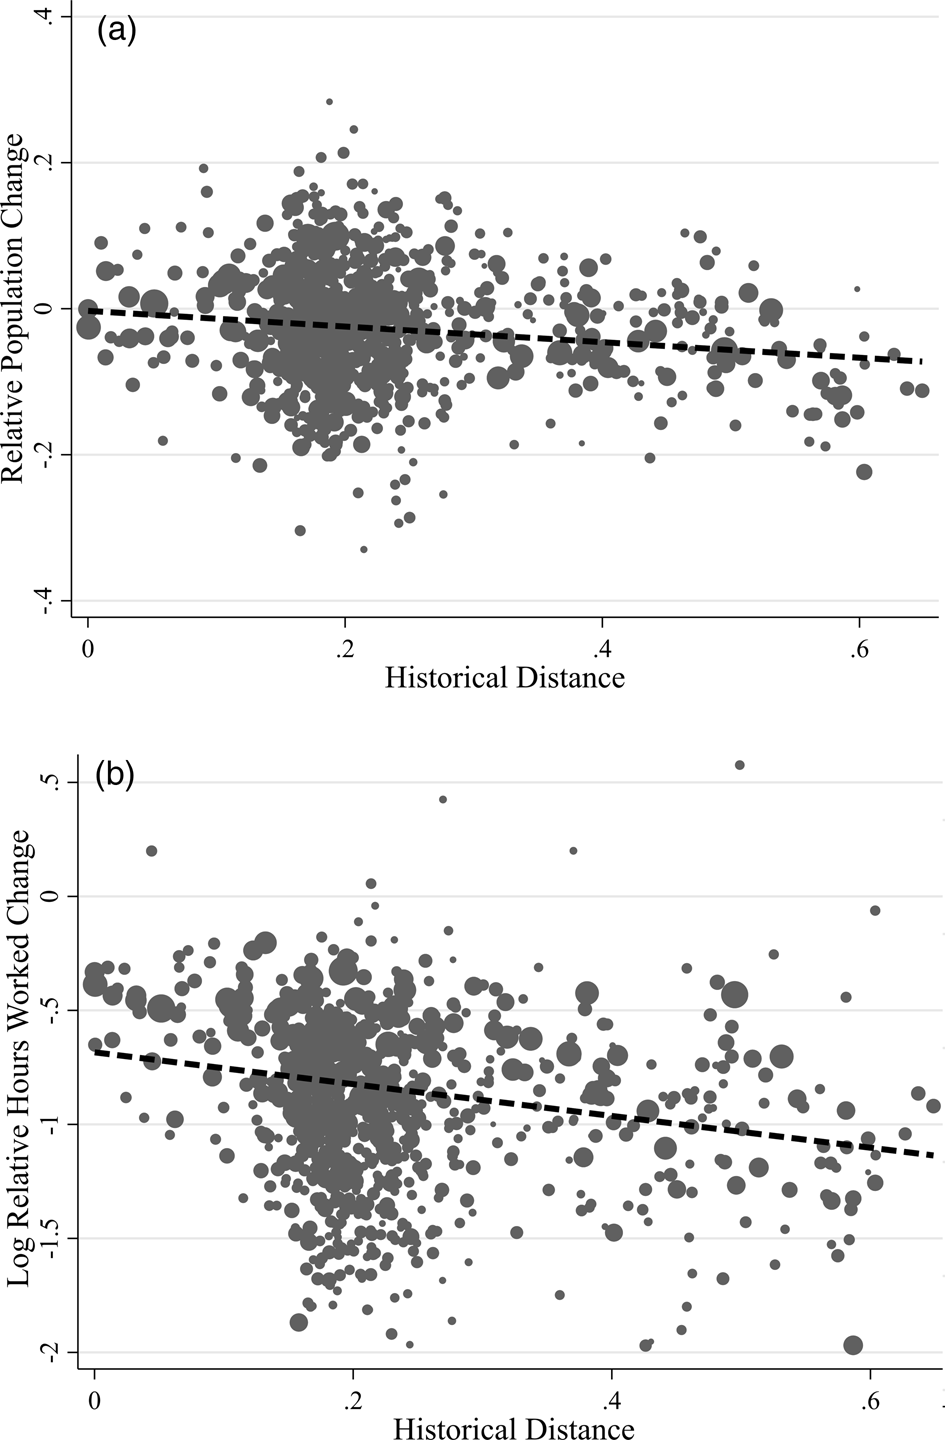
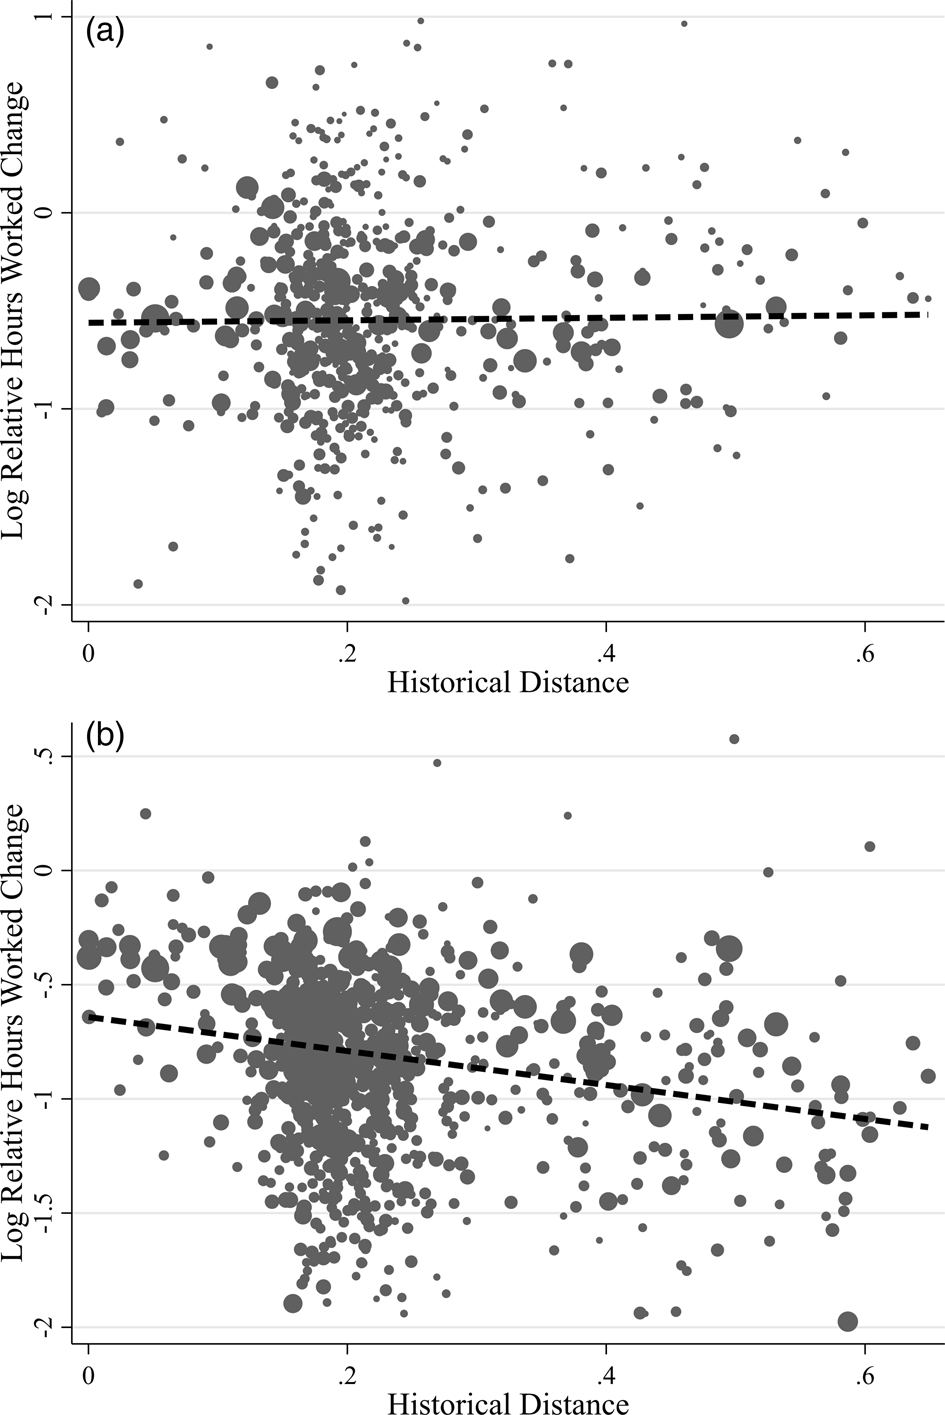
The relationship between the historical distance from the U.S. border and the relative numbers of men and women in the population and hours worked can be seen in Figure 1. The y-axis shows the change in the ratio of men to women (panel A) and the ratio of hours worked by men and women (panel B) at the municipality level, from 1990 to 2010, and the x-axis the historical distance from the border. Each point represents a municipality weighted by the size of its labor force aged 18–60. We can see in this figure that as the distance from the border increases, there is a decrease in the male proportion of the population between 1990 and 2010, consistent with the participation of the most distant municipalities in a mostly male phenomenon of migration [Massey et al. (Reference Massey, Rugh and Pren2010), Weeks et al. (Reference Weeks, Stoler and Jankowski2011)].
Historical distance by railroad and changes in population and relative hours worked, 1990–2010. (A) Population. (B) Hours worked.
Notes: Data include municipalities with a population of 10,000–100,000, and exclude the Yucatan region, where international migration is extremely low. Historical distance is in thousands of kilometers. Linear fit is weighted by the total labor force in 1990. Relative population is the ratio of men to women. Relative hours is the ratio of hours worked by men to those worked by women.

The slope of the regression line in panel A is −0.107 (s.e. 0.021). This coefficient multiplied by the mean historical distance of the municipalities of the southern states (Oaxaca, Guerrero, and Chiapas) from the border results in a decrease in the male population of 4.35%. The slope in panel B is −0.697 (s.e. 0.096), which means a decrease in the relative supply of hours worked by men in these states of approximately 28.3%. In both cases, the slopes are statistically significant. These data suggest that besides the direct effect on relative labor supply due to mostly male migration, there is another effect from the larger changes in labor supply of women farther from the border. This observation is consistent with the changes in incentives to women's labor force participation resulting from the migration of men [Raphael (Reference Raphael2013), Conover et al. (Reference Conover, Khamis and Pearlman2015)]. The structural interpretation of our results developed in section 2 requires a stable female labor force participation. However, this requirement is only for the direct effect, not the elasticity of substitution between men and women—the parameter of interest in our approach. Changes in participation affect our estimates only if women entering the labor market as a response to men's migration have different productivity; however, if we control for variables correlated with productivity, such as schooling and age, our estimates of elasticity of substitution remain almost unchanged.
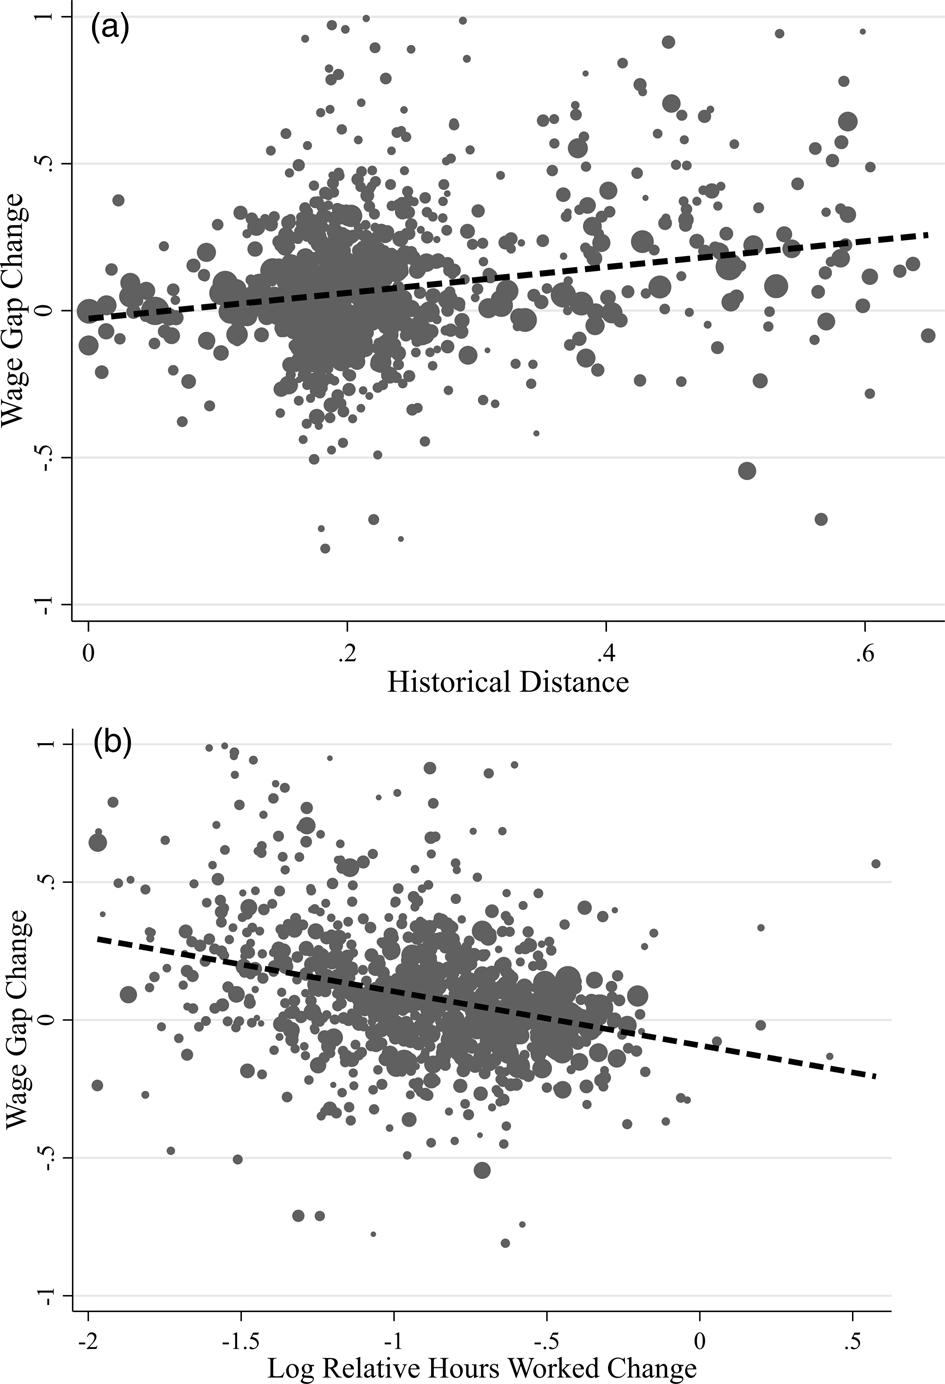
Figure 2 shows the relationship between the distance from the border, changes in relative labor supply, and changes in the gender wage gap. In panel A, each dot represents the combination of historical distance and the change in the gender wage gap at the municipality level. The graph shows the change in the wage gap between men and women in each municipality obtained using an ordinary least squares (OLS) regression of the logarithm of wages, with a dummy for men as explanatory variable, after controlling for age, age2, and schooling. There is an increase in the gender gap as we move to the more remote municipalities, with a coefficient of regression of 0.439 (s.e. 0.056). This parameter, multiplied by the distance from the southern states to the border, means that the adjusted wage gap increased by approximately 19 log points. Panel B provides additional preliminary evidence, showing the relationship between the change in the relative number of hours worked and the change in the wage gap: a decrease in the number of hours worked by men increases the wage gap, consistent with imperfect substitution between men and women in the labor market. The slope of the OLS regression is −0.196 (s.e 0.018); a decrease of 10% in the relative supply of male workers corresponds to an increase in the gender wage gap of 2 percentage points. With the empirical strategy described in the next section, we find similar results.
Wage gap change, 1990–2010; historical distance and relative supply change. (A) Distance and wage gap. (B) Relative supply and wage gap.
Notes: Historical distance in thousands of kilometers. Linear fit weighted by total labor force in 1990.

3.3 Empirical strategy
We estimate the following regression based on the theoretical model described in section 2 and equations (4) and (5), which shows the relationship between the logarithm of relative supply and the logarithm of wages for men and women:

The equation estimates hourly wages for individual i in municipality s and period t, men and women jointly, with α s an effect for each municipality. This allows us to control for fixed differences in wages between municipalities. For example, if there is greater economic activity closer to roads, and roads also facilitated early education efforts favorable to women's rights, it is not necessary to include these variables, which were relatively fixed in that period, as it would be in studies using cross-sectional data. The term γ t is an effect for each census period, g i represents an effect for men, and X ist is a set of individual or municipality control variables. We allow $\beta _t^g$ to vary in each of the three census periods and according to the sex of the individual. The parameters of interest are θ and φ. The former measures the elasticity of wages with respect to the relative labor supply of men; the latter uses the interaction m ilog (M t/F t) to measure any further effect in the elasticity for men. According to our theoretical framework, the difference in elasticities between men and women corresponds to the identity between the estimated and structural parameters, φ = −(1/σ mf). In addition, the common effect has the relationship θ = −βs t + (1/σ mf)s t. We cluster standard errors at the municipality level [Bertrand et al. (Reference Bertrand, Duflo and Mullainathan2004), Cameron et al. (Reference Cameron, Gelbach and Miller2008)].
It is possible that current migration decisions are not exogenous to the evolution of wages. The decision to migrate depends on a comparison between the wages of the source and destination economies, among other factors. If an increase in wages inhibited migration and modified the relative labor supply, international migration would not be an exogenous factor and we could not interpret the OLS results as causal. However, the development of migration to the United States does include causes not related to current wages. Migratory networks have historical origins in densely populated places located near former railway lines. To avoid endogeneity between current migration and wages, we use the railway distance between the municipality or metropolitan area and the U.S. border in 1900 as the basis of our instrumental variables (IV). The use of this data as instrument was introduced to international migration studies of Mexico by Demirgüç-Kunt et al. (Reference Demirgüç-Kunt, López Córdova, Martínez Pería and Woodruff2011), who used cross-sectional data to measure the impact of remittances on the banking sector at the municipality level. We introduce changes to their IV strategy, first by using panel data, which allows us to control for unobservable fixed factors that could be correlated with a high degree of women's labor force participation and the gender wage gap. For example, if the more productive sectors are also those employing women, a high degree of women's labor force participation will be correlated with a low gender wage gap. If this characteristic is relatively fixed, our use of panel data will correct the bias. Second, recent changes in migratory patterns have resulted in southern states becoming one of the main points of origin of Mexican migrants [Massey et al. (Reference Massey, Rugh and Pren2010), Weeks et al. (Reference Weeks, Stoler and Jankowski2011)]. We would thus expect to find a greater relative labor supply of men farther from the border in 1990, but decreasing over time. If changes in other factors affecting wages are correlated with the historical distance from the border, our instruments would be invalid, so we must also introduce controls.
In the first stage, we use the interaction of the historical distance from the border with the census periods and with the dummy variables for sex and census period as instruments in the following way:


We have the same controls as in the main equation and effects for municipality, census period, and gender. The instruments are the interactions of the distance from the border of municipality D s with census period Y t, and the interactions of the dummy variable for men m i with distance from the border of municipality D s and census period Y t. Parameters δ t, ω t, ρ t, and $\vartheta _t$ capture the differential effect of distance from the border in different census periods on the relative labor supply of men and women. We expect that as distance from the border increases, there will be a larger labor supply of men in 1990, but that the proportion diminishes in 2000 and 2010, reflecting how incentives to migration began to offset the costs for low-wage migrants in the 1980s and 1990s, resulting in a surge of Mexican migration to the United States. In the case of women (m i = 0), substituting equations (7) and (8) into (6) shows that historical distance and its interactions affect women's wages only through parameters δ t in equation (7). Taking δ 1990 as baseline, we expect to find a negative value for δ 2000 and a larger negative value for δ 2010, that is, a lesser effect of distance on the relative labor supply of men over time.
4. Results
4.1 Main results
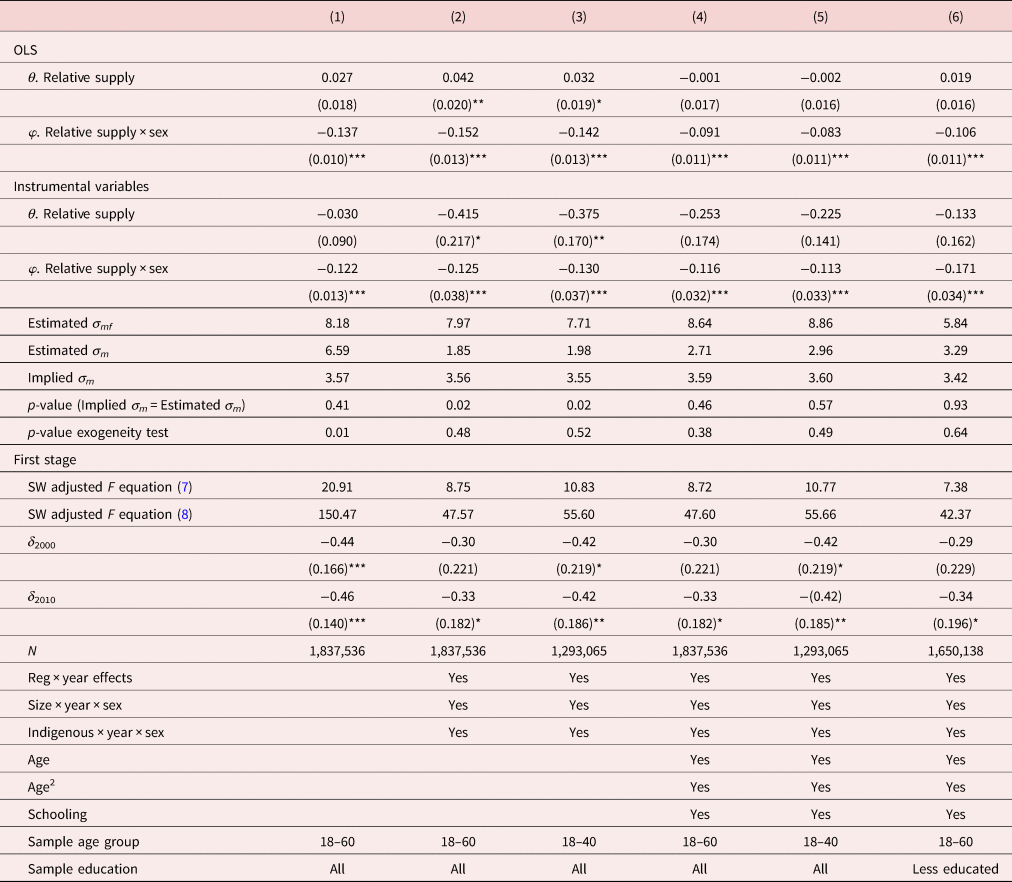
Table 2 presents the effect of relative labor supply on wages [equation (6)] with different sets of controls, using both OLS and IV. In column (1), we include sex, a fixed effect for each municipality, and a dummy variable for each census period, without additional controls. Each observation is weighted by the number of hours worked multiplied by an individual factor provided by INEGI. The OLS shows a negative φ and positive θ; the IV analysis shows both φ and θ negative. However, the sum of the variables in the IV analysis barely differs from that in the OLS. The specific effect on men's wages is similar in both methods. According to the theoretical framework described in section 2, the IV results are consistent with an elasticity of substitution between men and women of σ mf = 8.18. The short-run elasticity of labor demand for men, σ m, can be obtained from the results in two different ways. The first is the reciprocal of the sum of φ and θ. This is the estimated σ m in Table 2. The second is to use equation (5), which requires an estimate of the elasticity of substitution between men and women, σ mf, and data for β and s t. The first corresponds to the share of income paid to capital and the second to the proportion of the wages paid to men. We use β = 1/3, a common assumption [Acemoglu et al. (Reference Acemoglu, Autor and Lyle2004)], and s t = .76, from the 2000 census. The value of σ m calculated by this method is shown in the row labeled Implied σ m in Table 2. If the estimates actually correspond to structural parameters, both calculations should produce the same result: the next row shows the result of this test. In the first column of Table 2, the two methods give statistically indistinguishable results. When we have more than one endogenous variable, simple first-stage statistics are no longer valid as a test for weak instruments. For this reason, we also show adjusted F-statistics for the instruments in equations (7) and (8), following Sanderson and Windmeijer (Reference Sanderson and Windmeijer2016). In both cases, the set of instruments are jointly significant in the first stage with F-statistics far above 10.Footnote 2 A test of the over-identification restriction using Hansen's J-statistic is evidence against the null hypothesis that the instruments were correctly excluded from the main equation.
Relative labor supply and wages

All columns include as covariates a dummy of sex, effects for each census period, and fixed effects for each municipality. Municipalities with a population of 10,000–100,000 with the exception of the Yucatan region. Size is the total population in 1990. Indigenous is the share of population speaking an indigenous language in 1990. Historical distance High is taken from Demirgüç-Kunt et al. (Reference Demirgüç-Kunt, López Córdova, Martínez Pería and Woodruff2011). Less educated is population with ≤12 years of education. Clustered standard errors at municipality level in parentheses.
*p < 0.1; **p < 0.05; ***p < 0.01.
To determine whether the results of the first stage are consistent with a progressive relaxation of migration networks as a source of migration differences at the municipal level, we need to observe the results for the parameters δ 2000 and δ 2010. The statistically significant negative value of δ 2000 indicates that in 2000 the relative labor supply of men was lower than in 1990, moving further from the border, consistent with the progressive relaxation of the migratory networks that developed around the railway at the beginning of the twentieth century. The value of δ 2010 indicates a lower relative labor supply of men as the historical distance increases. However, this value suggests only a small further relaxation of migratory networks as a factor explaining migration in small municipalities.
It is possible that changes in relative labor supply between 1990 and 2010 are due not to historical distance, but to other factors correlated with it, whose effect on men's and women's wages has changed in recent decades, controlling for fixed effects at the municipality level and the temporal trends of the variables. This possibility would violate the exclusion criterion required for a more causal interpretation of IV, as shown by the data in column (1) of Table 2. The North American Free Trade Agreement (NAFTA), which took effect in 1994, could have affected municipalities based on their distance from the border, possibly improving wages near the border or changing incentives for women's participation in the labor force through sectoral changes in labor demand. Previous evidence shows that trade liberalization affected sectors with different labor force gender compositions [Aguayo-Tellez et al. (Reference Aguayo-Tellez, Airola and Juhn2010)]. These effects might have promoted migration from southern municipalities that had relatively low wages in 1990. In this case, the interaction of historical distance and census period would not be an exogenous factor changing the relative labor supply of men. To capture these possibilities and other factors correlated with distance that could affect wages and the relative labor supply, we include a set of interactions of region with census periods. One additional factor is that increasing distance from the border is accompanied by a higher proportion of indigenous population in the southern states of Mexico. If recent changes in social norms regarding labor force participation have also been affecting the indigenous population, such changes could be correlated with the interaction of historical distance and census periods. We therefore add the interaction of the percentage of the population speaking an indigenous language with the census period and with sex. It is also possible that distance from the border is only one indicator of differences in the size of municipalities, which could affect the labor force participation and wages in different ways, depending on gender. Southern states typically have a larger number of municipalities. To examine this possibility, we add a set of interactions between the size of municipalities in 1990 and gender and census period.
The results of OLS and IV analyses including these effects are shown in column (2) of Table 2. The OLS specification shows a negative φ and positive θ with small differences in the values in column (1). However, the results of the IV analysis are substantially different from those found in the OLS: the absolute value of θ is much greater. The values φ and θ imply an elasticity of labor demand for men in column (1) of 6.59 and in column (2) of 1.85. However, a test on column (2) shows that the direct calculation of the elasticity of men's labor demand is statistically different from the implied elasticity in equation (5). In equation (8), the expression related to our main parameter, the adjusted F-statistic greatly exceeds the value of 10; however, the adjusted F-statistic is weaker for equation (7). The over-identification test shows that the instruments were correctly excluded from the main equation. Results for δ 2000 and δ 2010 are consistent with a relaxation of migration networks built around the railroad infrastructure at the beginning of the twentieth century, but with small additional effects after 2000.
The specification for column (2) is carried out again in column (3), this time restricting the sample to individuals aged 18–40. Migrants are generally younger than the non-migrant population, so it is possible that the effects found in column (2) are also found in a younger population. Point estimates differ just slightly from those found in column 2. We find evidence that instruments were properly excluded from the main equation. Again, the coefficients of the first stage, δ 2000 and δ 2010, show that the relative labor supply of men decreases over time in the municipalities farther from the border, which is consistent with the diminishing importance of migratory networks built around the railroad networks in the early twentieth century, but which ceased to have an effect after 2000. Adjusted F-statistics from the first stage show a stronger effect among the younger population.
The variables of education and age affect individual wages. Their inclusion in our identification strategy, however, is problematic. Previous studies have shown that international migration affects the incentives for the formation of human capital, with differential effects according to sex [McKenzie and Rapoport (Reference McKenzie and Rapoport2011)]. Inclusion of education as a variable on the right side of the wage equation could confound the effect of IV on the sexual composition of the labor force with effects on education for men and women. A similar problem could complicate the issue of age: it is mainly the young who migrate. The results in columns (1)–(3) can be interpreted as effects on the wage gap, including the effect of changes in incentives on the accumulation of human capital and on the age structure of the labor force. Thus, in column (4), we include age, age2, and schooling with the same specification as in column (2). The results for the elasticity of substitution between men and women show no substantial differences from columns (2) and (3). The elasticity of labor demand for men shows no statistically significant difference between the implied and the estimated calculations. In column (5), we perform the same test as in column (4), but for younger individuals. Again, the results barely differ from those of the full sample, except for a strong effect of IV in the first stage.
Because a low proportion of individuals who have completed college has characterized Mexican migration to the United States, we would expect that the effects on relative labor supply are stronger among less educated workers. Panels A and B of Figure 3 show the correlation between the historical distance from the border and the change in relative labor supply for those with more than 12 years of schooling and those with 12 years or less. The line represents the fitted values of a simple regression using as weight the size of the labor force at that level of education. This figure suggests that the relative supply of more educated workers does not change with distance from the border; thus, the differences we have seen in the relative labor supply come from the less educated.
Historical distance and relative supply change, 1990–2010. (A) More educated. (B) Less educated.
Notes: Historical distance in thousands of kilometers. Relative hours represent the proportion of hours worked by men divided by the hours worked by women. Linear fit weighted by total labor force in 1990. More educated is population with >12 years of education, less educated with ≤12 years of education.

Table 2, column (6), shows the same test as in column (4), but including only individuals with 12 years or less of schooling. The elasticity of substitution between men and women is lower in the IV estimate: 5.84, as compared with 8.64 in column (4). There is no statistical difference in the elasticity of labor demand for men between the two methods. The over-identification test shows that interactions of historical distance, census period, and sex were properly excluded from the main equation; however, instruments in the first stage tend to be less significant. These results further suggest imperfect substitution between men and women within educational level.
4.2 Robustness and discussion
Given that the evidence is weak after 2000 for the declining effect of the migratory networks developed at the beginning of the twentieth century, we might estimate equation (6) for the period 1990–2000, or for the entire period from 1990 to 2010. It is also possible to establish the effect by adding the logarithm of wages at the municipal level and taking differences. The equation is then as follows:

where $\Delta \;\overline {\log ( {w_{g, s}} ) } \;$ is the difference in the average of the logarithm of wages per hour for gender g in municipality s, and Δlog (M s/F s) is the difference in the relative labor supply measured in hours in municipality s between 1990 and 2010. The variable m g is a dummy, with 1 equal to male. Parameters φ and θ have the same interpretation as in equation (6). We can also add controls X s, whose effect differs by gender, in order to capture trends differing according to the characteristics of municipalities in 1990. Errors can be correlated at the municipality level. The terms Δlog (M s/F s) and m gΔlog (M s/F s) can be instrumented with historical distance, and with the interaction of historical distance and m g in two equations similar to (7) and (8).
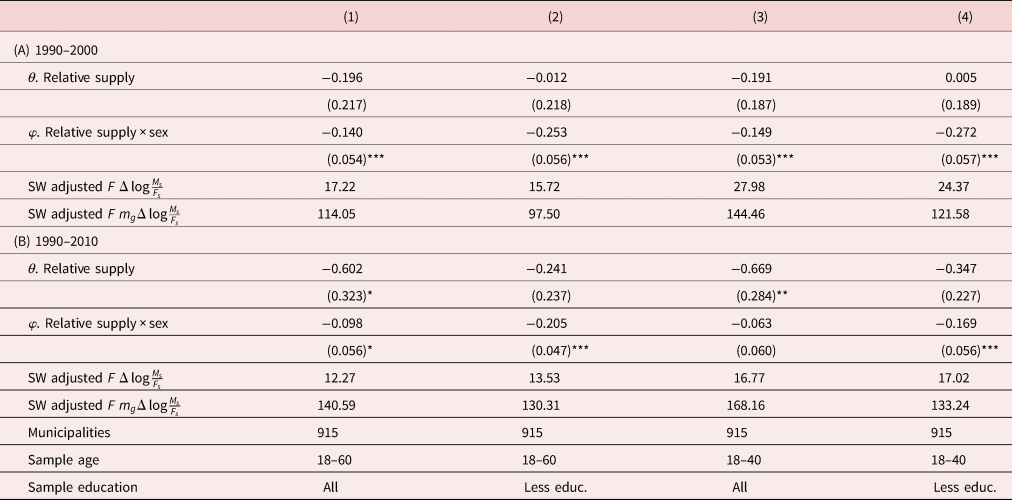
The results of the IV analysis for this specification are shown in Table 3, with two different periods and four samples according to the age and educational groups included. In panel A, we take the differences between the 1990 and 2000 censuses, and in panel B, we take the differences over the entire period from 1990 to 2010. The samples include the population aged 18–60, the population aged 18–40, the population with different educational levels, or the less educated population only. Each observation is weighted by the estimated population by sex for the municipality in 1990. We add as controls geographic regions, the indigenous proportion of the population interacted with sex, and the population of the municipality interacted with sex, similar to the treatment in Table 2, columns (2) and (3). The results of the elasticity of substitution between men and women do not differ substantially from those found in Table 2. The degree of substitutability is lower only for the less educated sample; for the full sample aged 18–60 in the period 1990–2010, the effect is not statistically significant. First-stage adjusted F-statistics are greater than in the main results, as predicted from the weakened effect of distance in changing relative labor supply after 2000.
Relative gender supply and wages at municipality level. Instrumental variables

Municipalities with a population of 10,000–100,000 with the exception of Yucatan region. Less educ. is population with ≤12 years of education. All specifications include region effects, share of indigenous population interacted with sex, and share size of municipality interacted with sex. Clustered standard errors at municipality level in parentheses.
*p < 0.1; **p < 0.05; ***p < 0.01.
Previous studies have shown that in an advanced economy like the United States, men and women with the same level of education offer different sets of skills in the labor market, with women in jobs that require relatively more intellectual skill and men in those requiring more physical skill [Beaudry and Lewis (Reference Beaudry and Lewis2014)]. Studies suggest that women in Mexico who join the labor force as a response to male migration enter male-dominated occupations to a lesser extent [Conover et al. (Reference Conover, Khamis and Pearlman2015)]. One interpretation of our results is that this response increases the gender wage gap in local labor markets. Alternatively, our results may reflect changes in unobserved differences in abilities related to the selection of men who migrate, or the acquired abilities of return migrants. Women with different unobserved abilities could also be joining the labor force. Further research is required to establish the direction of the skew. However, when we control for variables correlated with productivity, our estimates of the elasticity of substitution remain almost unchanged. Finally, the structural interpretation of the obtained parameters rests on the assumption that the number of hours women work remains relatively constant. However, migration is not exclusively male; women in the municipalities analyzed also migrate. Their migration would affect wages through the element $( \alpha _t^f F_t) ^{-\beta }$ in equations (2) and (3) and the common element θ in our estimates, though it would not affect the estimation of φ, the parameter that establishes the degree of substitutability between men and women, which is the main parameter of interest in our study. Our preferred specification also implies a short-run demand curve elasticity for men in line with previous studies using education experience cells at the national level for the Mexican labor market [Aydemir and Borjas (Reference Aydemir and Borjas2006), Mishra (Reference Mishra2007)].
5. Final remarks
In this study, we find that there is imperfect substitution between men and women in the Mexican labor market. Examining local labor markets in small municipalities, we find an effect of migration on men who remain in Mexico that is similar to that found by Mishra (Reference Mishra2007) with a national-level analysis using education experience cells. The effect of a 10% decrease in the labor supply of men due to migration is a short-term increase in hourly wages of 3.7% for men and 2.5% for women. The imperfect substitutability found between men and women implies that mostly male migration has increased the gender wage gap, even though this migration causes greater labor participation for women [Raphael (Reference Raphael2013), Conover et al. (Reference Conover, Khamis and Pearlman2015)]. Multiplying the effect of distance from the border on relative labor supply by the mean distance of southern municipalities, our preferred specification showed that in 1990, the relative labor supply of men was 13% higher in municipalities in the south than those at the border. This means a gender wage gap that was 1.6 percentage points greater in 2010 than in 1990, after the surge in migration in the south. Together with previous studies, our results suggest that men and women with the same educational level develop different skills in the labor force, with women entering male-dominated occupations requiring more physical skills to a lesser extent than their increased participation in the labor force. The increase in the wage gap, however, is less than that found in previous studies of gender substitutability. Our results also suggest that direct comparisons of labor supply between households receiving remittances and those that do not could be misleading, since migration and remittances have effects beyond the households directly involved in migration.