Inequalities in college access – in which disadvantaged students fail to attend college at the same rate as advantaged students – are a major concern for policymakers and researchers in many countries.Footnote 1 Because disadvantaged students benefit less from the high economic pay-offs associated with attending college, inequalities in college access can drive economic and social inequality.Footnote 2 Since attending college increases lifetime earnings, inequalities in college access can magnify economic disparities across lifetimes, affecting future generations.Footnote 3 Thus, inequalities in college access can profoundly influence a country's future economic development and social mobility.Footnote 4
Policymakers in China have taken action to narrow inequalities in college access, for example by expanding college enrolment quotas to accommodate more students. The Ministry of Education has expanded college enrolments by over five times over the last 15 years: in 2000, the number of college enrollees was 4.1 million;Footnote 5 by 2011, this number had increased to 23 million.Footnote 6 Policymakers in China have also provided disadvantaged students with needs-based financial aid to address concerns about their inability to pay for college: by 2007, the amount of mandated financial assistance for college students had expanded to 27.3 billion yuan (about US$3.7 billion).Footnote 7 Education officials have additionally created an online informational platform (yangguang gaokao 阳光高考 at http://gaokao.chsi.com.cn), which is supposed to help disadvantaged students make informed decisions about the transition from academic high school to college. Finally, in some regions/provinces, policymakers have given disadvantaged students bonus points in the college entrance exam so that they can more easily access college.Footnote 8
In spite of these efforts, researchers remain concerned that policies have not done enough to reduce inequalities in college access in China.Footnote 9 One concern is that current government efforts (despite their scope and intensity) rarely address the fact that inequalities in college access may be based on inequalities that emerge earlier on in the education pathway. That is, current policies mostly focus on students who have successfully reached the end of academic high school (for example, in the case of providing online informational resources) or who have already entered college (for example, in the case of determining financial need and allocating financial aid), rather than on students who are still proceeding through earlier stages of schooling.Footnote 10 In short, current policies to help disadvantaged students access college largely benefit students who already have the ability and means to succeed in earlier stages of schooling (pre-school through high school).
By contrast, efforts to address inequalities in college access may be more effective when they account for the entire pathway that students must navigate before they arrive at college.Footnote 11 We conceptualize this pathway in terms of distinct “milestones.” For example, attending primary school is a critical early milestone along the pathway to college: students cannot continue on in school unless they go to primary school. Another example of a milestone further along the pathway would be taking the college entrance exam: students are ineligible to apply for college unless they choose to participate in this test. Paying attention to each milestone is important since the pathway to college in China is perhaps best characterized as a one-way, limited-access street. Once a student misses a milestone, it is often difficult (or impossible) to get back onto the pathway.Footnote 12 In other words, in China's education system, failure to complete any particular milestone usually means that future milestones cannot be completed.Footnote 13 By understanding when disadvantaged students miss milestones and fall off the pathway to college, policymakers may be able to better target policies and programmes to help these students improve their access to college.Footnote 14
Our paper is complementary to a large body of literature that examines how inequalities are, in part, the cumulative result of multiple inequalities that occur far before the college application decision. For instance, studies have shown that the ability to acquire human capital is strongly contingent on early childhood health and educational outcomes.Footnote 15 In rural China, abundant evidence attests to significant sources of inequality in early health outcomes. For example, 48.8 per cent of rural infants are anaemic. This dramatically reduces their cognitive and motor skills at a young age and likely curtails their development in the long run.Footnote 16 Similarly, only 15 per cent of children who are myopic in rural China actually wear spectacles to correct their vision, another contributor to inequality in educational outcomes for rural students.Footnote 17 In addition to the gaps in health at young ages, only 43 per cent of rural students have access to early childhood education, compared to over 90 per cent in urban areas.Footnote 18 In poor rural areas, 25 per cent of students drop out from junior high school.Footnote 19
Although these studies have documented inequalities in education during primary and junior high schooling in China, few studies have examined how inequalities emerge after primary and junior high school, in what we refer to as “post-compulsory schooling.”Footnote 20 By post-compulsory schooling, we mean the stages of schooling that students can choose to go through after they graduate from junior high school. It is important to examine inequalities that appear after junior high school because at that point schooling is no longer mandatory (according to policy). The fact that junior high and primary school are compulsory (and that students are required, as much as possible, to attend and graduate from these levels of schooling) likely reduces inequalities between advantaged and disadvantaged students during those earlier stages of schooling. In fact, it may be that the extent to which inequalities produced in earlier stages of life (junior high school, primary school or early childhood) is only fully manifest after junior high school, at which point students are given the choice of whether or not to continue their schooling.
Indeed, there are a number of reasons why disadvantaged students in China may be more likely to leave the pathway to college during post-compulsory schooling. First, even after they graduate from compulsory schooling, disadvantaged students (who tend to score lower, on average, in competitive entrance exams) may decide that their chances of admission to academic high school and college are too low to make it worth seeking promotion to high school or college.Footnote 21 Second, disadvantaged students in China may find the tuition fees for academic high school or college prohibitively expensive.Footnote 22 Third, the quality of schooling at the high school level may be low in poor areas.Footnote 23 This may increase inequality along the pathway to college either by encouraging students from poor areas to not attend or to drop out of high school (owing to perceived low returns to continued schooling). It may also be that disadvantaged students are simply not learning as much in high school as their more advantaged peers and, therefore, are not prepared to compete for college admission. Failure to pass any one of these milestones could induce students to leave the pathway to college.
The goal of our study is to document the degree to which inequalities in college access accumulate along the pathway to college, particularly across three key milestones during post-compulsory education. Using one north-west region in China (Ningxia) as a case study, we first examine the college and four-year college admission rates of students from poor (disadvantaged) and non-poor (advantaged) areas. We then seek to explain the inequalities between students in these two groups by comparing each group's progress at three key post-compulsory education milestones along the pathway to college: gaining access to high school, attending high school, and gaining access to college.
The rest of the paper is organized as follows. The next section defines the three post-compulsory education milestones on the pathway to college under consideration. The third section describes the data and then goes on to detail our analytical approach. We then report the size of the gap in college access and where (at which post-compulsory milestone) in the pathway the gap emerges. The final section discusses the implications of these results and concludes.
Three Key Post-compulsory Education Milestones on the Pathway to College in China
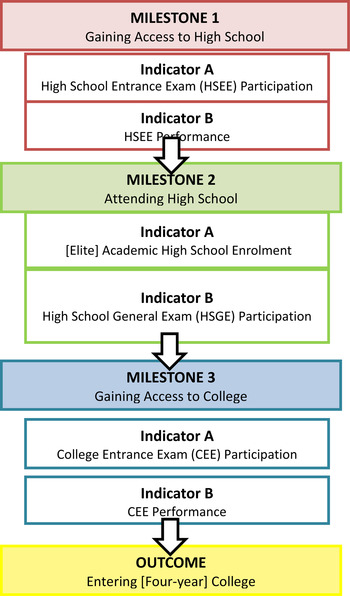
We define the first key post-compulsory education milestone on the pathway to college as gaining access to high school. Because high school is a necessary prerequisite for college admission, students who do not gain access to high school effectively forfeit any opportunity to attend college.Footnote 24 We further split this first milestone into two measurable indicators. To measure the progress of students along the pathway at the first milestone, the measures are: Indicator A, whether a given student chose to participate in the high school entrance examination (zhongkao 中考, the HSEE hereafter); and Indicator B, the student's performance in the HSEE. These two measures are critical to progress along the pathway because, in China, admission to academic high school is almost solely dependent on taking and scoring well on the HSEE.
We define the second key post-compulsory education milestone as attending high school. Students in China cannot make it to college unless they first attend and finish high school. We evaluate whether students attend high school by examining two indicators: Indicator A, whether or not a given student enrolled in high school (or elite high school) in the first place; and Indicator B, whether or not the student chose to participate in the High School General Examination (huikao 会考, the HSGE hereafter).Footnote 25 The HSGE is required for all students who wish to proceed onto their third and final year of high school, and is therefore a proxy for high school completion.
We define the third key post-compulsory education milestone on the pathway to college as gaining access to college. Similar to admission to high school, college admission is based almost exclusively on performance in a standardized examination: the College Entrance Exam (gaokao 高考, the CEE hereafter). If students choose not to take the CEE or do not perform adequately in the CEE, they cannot be admitted to college. We therefore use two indicators to measure achievement of the third milestone: Indicator A, whether a given student chose to participate in the CEE; and Indicator B, the student's performance in the CEE.
In sum, the pathway to college in China can be divided into three key post-compulsory education milestones: gaining access to high school; attending high school; and gaining access to college (Figure 1). The gap in college access is said to widen when a greater proportion of disadvantaged students than advantaged students fail to achieve any of these milestones.
The Post-compulsory Education Pathway to College in China

Data
The data from our study come from the Ningxia Autonomous Region (or province) in north-west China. Ningxia has a population of over six million people and is mostly comprised of two ethnic groups: Han (>60 per cent) and Hui (>30 per cent). The region's average annual per capita disposable income was 21,470 yuan in 2008. Ningxia ranked 18th out of China's 31 provinces.Footnote 26 However, more importantly for our study, the average income level masks wide income differences between individuals in poor and non-poor counties. Of Ningxia's 22 counties, 9 are nationally designated as poor counties: the average annual disposable per capita income in these counties falls between 2,500–7,500 yuan. In contrast, the remaining 13 counties have average annual disposable per capita incomes ranging between 9,000 and 30,000 yuan.Footnote 27
Our main sources of information on Ningxia's education system are the three administrative datasets provided by Ningxia's department of education. We use these datasets to describe where inequalities in college access arise (between students from poor and non-poor counties in Ningxia) as students seek to reach the three post-compulsory milestones on the pathway to college.
The first dataset includes information on all 242,771 students who participated in the HSEE in eight poor and seven non-poor counties from 2004 to 2009 (and who were slated to graduate from high school from 2007 to 2012, hereafter referred to as the “HSEE data”).Footnote 28 The HSEE data contain information on the county in which the student attended junior high school. The HSEE data from 2007 also contain information on student HSEE performance. We use the HSEE data to measure differences in the progress of disadvantaged and advantaged students at the first milestone (gaining access to high school). The data are used to create two variables: HSEE participation and HSEE performance.
The second dataset contains information on all 135,944 students who entered high school in Ningxia in 2004, 2005 and 2007 (and who would graduate from high school, barring school dropout, in 2007, 2008 and 2010, respectively). We refer to these data as the “High School Entrants data.” This dataset has information on high school students from all 22 counties/districts in Ningxia, both poor and non-poor. The main variables in this dataset are each student's unique ID (given when students enter high school), date of birth, gender, ethnicity, and high school attended. We use this dataset (as well as information provided by Ningxia's department of education on which high schools were “key” or “elite” high schools) to examine gaps in indicator A of the second milestone: high school (or elite high school) enrolment.
The third dataset contains information on all 342,209 students (in 22 counties) who took the CEE for the first time from 2001 to 2010. We call this our “full CEE data.” The dataset includes a unique student ID (given to a student when he/she enters high school) that matches the student ID in the High School Entrants data. The dataset also includes information on each student's date of birth, gender, ethnicity, high school, county of high school, CEE test type (science or humanities track), and total score on the CEE. The dataset also includes information on whether each CEE participant was admitted to college. We use the full CEE data to assess inequality in the outcome of the college pathway – college admission rates. We also use this dataset to evaluate the gap (between students from poor and non-poor counties) in indicator B of the third milestone on the pathway to college (CEE performance).
We construct one more dataset based on these three primary datasets. First, to understand HSGE participation and CEE participation – indicator B of the second milestone and indicator A of the third milestone – we construct a fourth dataset using a two-step process. First, we obtained data on 43,359 students (from 22 counties) who took the HSGE in 2009 (only) and were therefore slated to take the CEE in 2010 (we call this our “HSGE data”).Footnote 29 Like the full CEE and High School Entrants data, the HSGE data contain the same unique student ID (given when a student enters high school). Second, because all three datasets (the full CEE dataset, the High School Entrants dataset, and the HSGE dataset) have a unique identifier for each student, we are able to construct and track a cohort of students through high school. Specifically, we use the student IDs to merge the 2010 full CEE data, the 2009 HSGE data, and the 2007 High School Entrants data. In this way, our datasets allow us to track the cohort of the 2007 high school entrants and measure if they took the HSGE after two years or the CEE after three years (as reflected by whether the student's information is recorded in the HSGE and full CEE datasets). We call this fourth, aggregated dataset our “High School Testing” dataset. This dataset helps us to measure indicator B of the second milestone (HSGE participation) and indicator A of the third milestone (CEE participation).
Finally, we also obtained information on the number of primary school graduates from the Ningxia Educational Statistics Yearbooks for the years 1994–2010. These data are used in our analysis as a reference point when examining levels of college enrolment, high school enrolment, and HSEE participation for advantaged and disadvantaged students in our sample.
Analytical Approach
Inequality at the end of the pathway
We use simple descriptive statistics to examine trends in the percentages of students from poor counties and non-poor counties who attend college – our “outcome” (Figure 1). Specifically, we use the full CEE data to calculate the numbers of students from poor and non-poor counties who gained admission to any college and four-year college from 2001 to 2010. We then divide these numbers by the numbers of primary school graduates six years earlier (from 1995 to 2004, respectively). We are thus able to calculate the percentages of students from poor and non-poor counties who attended college and four-year college from 2001 to 2010.
Descriptive measures on inequalities
We next use simple descriptive statistics to estimate where (at which milestone) inequalities (between students from poor and non-poor counties) arise along the pathway to college. We measure inequalities in HSEE attendance and HSEE performance – indicators A and B of the first milestone (gaining access to high school). First, we use the HSEE data to calculate the numbers of students from poor and non-poor counties who participated in the HSEE from 2004 to 2009 (and who were slated to graduate from high school from 2007 to 2012). We then divide these numbers by the numbers of students that graduated from primary school three years earlier (from 2001 to 2006).Footnote 30 We are thus able to calculate the rate of HSEE participation from 2004 to 2009. Second, we compare the HSEE score distributions of students from poor versus non-poor counties by using kernel density functions. Comparing the HSEE score distributions of students from poor versus non-poor counties allows us to identify how far behind participating students from poor counties are compared to participating students from non-poor counties (in terms of academic preparedness for high school).
Next, we examine inequalities at indicator A of the second milestone (high school enrolment). We use the High School Entrants data to calculate the number of students who gained admission to high school and elite high school in poor and non-poor counties in 2004, 2005 and 2007 (and who were therefore slated to graduate from high school in 2007, 2008 and 2010). We then divide the numbers of students who gained admission to high school and elite high school by the number of primary school graduates from three years earlier (in 2001, 2002 and 2004). We are thus able to calculate the percentages of students from poor counties and non-poor counties who attended high school and elite high school in 2004, 2005 and 2007.
Estimating HSGE and CEE test participation
We use a binary outcomes (logistic) model to estimate the rate at which students from poor counties participated in the HSGE – indicator B of the second milestone (HSGE participation) – and the rate at which students from poor counties participated in the CEE – indicator A of the third milestone (CEE participation). Specifically, we analyse our High School Testing data using the following logistic regression model:
 $$\eqalign{logit \left\{E \left(Y_{ij}\vert{Poor}\_county, X \right)\right\} & = logit \left\{P\left(Y_{ij} = 1 \vert{R,X} \right) \right. \cr & \quad = logit \left(p_{ij} \right) = \beta_{0} + Poor\_{county_{i}}^{\prime} \beta + X_i^{\prime} \alpha}$$
where Yi is a (binary) dependent variable equal to 1 if student i did not take the test and 0 otherwise. The right hand side of equation (1) includes a dummy variable for whether a student is from a poor county (Poor_countyi) or not. The equation also controls for other student characteristics (Xi) including age, gender and minority status.
Comparing CEE performance between students from poor and non-poor counties
To examine inequalities in CEE performance – indicator B of the third milestone – we estimate a quantile regression model using our full CEE data. The purpose of using the quantile regression model is to describe the relationship between CEE performance and being from a poor or non-poor county at different points (quantiles) of the CEE performance distribution. Whereas OLS regression estimates the conditional mean of the dependent variable at given values of the covariates, quantile regression estimates quantiles (percentiles) of the dependent variable at given values of the covariates. This allows us to examine how the relationship between CEE performance and county poverty status differs for students at different points in the CEE performance distribution.
We utilize quantile regression because the method allows us to go into more detail about how CEE scores may diverge between disadvantaged and advantaged students over the course of high school. CEE scores may diverge during high school because of the pervasiveness of educational tracking at this level. In particular, China tracks students across elite and non-elite high schools and also across fast-track and non-fast track classes within high schools. The results from the quantile regression, while descriptive and lacking a formal causal interpretation, will therefore allow us to observe ways in which differences in access to high school quality (elite schools and fast-track classes) may interact with student background to produce inequalities in college access.
To examine the relationship between CEE performance and whether a student is from a poor or non-poor county at various quantiles of the CEE distribution, we estimate the following quantile regression model:
 $$y_i = \beta _0^{\left( p \right)} + \beta _1^{\left( p \right)} Poor\_county_i + X_i^{\prime} \alpha ^{\left( p \right)} + \varepsilon _i^{\left( p \right)}$$
where 0 < p < 1 indicates the proportion of CEE takers having scores below the pth quantile. As above, Poor_countyi is a dummy variable for whether a student is from a poor county or not, and Xi again represents other control variables such as age, gender and minority status. We use equation (2) to estimate
 $\beta _1^{\left( p \right)} $
at different deciles (
 $\beta _1^{0.1} $
,
 $\; \beta _1^{0.2} $
…
 $\; \beta _1^{0.9} $
). For example,
 $\beta _1^{0.1} $
reflects the CEE performance differences between students from poor and non-poor counties at the bottom decile of the CEE distribution, whereas
 $\beta _1^{0.9} $
reflects the CEE performance differences between students from poor and non-poor counties at the top decile. This allows us to examine how the relationship between CEE performance and county poverty status differs for students at the top, middle and bottom deciles of the CEE performance distribution.
Results
Inequality in outcome: gaps in college and four-year college access from 2001 to 2010
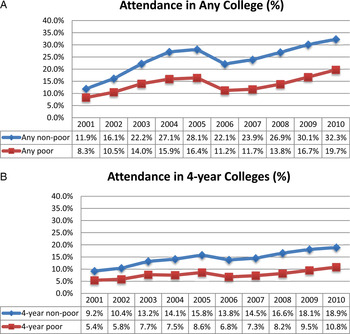
We find that there is a considerable gap in college access between students from poor and non-poor counties. Drawing on analyses using our full CEE data, our results show that while 11.9 per cent of students from non-poor counties attended college in 2001, only 8.3 per cent of students from poor counties did the same. In other words, in 2001, students from poor counties were 1.43 times less likely than students from non-poor counties to be enrolled in any college (Figure 2, Panel A). This difference was slightly larger for four-year college enrolment. Students from poor counties were 1.7 times less likely to enrol in four-year college (Panel B) than students from non-poor counties.
Gap in College and Four-year College Access for Students from Poor and Non-poor Counties, 2001–2010

The data further show that the inequalities in college access actually widened between 2001 and 2010. Despite the rise in the number of college admission slots, students from poor counties became less likely to enrol in any college in the decade between 2001 and 2010 (the difference expanding from 1.43 to 1.64 times, see Figure 2, Panel A). Students from poor counties also became less likely to enrol in four-year college (the difference expanding from 1.70 to 1.75 times, see Panel B). Taken together, our results show that students from poor counties had lower access to colleges (and four-year colleges) across time, despite increased college enrolments overall.
Three post-compulsory education milestones where inequalities in college access may emerge
To understand at what point along the pathway these inequalities in college access between students from poor and non-poor counties emerge, we trace the inequalities backwards in time across the milestones. We look for sources of inequality in three specific milestones in the post-compulsory education pathway in reverse chronological order. Again, these milestones include the following: milestone three – gaining access to college, indicated by CEE participation and CEE performance; milestone two – attending high school, indicated by rates of high school enrolment and HSGE participation; and milestone one – gaining access to high school, indicated by HSEE participation and HSEE performance.
Milestone three: gaining access to college
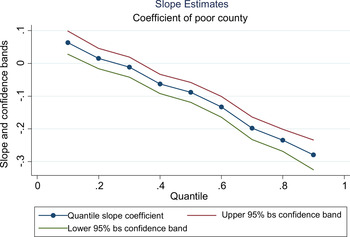
Results from our analyses using the full CEE data show that students from poor counties perform worse on the CEE relative to those from non-poor counties (indicator B of milestone three). We summarize our results in Figure 3, which plots the coefficients for our adjusted quantile regression and the confidence intervals. The y-axis signifies the difference in CEE scores between students from poor and non-poor counties, and the x-axis signifies different quantiles of the score distribution (in standard deviations). Together, Figure 3 compares the scores of students from poor and non-poor counties at different parts of the CEE distribution. From this figure, we find that students from poor counties score lower on the CEE than students from non-poor counties at all parts of the distribution. For example, at the median (the 50th percentile), students from poor counties score roughly 0.1 standard deviations lower than students from non-poor counties, even after accounting for basic student characteristics like gender, age and ethnicity. More importantly, students from poor counties score progressively lower than students from non-poor counties as they move up the score distribution. At the 90th percentile, students from poor counties score almost a full 0.3 standard deviations below their non-poor peers. In short, at least part of the observed gap in college enrolment can be explained by statistically significant performance gaps on the CEE.
Quantile Regression Estimating CEE (gaokao) Scores of Students from Poor Counties

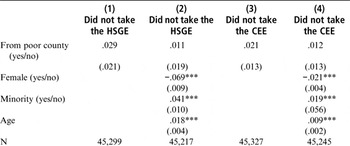
By contrast, there appears to be no gap in indicator A of milestone three: simply taking the CEE in the first place. We find that there is no significant difference in CEE participation between students from poor and non-poor counties. Students from poor counties were only 2.1 percentage points less likely to take the CEE (Table 1, column 3) and the difference between the rates of CEE participation in poor and non-poor counties was not statistically significant. When controlling for personal characteristics, the difference falls to 1.2 percentage points. As such, we conclude that there was no real difference between students in poor and non-poor counties in terms of CEE participation. Whatever inequality emerges in this final milestone on the pathway to college is the result of differences in CEE performance rather than differences in CEE participation.
Participation in the HSGE (huikao) and the CEE (gaokao)

Note:
Cluster robust SEs in parentheses. *** p < 0.01; ** p < 0.05; * p < 0.1. (Average) marginal effects estimates.
Milestone two: attending high school
Noting the gap in CEE performance at the third milestone, we step backwards and examine whether students from poor counties are less likely to attend (and finish) high school than students from non-poor counties (milestone two). To do this, we first look for a gap between students from poor and non-poor counties in HSGE participation (indicator B of milestone two). Drawing on analyses from our High School Testing data, we find that students in poor versus non-poor counties participated in the HGSE at about the same rate. Although students from poor counties were 2.9 percentage points less likely to take the HSGE than students from non-poor counties (Table 1, column 1), this finding was not statistically significant. When we control for student characteristics, the difference falls to 1.1 percentage points, also not statistically significant (column 2). As such, we conclude that there were no differences in HSGE test participation. In other words, provided that students in poor and non-poor areas do enrol in high school, they finish high school at similar rates.
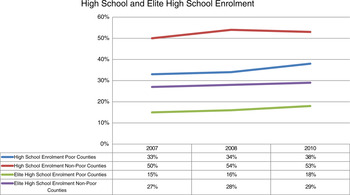
We next examine whether differences in gross high school enrolment contribute to the gap in college access (indicator A of milestone two – high school enrolment). We compare enrolments in both academic and elite academic high schools between students from poor and non-poor counties. Overall, we find a large gap in high school enrolment. Students from poor counties are significantly less likely than their peers from non-poor counties to enrol in either academic high school or elite academic high school (Figure 4). For example, in 2010, 53 per cent of students from non-poor counties attended high school, compared with only 38 per cent of students from poor counties. This means that advantaged students are 1.4 times more likely to attend high school than their disadvantaged peers (53/38 = 1.4). The gap widens to 1.6 times for elite academic high school enrolment (29/18 = 1.6). In short, students from poor counties are significantly less likely to enrol in academic and elite academic high school. Further, the gap in academic and elite academic high school enrolment between students from poor and non-poor counties is close to the same magnitude as the observed gap in college access in 2010 (students from non-poor counties are 1.64 times more likely to attend any college).
Regular and Elite High School Gross Enrolment Estimates, 2007–2010

We thus conclude that a significant share of the gap in college access likely has its roots in unequal high school attendance rates between students from poor and non-poor counties. While students from poor counties are no more likely to drop out of high school before taking the HSGE (after two years of high school), they are significantly more likely than students from non-poor counties not to enrol in high school in the first place.
Milestone one: gaining access to high school
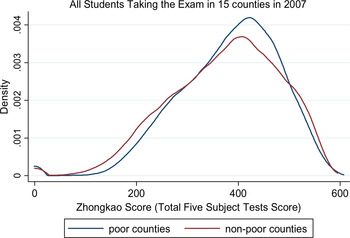
Surprisingly, we find that differences in high school enrolment are not owing to any differences in HSEE performance between HSEE-takers from poor counties and HSEE-takers from non-poor counties (indicator B of milestone one). When we compare the HSEE performance of participating students from poor counties with participating students from non-poor counties (Figure 5), we find that they have a similar distribution of exam scores.Footnote 31 This, in conjunction with our findings above, suggests that one source of the gap in college access between students from poor and non-poor counties may be the result of differential learning during high school. Because they end junior high school with similar levels of achievement (as evidenced by the lack of disparity in HSEE performance), the differences in CEE performance between these groups that we observed above must reflect differences in achievement gains during the high school period.
Comparison of Poor and Non-poor Area HSEE (zhongkao) Scores, 2007

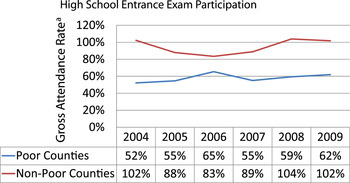
Although the distribution of HSEE scores is similar between HSEE-takers across poor and non-poor counties, many students in poor counties choose not to participate in the HSEE in the first place (indicator A of milestone one). We find a significant gap in HSEE participation between students from poor counties and non-poor counties (Figure 6). From 2007 to 2009, students from poor counties lagged behind their peers from non-poor counties in HSEE participation by 34 per cent to 50 per cent (Figure 6, columns 4–6). This means that students from non-poor counties (in 2009) were approximately 1.6 times more likely to take the HSEE than students from poor counties. One of the most significant reasons for the gap in high school attendance therefore is that students from poor counties are simply less likely to seek admission to high school by participating in the HSEE. This suggests that the gap in college enrolment has another one of its sources as early in the pathway to college as the first milestone of post-compulsory education.
Differences in HSEE (zhongkao) Participation between Students from Poor and Non-poor Counties, 2004–2009

It should be noted that our analysis of HSEE attendance rates is based on the number of primary school graduates from three years earlier. As noted above, existing research shows that in poor rural areas, roughly 25 per cent of children drop out of junior high school.Footnote 32 To the extent that drop-out rates are higher in poor than non-poor areas, a sizeable portion of the gap in HSEE attendance is likely to be the result of students dropping out during the three years of junior high school. Still, drop-out rates during junior high school cannot fully explain the observed gap in HSEE participation. The decision among junior high school graduates not to take the HSEE also likely remains a major source of inequality along the pathway to college between students from poor and non-poor counties.
Conclusion
Our study shows that even after the mass expansion of college enrolments, (disadvantaged) students from poor counties in Ningxia are still 1.64 times less likely to access college than (advantaged) students from non-poor counties in 2010. Our study also assesses the extent to which each of the three key post-compulsory education milestones (gaining access to high school, attending high school, and gaining access to college) along the pathway to college contributes to this inequality.
Moving backwards in time, we find that inequality exists at multiple milestones along the pathway. First, students from poor counties score significantly lower on the CEE than their peers from non-poor counties. Lower scores mean that many of these students are unable to gain access to college. In particular, we note that students from poor counties perform less well on the higher end of the CEE score distribution than do their advantaged peers, likely resulting in some differences in access to four-year colleges. Second, we note that students from poor counties tend to attend high school at a far lower rate. Although almost all students who enrol in high school stay in school until they graduate, students from poor counties are significantly less likely to enrol in academic high school (and especially elite academic high schools). Third and finally, we demonstrate that the single largest source of inequality along the post-compulsory education pathway emerges during the transition from junior high to high school. A major reason for the academic high school gap is that students are much less likely to participate in the high school entrance exam, not because they score less well on the exam when they do take it but because they give up before even trying.
In sum, inequalities in college access emerge early in the post-compulsory education process. While modest inequalities accumulate during high school and during the transition from high school to college, the bulk of inequalities in college access occur at the beginning: the transition from junior high school to high school. Indeed, our data suggest that considerable inequality may be introduced even prior to high school during compulsory education. While primary school drop-out rates are believed to be low, research has shown that junior high drop-out rates in poor rural areas are high.Footnote 33 This is likely to be a contributing factor to the low rates of HSEE participation observed in this study. This suggests that further policy efforts to reduce inequality in college access by targeting high school graduates will be of limited effectiveness. Because the source of inequality in college access originates far in advance, a true reduction in that inequality is unlikely without policies targeted at reducing sources of inequality before post-compulsory education.
Our concept of a “pathway to college” echoes a broader literature from developed countries showing how access to educational opportunities condition future opportunities. For instance, among individuals living in the United States born between 1979 and 1981, those from advantaged families (those in the top decile of US incomes) have an 80 per cent chance of attending college whereas those in the lowest income decile have only a 29 per cent chance.Footnote 34 The evidence from the United States shows that this gap is the cumulative result of several measures of inequality along the pathway to college. Low-income students drop out of high school at a higher rate – in 2009, 7.4 per cent of all low-income students dropped out versus only 1.4 per cent of high-income students.Footnote 35 Disadvantaged students tend to be segregated in neighbourhoods with concentrated poverty, which reduces high school completion rates by 8 percentage points.Footnote 36 Disadvantaged students are more likely to be exposed to crime and arrests, which reduces their chances of high school completion by six to eight times.Footnote 37 Low-income students are more likely to be held back while in junior high school, which increases their chances of dropping out.Footnote 38
In fact, evidence has shown that these disparities begin accumulating even earlier in the life course. Moving back to elementary school, higher-income students perform better than low-income students on standardized achievement tests by 25 per cent.Footnote 39 Low-income students are far less likely to access early childhood education.Footnote 40 Even more fundamentally, low-income students also live in less healthy environments and thus have a lower birthweight and higher incidence of childhood diseases. Such health outcomes have been shown to have far-reaching effects on educational attainments and future physical and mental health.Footnote 41 This research in the US demonstrates the vital importance of understanding how the pathway to college is littered with obstacles that can generate inequalities in the ultimate outcome.
How can we explain the inequalities documented in this study? Why are so many students from poor counties giving up on academic high school? Although we cannot say for sure, one of the most significant reasons is that the direct costs of attending academic high school are extremely high in China today. High school tuition fees account for roughly 82 per cent of the net per capita income in poor areas (this appears to be one of the highest if not the highest tuition burdens in the world).Footnote 42 For students living in poor counties (such as those in this study), the high costs of attending academic high school can be a strong deterrent to continuing on in school, and many students decide to give up before even taking the high school entrance examination (as found in this study).
The out-of-pocket costs are compounded by high and rising opportunity costs (i.e. three years of income that a student would forego in the labour force). After remaining at a low level for roughly 20 years, the unskilled wage rate in China has been rising steadily since the early 2000s.Footnote 43 Demand for labour in China's coastal provinces has been rising, and almost any able-bodied rural individual is able to find an off-farm job.Footnote 44 Jikun Huang et al. have also found that a typical unskilled worker could earn in one month what the average farmer in a poor rural area could earn in a year.Footnote 45 These low-skilled jobs are unlikely to provide long-term prospects for the students.Footnote 46 However, the opportunity costs that rural students face may compound the already expensive schooling options available and further encourage students to drop out and give up on further schooling.
A second reason is that the quality of compulsory education differs dramatically between poor and non-poor counties. Studies show that many students in poor counties suffer from poor nutrition and health.Footnote 47 They also frequently receive lower quality instruction.Footnote 48 As such, by the time most disadvantaged students graduate from junior high, their academic achievement is so far behind that of advantaged students that they decide not to compete in the high school entrance exam at all.
A third possible reason is that the expansion in academic high school has not kept pace with the aggressive expansion in higher education. The government has rapidly increased higher education enrolments (thus reducing competition and increasing the value of academic high school) in the past decade. However, enrolments in academic high school have not increased as rapidly (thereby increasing competition for academic high schools). For disadvantaged students, the increasing competition for limited places in academic high school might exacerbate their perceived inability to compete with students with higher academic achievements (that is, the advantaged students).
A fourth and final reason is that poorer families have differential investments and “cultural” perspectives on education (human capital investment). By culture, we mean that families and households appear to save less and allocate fewer resources for longer-term expenditures.Footnote 49 This may be because poorer families generally have fewer resources to buffer against shocks.Footnote 50 Longer-term investments are thus riskier for poorer families who, over time, grow accustomed to spending resources more quickly. The ultimate result is that poorer families allocate even less of their already scarce resources to human capital investments, which exacerbates educational inequalities in society.
While an empirical test for why students from poor counties are failing to even take the high school entrance examination is beyond the scope of this work, the bottom line is that factors influencing student decisions before high school seem to be driving inequality in college access (and will continue to drive inequalities in the future). In other words, disadvantaged students face the biggest hurdles early on in the pathway to college: the poor quality of compulsory education, increased competitiveness in the high school entrance examination, and the high costs of attending academic high school (by policy design). These may all be probable causes behind the current inequalities in college access in China.
Biographical notes
Prashant Loyalka is a centre research fellow at the Rural Education Action Program (REAP)/FSI and an assistant professor (research) at the GSE, Stanford University
James Chu is a PhD student in the sociology department at Stanford University
Jianguo Wei is an associate professor of education at the China Institute for Educational Finance Research, Peking University
Natalie Johnson is a project manager for the Rural Education Action Program at Stanford University
Joel Reniker is an instructor at Beijing Foreign Studies University