


Introduction
One of the first hypotheses on the origin of life entails that the compounds at the base of the complex machinery of the living cell must have originated from simple organic species dissolved in the primordial ocean. It still is an unresolved question whether the first self-replicating systems were nucleic acids or proteins. The required conditions for the spontaneous formation of polypeptides exhibiting catalytic properties in the prebiotic aqueous environment were investigated in a previous work (Canepa Reference Canepa2013). The processes involved were
 $$x_1 \mathop \to \limits^{x_1} x_2 \mathop \to \limits^{x_1} \cdots x_i \mathop \to \limits^{x_1} \cdots x_n, $$
with x 1 the concentration of amino acid monomers and x n the concentration of the polypeptide of length n. The formation of new chemical species u from substrates z already present in the solution is catalysed by the polypeptides through the process
 $$z\mathop \to \limits^{x_n} u.$$
It was shown that the system reaches a stationary state in a time frame shorter than ≈0.5 Gyr only if n < 60, and the concentration of the products of the catalytic activity of such polypeptides could be in excess of the initial concentration of the corresponding substrates only for n < 100, n being the number of the amino acid units in the polypeptide chain. It must be borne in mind that there are a large number of species with concentration x n , and many are the substrates and the products, z and u only indicate their concentrations. The number of substrates is limited by the chemical identities present in the source, but the products of reaction may in turn be substrates for other catalytic polypeptides x n and considerably enhance the number of chemical species in solution.
This work takes into consideration the possibility that some polypeptides could also have possessed autocatalytic properties, i.e. the ability to catalyse the formation of the peptide bond, and the consequences of autocatalysis on the increased formation of reaction products by the action of catalytic polypeptides on substrates. Autocatalysis encompasses a wide range of phenomena with the common feature being that one reaction product catalyses its own formation. It ranges from classical systems such as the Belousov–Zhabotinsky reaction (Turányi et al. Reference Turányi, Györgyi and Field1993) to the amplification of enantiomeric excess (Soai et al. Reference Soai, Shibata, Morioka and Choji1995) and to the ability of short polypeptides to promote the formation of the peptide bond between model systems such as ethyl- or thioesters of amino acids and amino acid derivatives (Gorlero et al. Reference Gorlero, Wieczorek, Adamala, Giorgi, Schininà, Stano and Luisi2009).
The chemical reactions involved are the formation of polypeptides of various lengths, where we assume that the polypeptide of length i promotes the formation of peptide bonds through the process
 $$x_1 \mathop \to \limits^{x_1, \; x_i} x_2 \mathop \to \limits^{x_1, \; x_i} \cdots x_i \mathop \to \limits^{x_1, \; x_i} \cdots x_n. $$
Again, the presence of a continuous source of amino acids sufficient to keep a constant concentration of monomers is assumed. This source is individuated in the flux of incoming micrometeorites and interplanetary dust particles (IDPs), which continually delivers amino acids to the Earth to the present day (Anders Reference Anders1989). Most IDPs have been shown to belong mostly to the class of CI carbonaceous chondrites (Arndt et al. Reference Arndt, Bohsung, Maetz and Jessberger1996), and their amino acid composition has been reported (Ehrenfreund et al. Reference Ehrenfreund, Glavin, Botta, Cooper and Bada2001; Pizzarello et al. Reference Pizzarello, Huang, Becker, Poreda, Nieman, Cooper and Williams2001; Zaia et al. Reference Zaia, Zaia and De Santana2008). The intensity of the flux s used in the calculations was set equal to 2.83 × 10⁻²⁰ M s−1, the mean value of the estimate of Chyba et al. (Reference Chyba, Thomas, Brookshaw and Sagan1990) during the heavy bombardment of the inner Solar System that started 4.5 Gyr ago, i.e. 108–1010 kg yr−1 of organic carbon with a 3% content of amino acids. Using the molecular mass of glycine, the mass flux translates into a source of
 $2.83 \times 10^{ - 21} \; {\rm M}\,\,{\rm s}^{ - 1} \lt s \lt 2.83 \times $
 $10^{ - 19} \; {\rm M\; s}^{ - 1} $
for the present mass of the ocean (1.4 × 10²¹ kg). This mean value is also consistent with the value obtained by Kobayashi et al. (Reference Kobayashi, Masuda, Ushio, Ohashi, Yamanashi, Kaneko, Takahashi, Hosokawa, Hashimoto and Saito2001) for glycine (1.76 × 10−
20 M s−1). Chyba & Sagan (Reference Chyba and Sagan1992) also report a 10% organic carbon content in IDPs, ten times the carbon content incorporated into amino acids. We could also adopt the more optimistic estimate of 10−
10 M yr−1 suggested by Pasek & Lauretta (Reference Pasek and Lauretta2008) for the flux of organic carbon in IDPs. Assuming three carbon atoms per amino acid, we obtain s = 1.05 × 10−
18 M s−1. Besides the intensity of the source, the length of the spontaneously formed polypeptides depends on the number p of available monomeric amino acid units, the fraction α of constrained amino acids (De Ley Reference De Ley1968), and the catalytic efficiency for their formation ζ, representing the catalytic efficiency of the environment hosting the synthesis of the polypeptides. Given the bimolecular rate coefficient for peptide bond formation (η) and the corresponding rate coefficient for hydrolysis (ηh), we defined ζ = (ω−ωh)/ω as the ratio between the rate of peptide formation and the overall reaction rate ω = ηx
1+ωh (peptide formation plus hydrolysis, with ωh = ηh
x
w). The frequency for hydrolysis ωh is a constant because of the large excess of water, with the experimental value for the hydrolysis of glycyl–glycine being 6.3 × 10⁻¹¹ s−1 (Radzicka & Wolfenden Reference Radzicka and Wolfenden1996). Throughout this work, x
n
indicates the molar concentration in the prebiotic ocean of the polypeptide with n amino acid units. The rate coefficient for the hydrolysis of glycyl–glycine will be assumed to be representative of all peptide bonds, regardless of the detailed primary structure of each polypeptide. In the absence of selection, we take into account all possible amino acid sequences, and the concentration of catalytically active polypeptides will be denoted as (x
n
)cat. Since, in order to be an effective catalyst, a polypeptide must have a fraction α of constrained amino acid residues in its chain, and the probability to have a catalytic species is p
−αn
, one has (x
n
)cat = x
n
p
−αn
.
Results and discussion
In the absence of autocatalysis the rate of change of x n is
 $$\dot x_n = {\rm \eta} x_1 x_{n - 1} - {\rm \omega} x_n, $$
with the stationary-state solution x n = ζ n−1 x 1. If a polypeptide of length i had the ability to catalyse the polymerization of amino acids, then the whole process would become autocatalytic and the rate of formation of the species of length n would be
 $$\eqalign{\dot x_n & = {\rm \eta} x_1 x_{n - 1} - {\rm \omega} x_n + {\rm \eta} _{\rm a} \bar x_i x_{n - 1} - {\rm \eta} _{\rm a} \bar x_i x_n \cr & \cong {\rm \eta} _{\rm a} \bar x_i x_{n - 1} - {\rm \eta} _{\rm a} \bar x_i x_n, \;} $$
 $\bar x_i $
being the molar concentration of the autocatalytic polypeptide bound to a monomeric amino acid unit. The quantity
 $\bar x_i $
is related to the concentration of the monomers through the equilibrium constant for binding
 $$\bar x_i = K_{{\rm eq}} x_1 x_i p^{ - {\rm \alpha} i}, \; $$
the value of which is set to K eq = 109 M−1. We also assume that, in the presence of autocatalysis, the ratio xn /x n−1 = ζa is constant, as it is in the absence of autocatalysis, and write
 $$\dot x_n = {\rm \eta} _{\rm a} K_{{\rm eq}} x_1 x_i p^{ - {\rm \alpha} i} (1 - {\rm \zeta} _{\rm a} ){\rm \zeta} _{\rm a}^{ - 1} x_n. \; $$
In equation (2) we implicitly neglect a term −ηa x i p −α ix n , representing the catalysed hydrolysis of the polypeptide of length n by the free polypeptide of length i. Using equation (3), this approximation translates into K eq x 1 ≫ ζa. To solve equation (4) we need an expression for x 1 in terms of x i , which we may obtain by writing the rate of change of the concentration of the free amino acids
 $$\eqalign{\dot x_1 = &\, s - {\rm \eta} _{\rm a} \bar x_i x_1 - {\rm \eta} _{\rm a} \bar x_i x_2 - \cdots - {\rm \eta} _{\rm a} \bar x_i x_n \cr = &\, s - {\rm \eta} _{\rm a} K_{{\rm eq}} x_1 x_i p^{ - {\rm \alpha} i} (x_1 + x_2 + \cdots + x_n ) \cr = &\, s - {\rm \eta} _{\rm a} K_{{\rm eq}} x_1 x_i p^{ - {\rm \alpha} i} (x_1 + {\rm \zeta} _{\rm a} x_1 + {\rm \zeta} _{\rm a}^2 x_1 \cdots {\rm \zeta} _{\rm a}^{n - 1} x_1 ) \cr = &\, s - {\rm \eta} _{\rm a} K_{{\rm eq}} x_1^2 x_i p^{ - {\rm \alpha} i} (1 + {\rm \zeta} _{\rm a} + {\rm \zeta} _{\rm a}^2 \cdots {\rm \zeta} _{\rm a}^{n - 1} ) \cr = &\, s - {\rm \eta} _{\rm a} K_{{\rm eq}} x_1^2 x_i p^{ - {\rm \alpha} i} \mathop \sum \limits_{i = 1}^n {\rm \zeta} _{\rm a}^{i - 1}.} $$
The geometric series
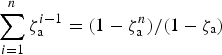 $\mathop \sum \limits_{i = 1}^n {\rm \zeta} _{\rm a}^{i - 1} = (1 - {\rm \zeta} _{\rm a}^n )/(1 - {\rm \zeta} _{\rm a} )$
may be approximated for large n with (1−ζa)−1. For example, for n = 60 and ζa = 0.9286,
 $(1 - {\rm \zeta} _{\rm a}^n )/(1 - {\rm \zeta} _{\rm a} ) = 13.84$
and (1−ζa)−1 =14.01. With this result we obtain the stationary state approximation for x
1 by solving
 $$\dot x_1 = s - {\rm \eta} _{\rm a} K_{{\rm eq}} x_1^2 x_i p^{ - {\rm \alpha} i} (1 - {\rm \zeta} _{\rm a} )^{ - 1} = 0,\; $$
that gives
 $$x_1 = \sqrt {\displaystyle{{s(1 - {\rm \zeta} _{\rm a} )p^{{\rm \alpha} i}} \over {{\rm \eta} _{\rm a} K_{{\rm eq}} x_i}}}. \; \; $$
With this result we may now write equation (4) as
 $$\dot x_n = {\rm \omega} _{\rm a} \sqrt {x_i} x_n, \; \; \; {\rm \omega} _{\rm a} = \sqrt {s{\rm \eta} _{\rm a} K_{{\rm eq}} p^{ - {\rm \alpha} i}} (1 - {\rm \zeta} _{\rm a} )^{3/2} {\rm \zeta} _{\rm a}^{ - 1}. $$
For the purpose of calculation, the rate coefficient for autocatalysis ηa will be identified with the Michaelis–Menten parameter k 2 /k M . For n = i we have
 $$\dot x_i = {\rm \omega} _{\rm a} x_i^{3/2}, \; \; $$
with solution
 $$\sqrt {x_i /x_i^0} = (1 - {\rm \omega} t)^{ - 1}, \; \; \; {\rm \omega} = \displaystyle{{{\rm \omega} _{\rm a}} \over 2}\sqrt {x_i^0}. \; \; $$
The explicit expression for ω in terms of the fundamental parameters is
 $${\rm \omega} = \displaystyle{s \over 2}\sqrt {({\rm \eta} _{\rm a} /{\rm \omega} _{\rm h} )K_{{\rm eq}} p^{ - {\rm \alpha} i}} (1 - {\rm \zeta} _{\rm a} )^{3/2} {\rm \zeta} _{\rm a}^{ - 1} (1 - {\rm \zeta} ){\rm \zeta} ^{i/2 - 3/2}. $$
We note that the concentration x i has a singularity at t = ω−1, a fact with important consequences which will become clear when we analyse its implications on the concentrations of the catalytic polypeptides and their transformation products. Near the singularity the steady-state approximation for x 1 breaks down. (See Table 1 for values of ω−1, all calculations were performed with the program Scilab: Scilab Enterprises (2012). Scilab: Free and Open Source software for numerical computation (OS, Version 5.XX) [Software]. Available from: http://www.scilab.org) Figure 1 shows a plot of the proper time ω−1 from equation (10) for two values of the amino acid source and ζa = ζ. If the available time for the formation of the autocatalytic species is about 0.5 Gyr, the value of ζ must exceed 0.65 for i = 50, making it apparent that the limiting factors for the formation of an autocatalytic polypeptide are both the available time for chemical evolution and the environmental catalysis. It should be borne in mind that the actual value of the singularity at t = ω−1 depends on the choice of many parameters. For example, the binding constant of unknown polypeptides to amino acids, K eq. Consequently, equation (10) cannot afford absolute values of ω−1, and we actually only examine its trend. We also notice that the proper time for attaining a high concentration of the autocatalytic species has a minimum for ζmin = 1 − 5/i, with the corresponding ratio of rate coefficients for polymerization and hydrolysis being
 $$\displaystyle{{\rm \eta} \over {{\rm \eta} _{\rm h}}} = \displaystyle{{x_w {\rm \omega} _{\rm h}} \over s}\left( {\displaystyle{{\rm \zeta} \over {1 - {\rm \zeta}}}} \right)^3 = \displaystyle{{x_w {\rm \omega} _{\rm h}} \over s}\left( {\displaystyle{i \over 5} - 1} \right)^3. \; $$
A semilogarithmic plot of the time ω−1 as a function of the parameter ζ for i = 50 and the values of the amino acid source estimated by Chyba (blue) and Pasek (red). The horizontal dash lines mark t = 0.5 Gyr (green) and t = 1.0 Gyr (red).

For various values of i, α = 0.10 and k 2/k M = 1.0 × 10³ M−1 s−1 are given: the value of ζmin = 1 − 5/i minimizing the proper time for autocatalysis, the time for the catastrophic transformation of the substrates (ω−1) for p = 10 and p = 20 (in parentheses), and the corresponding ratio of the rate coefficient for polymerization and hydrolysis (η/ηh).

Figure 2 shows a plot of equation (11) for two values of the amino acid source. We notice that, even for relatively small values of the length of the autocatalytic species (i = 50), the corresponding value of the parameter ζ minimizing ω−1 (ζmin = 0.90) implies a very high environmental catalytic efficiency (η/ηh = 9.01 × 10¹³) for the process forming the autocatalytic polypeptide. A list of values of the parameter ζ minimizing ω−1 is shown in Table 1 along with the corresponding ratio η/ηh. With the result in equation (9), equation (7) becomes
 $$\dot x_n = \displaystyle{{2{\rm \omega}} \over {1 - {\rm \omega} t}}x_n, \; $$
with solution
 $$\displaystyle{{x_n} \over {x_n^0}} = (1 - {\rm \omega} t)^{ - 2}. \; \; $$
A semilogarithmic plot of the ratio η/ηh as a function of the parameter ζ for the values of the amino acid source estimated by Chyba (blue) and Pasek (red).

Assuming that a catalytic polypeptide promotes only one reaction, the number of species formed by the action of the protoenzymes on substrates is of the same order of magnitude as p αn . Plots of (x i )cat and (x n )cat are shown in Fig. 3(a) for p = 10, α = 0.10, i = 70 and n = 80, ostensibly showing the dramatic effect of the singularity at t = ω−1 on the concentration of polypeptides of given length. We now turn our attention to the formation of possible reaction products catalysed by the polypeptides of length n. The Michaelis–Menten reaction rate for the transformation of a generic substrate z would be proportional to the product of the concentration of the catalyst (x n )cat, and z itself. The ratio k 2/k M is an indication of the catalytic ability of a polypeptide in promoting a chemical reaction on a substrate, and it must not be confused with the parameter ζ, relating to the spontaneous process forming the polypeptides. We may also safely assume the concentration z of a substrate to be larger than the typical steady-state concentration of the catalyst (x n )cat, and, for the sake of simplicity, assume the source of z to be of the same intensity as the source of amino acids. If the condition (x n )cat ≪ z ≪ k 2/k M is satisfied, the dynamics of the substrate follows the equation:
 $$\dot z = s - {\rm \lambda} z(1 - {\rm \omega} t)^{ - 2}, \; \; \; {\rm \lambda} = (k_2 /k_M )x_n^0 p^{ - {\rm \alpha} n}, $$
the explicit expression for λ in terms of the fundamental parameters being
 $${\rm \lambda} = (k_2 /k_M )p^{ - {\rm \alpha} n} (s/{\rm \omega} _{\rm h} )(1 - {\rm \zeta} )^2 {\rm \zeta} ^{n - 3}. $$
(a) Logarithm of the molar concentration of the autocatalytic species (x i )cat (blue) and the catalytic species (x n )cat (red) given by equation (13) with n = 80, i = 70, p = 10 and α = 0.10. (b) Logarithm of the molar concentration of the products of catalysis u/z 0 versus time without autocatalysis (blue) and with autocatalysis (red).

Equation (14) involves both ω, pertaining to the mean life of the polypeptides, and λ, pertaining to the mean life of their substrates. The solution to equation (14) is
 $$\displaystyle{z \over {z_0}} = e^{ - {\rm \lambda} t/(1 - {\rm \omega} t)} + \displaystyle{s \over {z_0}} \displaystyle{{\rm \lambda} \over {{\rm \omega} ^2}} e^{ - {\rm \lambda} /{\rm \omega} (1 - {\rm \omega} t)} \mathop \int \limits_{a_1} ^{a_2} \displaystyle{{d{\rm \xi}} \over {(\ln {\rm \xi} )^2}}, $$
where a
1 = e
λ/ω , and a
2 = e
λ/ω(1−ωt). Since
 $\mathop {\lim} \limits_{{\rm \omega} t \to 1} e^{ - {\rm \lambda} /{\rm \omega} (1 - {\rm \omega} t)} \int_{a_1} ^{a_2} $
 ${d{\rm \xi} /(\ln {\rm \xi} )^2 = 0} $
, we also have
 $\mathop {\lim} \limits_{{\rm \omega} t \to 1} z/z_0 = 0$
, with the important consequence that all the substrate z supplied by the source until t ≈ ω−1 is converted into the product u, which later varies linearly in time. The time when this event occurs (ω−1) is inversely proportional to the intensity of the source s, and is listed in Table 1 for various lengths of the autocatalytic polypeptide. For the purpose of calculation, we attribute to z
0 (the concentration of the substrate before the onset of catalysis) the value estimated by Pierazzo & Chyba (Reference Pierazzo and Chyba1999) for the oceanic concentration of glycine 4.0 Gyr ago originating from electrical discharge and cometary input (2.4 × 10⁻⁹ M). Using this estimate, we obtain s/z
0 = 1.18 × 10−
11 s−1 and K
eq
x
1 = 2.4.
Without catalysis (λ = 0), z would follow the law z/z 0 = 1+st/z 0, and the concentration of the reaction product u is thus given by the difference between 1+st/z 0 and equation (16)
 $$\displaystyle{u \over {z_0}} = 1 + \displaystyle{{st} \over {z_0}} - e^{ - {\rm \lambda} t/(1 - {\rm \omega} t)} - \displaystyle{s \over {z_0}} \displaystyle{{\rm \lambda} \over {{\rm \omega} ^2}} e^{ - {\rm \lambda} /{\rm \omega} (1 - {\rm \omega} t)} \mathop \int \limits_{a_1} ^{a_2} \displaystyle{{d{\rm \xi}} \over {(\ln {\rm \xi} )^2}}. $$
For comparison, we report the corresponding expression obtained for the system without autocatalysis (Canepa Reference Canepa2014)
 $$\displaystyle{u \over {z_0}} = (1 - e^{ - {\rm \lambda} t} )\left( {1 - \displaystyle{s \over {z_0 {\rm \lambda}}}} \right) + \displaystyle{{st} \over {z_0}}, \; $$
which near the time of the singularity, gives a widely different result. In fact, for a relatively large λ, occurring with n < 60, equation (18) gives values of u/z
0 which are larger with respect to equation (17). At higher values of n, λ is small but, as t approaches ω−1, the value of λ does not affect equation (17), while equation (18) always depends on λ. In this case, equation (17) affords the significant concentration of products u/z
0 ≅ 1+s/z
0ω, while equation (18) gives
 $u/z_0 \cong {\rm \lambda} t(1 - {\rm \lambda} t/2 + st/2z_0 ) \ll $
 $ 1 + s/z_0 {\rm \omega} $
. Thus, in the presence of autocatalysis, for t > ω−1, the reduced concentration u/z
0 increases in time with the rate s/z
0 = 3.72 × 10−
4 yr−1. The corresponding rate of increase of u/z
0 at t = ω−1 in the absence of autocatalysis is
 $e^{ - {\rm \lambda \omega} ^{ - 1}} ({\rm \lambda} - s/z_0 ) $
 $ + s/z_0 \cong {\rm \lambda} (1 - {\rm \lambda} /{\rm \omega} + s/z_0 {\rm \omega} ) = 4.11 \times 10^{ - 7} \; {\rm yr}^{ - 1} $
(n = 80). An estimate of the ratio of the concentration u
a of the product formed by the set of polypeptides promoted by autocatalysis and the corresponding concentration u formed by catalytic species based only on spontaneous polymerization of amino acids at t = ω−1 turns out to be u
a/u ≅ 2ω/λ. For i = n−10 this ratio takes the values 3.01 × 10², 1.81 × 10³, 1.33 × 10⁴ for n = 60, 80, 100, respectively. This dramatic effect is shown in Fig. 3(b), where u/z
0 with and without autocatalysis is plotted versus time. The values of the parameter ζ minimizing ω
−1 (ζmin) are listed in Table 1 along with the time of the singularity for the two values of p 10 and 20. In Table 2 are shown the molar concentrations (x
i
)cat and (x
n
)cat, the value of λ, the product u/z
0 and the total inventories of both the autocatalytic polypeptide promoting the formation of the peptide bond (f
i
) and the catalytic polypeptide promoting the formation of the product u (f
n
). The reduced concentrations of the products u/z
0 range from 100 to 105. Table 3 shows the effect of an increase of p on the state variables: the singularity moves forward in time causing an increase in the concentration of the products which is only apparent. These results must be considered in a time perspective of about 0.5 Gyr. Equations (10) and (11) give the occurrence of the singularity ω−1 and the ratio η/ηh, respectively, as functions of the parameter ζ. Figure 4(a) and (b) show the parametric curve η/ηh(ζ), ω−1(ζ) for the three values of the length i of the autocatalytic polypeptide. It is important to observe that the limit on the available time (ω−1 ≅ 0.5 Gyr) constrains the length of the polypeptides to less than ≈ 80 amino acid units.
Parametric curves (η/ηh, ω−1) for 0.50≤ζ≤0.99 and two values of the amino acid source, the average of the estimate by Chyba (a) and the estimate of Pasek (b). The horizontal dash lines mark t = 0.5 Gyr (green) and t = 1.0 Gyr (red).

For various values of n, p = 10, α = 0.10, k 2/k M = 1.0 × 10³ M−1 s−1, i = n−10, ζmin = 1 − 5/i and t = ω−1 are given: the molar concentration of autocatalytic polypeptides (x i )cat, the molar concentration of catalytic polypeptides (x n )cat, the rate coefficient for the transformation of the substrates (λ), and the concentration of products u/z 0 = 1 + s/z 0ω.

The total planetary inventories of the number of molecules of the autocatalytic species (f i ) and the catalytic protoenzyme (f n ) are also reported.
For various values of n, p = 20, α = 0.10, k 2/k M = 1.0 × 10³ M−1 s−1, i = n−10, ζmin = 1 − 5/i and t = ω−1 are given: the molar concentration of autocatalytic polypeptides (x i )cat, the molar concentration of catalytic polypeptides (x n )cat, the rate coefficient for the transformation of the substrates (λ), and the concentration of products u/z 0 = 1+s/z 0ω.

The total planetary inventories of the number of molecules of the autocatalytic species (f i ) and the catalytic protoenzyme (f n ) are also reported.
For completeness, we give an approximated expression of equation (16) for ωt ≪ 1. In this case, a 2−a 2≈λt and, since λt≪1 for sufficiently large values of n, we may expand in powers of t to the first-order the integral in equation (16)
 $$\mathop \int \limits_{a_1} ^{a_2} \displaystyle{{d{\rm \xi}} \over {(\ln {\rm \xi} )^2}} \cong \displaystyle{{{\rm \omega} ^2} \over {\rm \lambda}} e^{{\rm \lambda} /{\rm \omega}} t,$$
and obtain
 $$z/{z_0} = (1 + st/{z_0}){e^{ - \lambda t/(1 - \omega t)}},$$
for the concentration of substrates and
 $$u/{z_0} = (1 + st/{z_0})[1 - {e^{ - \lambda t/(1 - \omega t)}}],$$
for the concentration of the products. In summary, even if the proper time for reaction λ−1 exceeds the age of the Universe, and the concentration u/z 0 ≅ λtst/z 0 is small for a relatively small t, at t = ω−1 the concentration of z catastrophically goes to zero and the corresponding product u takes the value 1+s/z 0ω. Afterwards, u grows linearly with time with rate s/z 0 = 3.72 × 10− 4 yr−1. To be able to limit the time of the singularity within 0.5 Gyr from the onset of the source, the length of the autocatalytic species must not exceed 70 amino acid units, and the environment must provide a rate enhancement for polypeptide formation with respect to hydrolysis (η/ηh) of the order of 1014 (Fig. 4(a)). It is an open question whether this value of the polypeptide length is compatible with the assumed catalytic efficiency for substrate transformation k 2/k M ≈ 103. This overall picture on the formation of reaction products enhancing the chemical diversity of the prebiotic environment is dependent on the intensity of the source; for example, the increased value proposed by Pasek & Lauretta (Reference Pasek and Lauretta2008) for the organic carbon source would be able to form an autocatalytic polypeptide with 95 amino acid units and decrease the ratio (η/ηh) to 1013 (Fig. 4(b)). Since an exogenous amino acid source is related to the flux φ by the expression s = 4πR 2φ/(VN A)=φ/(hN A), with h being the thickness of the water column, we could have a significantly increased source in isolated shallow bodies of water. The source in a relatively small aqueous environment of depth h s would be increased by a factor of h/h s with respect to the ocean of average depth h. Thus the increased attainable length of the polypeptides depicted in Fig. 4(b) is not necessarily a consequence of an increased amino acid flux, but it could also be the effect of the isolation of a shallow body of water provided its volume V would still satisfy the minimum requirement for the total inventory of catalytic polypeptide molecules f n = x n VN A p −α n > 1.
Conclusions
-
1. In the absence of autocatalysis, the stationary concentration of polypeptides of length n, formed in the primordial ocean upon environmental catalysis with efficiency ζ on the incoming flux of monomeric amino acids is x n = ζ n−1 x 1. The molar concentration u of products (originating by the transformation of substrates z promoted by the catalytic polypeptide x n ) is
 $u/z_0 = 1 + s(t - {\rm \lambda} ^{ - 1} )/z_0 - e^{ - {\rm \lambda} t} (1 - s/z_0 {\rm \lambda} )$
, increasing nearly linearly in time with initial rate λ(1−λ/ω+s/z
0ω) = 4.11 × 10⁻⁷ yr−1 (n = 80).
-
2. In the presence of autocatalysis, the corresponding time-dependent concentration of polypeptides of length n is x n /x n 0=(1−ωt)−2, exhibiting a catastrophic increase at t = ω−1. At later times, the relevant time-dependent molar concentration of the products of catalysis is u/z 0 = 1+s(ω−1+t)/z 0, increasing linearly with time with rate s/z 0 = 3.72 × 10 − 4 yr−1.
-
3. The time of the singularity (equation (10)) and the required catalysis for the formation of the peptide bond (equation (11)) are related through the parameter ζ. The resulting family of parametric curves (one for each polypeptide of length n at a given value of the amino acid source) determines the interval of the ratio η/ηh attaining the singularity within the time frame of chemical evolution. Even for the highest estimates of the intensity of the amino acid source, the required environmental catalytic ability to form peptide bonds and realize the spontaneous formation of an autocatalytic polypeptide before the onset of autocatalysis would have to border the catalytic activity of the present-day enzymes.

Acknowledgement
The author wishes to thank Professor Paolo Cermelli for discussing the properties of the integral function in equation (16).



