NOMINATE AND CONGRESSIONAL DEVELOPMENT
Poole and Rosenthal's NOMINATE project has been a boon to the study of congressional history and of American political development more generally.Footnote 1 By placing legislators and roll calls in a Common Space, DW-NOMINATE and other variants of the basic NOMINATE procedure have permitted the development of measures of concepts such as partisan homogeneity and polarization that (potentially) “travel” across time, greatly facilitating the analysis and comparison of congressional politics across American history. A wide range of studies have employed NOMINATE-based measures to track these concepts over a long time span and to test competing theoretical models.Footnote 2 It is fair to say that no data source has had a greater impact on the study of legislative politics—both historically and in the contemporary period—than the NOMINATE project.
NOMINATE scores provide a statistical summary of legislators' voting behavior. The scores themselves do not have any inherent meaning independent of the theoretical and substantive framework that we use to interpret them. For Poole and Rosenthal, this theoretical framework derives from a formal model of legislative behavior: NOMINATE scores are estimated based on a spatial model of legislators' voting decisions, along with a set of assumptions about voting errors and about change in legislators' preferences over time. By itself, this formal model does not necessarily imbue the resulting scores with ideological meaning, and it is often possible to make use of the scores without giving them an ideological interpretation.Footnote 3 But when scholars interpret NOMINATE scores as measures of members' ideological positions—as opposed to as a simple summary of patterns of voting behavior—the problem of substantive interpretation comes to the fore.
Comparing the scores to substantively meaningful benchmarks is a key step in this interpretive process. One such benchmark is to see how well members' scores on each dimension predict their votes in particular substantive domains, such as labor policy, regulatory policy, or civil rights. In their landmark book, Congress: A Political-Economic History of Roll Call Voting, Poole and Rosenthal trace changes in the predictive power of each NOMINATE dimension for a wide range of issues across American history.Footnote 4 Based on this analysis, Poole and Rosenthal conclude that conflict over economic issues—the role of the government in the economy and battles over redistribution—have generally been central to the first NOMINATE dimension, whereas issues relating to race and region have tended to define the second dimension during eras when a single dimension has proven insufficient, such as the 1930s–70s.
Beyond specific issue areas, the argument that first-dimension NOMINATE scores reflect liberal–conservative ideology in contemporary politics is greatly bolstered by the finding that first-dimension scores are highly correlated with ideological scales that were created precisely to distinguish liberals from conservatives, such as Americans for Democratic Action (ADA) and American Conservative Union (ACU) scores. Given that such interest-group scores are far more temporally limited than NOMINATE—while also suffering from important methodological weaknesses, such as the problem that interest groups may choose votes that generate “artificial extremism”—the case for preferring NOMINATE scores to these measures is a strong one.Footnote 5
Our confidence that NOMINATE scores map well onto today's liberal–conservative continuum does not, however, tell us how to interpret these scores in earlier eras. Nor does it resolve the difficult problem of comparing scores measured at different points in time. In this article, we highlight the limitations of NOMINATE scores for analyzing ideological conflict and change over the broader sweep of American history. We argue, first, that during certain historical periods NOMINATE scores have serious shortcomings as measures of ideological (as opposed to partisan) divisions as they were understood by political observers at the time. Second, even in eras when NOMINATE scores are ideologically interpretable, assumptions imposed to “bridge” the scores between congressional terms can render them inappropriate for examining ideological change over time. These interpretive difficulties can be ameliorated, however, by using ideal-point models and roll call subsets tailored to the research question of interest—a strategy that advances in software and computing have made increasingly feasible for applied researchers.
We illustrate this argument with the aid of two case studies, both focusing on the U.S. Senate. The first considers the challenge of interpreting NOMINATE scores in the 1920s, when ideological conflict between economic conservatives and progressives did not map neatly onto party lines. As evidenced by the Democrats' nomination of pro-business corporate attorney John W. Davis to face Calvin Coolidge in the 1924 presidential election, conservatives in this era enjoyed considerable influence within both parties. Dissatisfied with the perceived conservatism of the major parties, Robert La Follette Sr. of Wisconsin led a faction of progressive Republicans, which outflanked both parties on the “left” during these years. We assess how closely NOMINATE scores correspond to the progressive–conservative cleavage in Senate roll call voting. We find that first-dimension scores do distinguish conservative from progressive Republicans, but are much less effective in detecting differences among Democrats. We show that progressive–conservative cleavage in voting behavior is more clearly captured by alternative ideal-point measures estimated on the subset of roll call votes identified as key votes by progressive interest groups.
The second case study examines Senate politics during the presidency of Franklin D. Roosevelt, a time of unusual ideological flux. Our focus is the ideological evolution of Southern Democrats, who began the period as strong supporters of Roosevelt's New Deal but ended it as frequent allies of Republicans in limiting and retrenching economic reforms backed by New Deal liberals. Like our examination of the 1920s, this second case study illustrates how estimating ideal points using a subset of roll calls—in this case, votes on the economic issues at the core of the New Deal issue agenda—can aid substantive interpretation of the resulting scores. In addition, we also use this application to illustrate the specific limitations of DW-NOMINATE, which constrains ideal points to move linearly through time, for examining rapid or non-monotonic ideological change. Based on estimates from a more flexible dynamic item response theory (IRT) model, we show that Southern senators' turn against New Deal liberalism occurred later and much more rapidly than first-dimension DW-NOMINATE scores imply.
The remainder of this article is organized follows. We begin with the case of progressive–conservative conflict in the 1920s Senate. We then discuss the case of Southern Democrats' evolving positions towards New Deal liberalism. The final section explores the implications of our findings not only for thinking about NOMINATE scores' historical applicability, but also for the question of how to conceptualize and measure ideological cleavages across time.
IDEOLOGICAL SUBSTANCE: SENATE PROGRESSIVES AND CONSERVATIVES IN THE 1920S
Poole and Rosenthal characterize Senate politics in the 1920s as part of a stable party system that emerged in the 1850s and persisted through the late 1930s, when it was “perturbed” by Southern and non-Southern Democrats' split over civil rights issues. During this era, the first NOMINATE dimension mainly captures conflict over “the role of government in the economy.”Footnote 6 Second-dimension conflict was generally unimportant but erupted occasionally over a varying set of issues, such as interstate commerce and antitrust in the 66th Senate (1919–20).Footnote 7
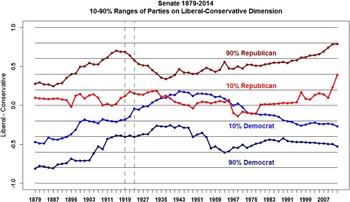
In addition to being predominantly one-dimensional, the 1920s Senate also featured relatively high partisan polarization between Democrats and Republicans. Although the first-dimension distance between the two party caucuses declined over the decade, Democratic and Republican senators were about as polarized in the 1920s as they were around 1990, and much more polarized than they were in the 1930s–60s.Footnote 8 Moreover, in the 1920s Democrats and Republicans overlapped very little on the first NOMINATE dimension. One way to see this is through Figure 1, generated by Poole and Rosenthal, which plots the 10th and 90th percentiles of senators' first-dimension DW-NOMINATE scores in each party over time. Notice that throughout the 1920s, the Republican who is at the 10th percentile of “conservatism” for the party (i.e., with a NOMINATE score lower than 90 percent of Republicans) was still more conservative than the Democrat at the 10th percentile of “liberalism” for his party (i.e., with a score higher than 90 percent of Democrats). In short, this figure suggests the Senate delegations of the two parties were clearly separated from one another along a dominant “liberal–conservative dimension.”
Polarization in the Senate. (Reprinted from Keith T. Poole and Howard Rosenthal, “The Polarization of the Congressional Parties,” March 21, 2015, http://voteview.com/political_polarization_2014.htm). We have added dashed vertical lines at the 66th (1919–20) and 68th (1923–24) Congresses to indicate the time period we focus on.

This image of an ideologically polarized Senate, however, is difficult to square with other accounts of U.S. politics in the 1920s. Historians of early twentieth-century America describe it as “an era of shifting, ideologically fluid, issue-focused coalitions,” at most loosely affiliated with one party or the other.Footnote 9 Many of these groups and tendencies could be broadly termed “progressive” and their opponents “conservative,” but progressivism, especially at the turn of the century, was too fragmented and internally contradictory to be considered a single coherent movement.Footnote 10 Nevertheless, by the century's second decade a distinct progressive ideology, emphasizing government action to regulate and ameliorate the excesses of capitalism, had begun to be articulated by journalists and intellectuals in publications such as the New Republic.Footnote 11 Even as progressivism grew in internal coherence, its adherents expressed increasing frustration with the major parties as vehicles for their policy goals. Earlier in the century, during the presidencies of the Republican Theodore Roosevelt and the Democrat Woodrow Wilson, both parties had been at least somewhat receptive to progressive reforms. But in the 1920s, both parties turned rightward, a shift exemplified by the 1924 presidential contest between Democrat John W. Davis, a business-friendly corporate attorney, and the Republican incumbent Calvin Coolidge, a champion of small-government conservatism.Footnote 12 Disenchanted with the two-party system, reformists of various persuasions organized to put forward a unified program outside the two major parties, an effort culminating in erstwhile Republican Robert La Follette's 1924 presidential run on the Progressive Party ticket. This program won greater support from Democrats than from Republicans, but its most committed supporters typically were found among Republicans.
Within Congress itself, conflict between conservatives and various “insurgent” forces was a central, even dominant, feature of the 1920s. Throughout the decade, the reactionary “old guard” wing of the majority-party Republicans battled the Farm Bloc, Progressive Bloc, and other dissident groups of legislators from both parties. Robert Murray, for example, writes that the 67th Congress (1921–23) was characterized by the “undisciplined and unpredictable partisanship of competing intra-party vested-interest groups.” These groups included old guard Republicans, Southern Democrats who supported “favorable regional legislation but opposed almost everything else,” urban members who were surfacing as a definable group, and most importantly, a Farm Bloc seeking to “force the government to help them out of the agricultural depression.”Footnote 13 Murray traces the severe challenges facing Republican leaders as they sought to control the agenda amid these divisions, arguing that the tax and tariff legislation that emerged was severely compromised.Footnote 14 “The blocs,” concluded one contemporary observer, “have written most of the domestic political history of the past three Congresses, and have made largely negative the role of the chief executive of the nation.”Footnote 15 Progressives' success peaked in the closely divided 68th Congress (1923–24) when they emerged victorious on several significant matters, including the numerous amendments that “mutilated” Secretary of the Treasury Andrew Mellon's tax program.Footnote 16
Such ideological divisions rent not only the Republicans, who controlled Congress throughout the 1920s, but Democrats as well. The historian John Hicks, citing the bitter primaries fought in the South between upper-class conservatives and lower-class radicals, suggests that within the Democratic caucus there was “even less cohesion than among the Republicans.” Noting that conservatives generally emerged victorious from those primary battles, Hicks depicts the Southern Democrats as largely conservative, as does Murray.Footnote 17 By contrast, Erik Olssen emphasizes most Southern Democrats' support for progressive initiatives, particularly to regulate business, tax high incomes and corporations, and help farmers. But he too highlights divisions between “radicals” such as Thomas Heflin of Alabama and Morris Sheppard of Texas, who were deeply skeptical of concentrated wealth and corporate power, and more conservative, pro-business Southerners, such as Alabama's Oscar Underwood. Olssen traces a series of high-profile battles over tax and regulatory policy in which Democratic divisions played a prominent role.Footnote 18 Regardless of whether they emphasize the Democratic caucus's conservatism or progressivism, however, scholars agree that ideological divisions within the Democratic Party were also an important facet of 1920s politics.
In sum, despite the two parties' polarization along the first NOMINATE dimension, many of the most salient ideological battles of the 1920s Senate divided the parties internally. It is thus at least questionable to regard first-dimension NOMINATE scores as measures of senators' positions on the liberal–conservative (or, less anachronistically, progressive–conservative) spectrum. One way to evaluate the validity of such an interpretation is to compare NOMINATE with indices constructed at the time precisely for the purpose of capturing support for a particular ideological program.Footnote 19 To do so, we exploit a little-known data source: lists of roll call votes used by progressive organizations to evaluate senators' support for their program. As Olssen reports, the leading progressive organization in the early to mid-1920s, the Conference for Progressive Political Action (CPPA), identified seventy-five roll call votes in the Senate from 1919 to 1924 that it used to evaluate the progressive bona fides of senators. Similar lists were created by two other reform groups, the American Federation of Labor (AFL) and the Farm Bloc.Footnote 20 After matching these roll calls to data on senators' voting records, we estimated senators' ideal points in each roll call subset. Comparing these domain-specific ideal points with senators' NOMINATE scores allows us to evaluate whether the latter correspond to ideological conflict as important actors at the time understood it.
CPPA Ideal Points
We begin with a discussion of the CPPA ideal points. The CPPA's origins lay in a December 1920 meeting called amid concern that conservatives had captured both parties. Sixteen railroad labor brotherhoods, the Non-Partisan League, Farmer-Labor Party, and Farmers' National Council met with Senators Robert La Follette (R-WI), George Norris (R-NE), and David Walsh (D-MA) to discuss strategy. The progressives created the People's Legislative Service (PLS) as a research organization to serve like-minded members of Congress (MCs); La Follette became president of the PLS and George Huddleston, a House Democrat representing industrial Birmingham, was its first vice president.Footnote 21 Funded largely by railway labor unions, the PLS reflected an important shift in the meaning of progressivism, as concerns for labor rights were brought into a policy program that had, in the first two decades of the twentieth century, not been closely linked to labor unions.Footnote 22 The CPPA grew out of the PLS as an umbrella organization for various progressive and radical groups, and in 1924 it spearheaded La Follette's third-party presidential bid. Although the CPPA disbanded after La Follette's defeat, progressive Republicans continued to collaborate with like-minded Democrats in opposing the pro-business designs of GOP leaders.
The seventy-five Senate roll calls identified by the CPPA give a sense of the progressive program in the early to mid-1920s. The positions associated with the progressive cause include support for strong railroad regulation, protections for labor rights (e.g., deleting an anti-strike clause from railroad legislation), farmer cooperatives and regulation of agricultural processors, higher corporate taxes, publication of tax returns, higher inheritance taxes and taxes on high incomes, excess profits taxes, and the Child Labor Constitutional amendment. The single most common category of roll calls identified by the CPPA concerned taxation, with the group pushing for imposing a heavier burden on major corporations and the wealthy. None of the roll calls focused on tariffs, which was perhaps the most important economic issue separating Democrats and Republicans, but which had only an ambiguous relationship to progressivism.Footnote 23
The progressive program put forward by the CPPA clearly prefigured what would in the following decade become known as “liberalism.” It is worth noting, however, that some of the concerns of liberalism in later decades found no place on the progressive agenda. Most obviously, progressives ignored issues of racial equality and civil rights, which by midcentury had been incorporated into liberalism. For example, the anti-lynching bill considered in the 67th Congress (1921–23) is not mentioned. Indeed, one of the triumphs enjoyed by progressives in January 1924 was the defeat of Albert Cummins (R-IA) as Chair of the Interstate Commerce Committee and his replacement by Democrat Cotton Ed Smith of South Carolina, a vigorous defender of Jim Crow.Footnote 24
To measure senators' support for the progressive program, we estimate a one-dimensional IRT model using only the roll calls identified by the CPPA. Like NOMINATE, IRT is a framework for estimating subjects' latent trait (e.g., their ideal point) from their dichotomous choices (e.g., roll call votes).Footnote 25 In an IRT model, the probability that senator i votes yea on a bill j is a function of the senator's ideal point (θ i ) and the “difficulty” (α j ) and “discrimination” (β j ) of the bill:
 $${\rm Pr}(y_{ij} = {"{\rm yea}"}) = \Phi (\beta _j\theta _i - \alpha _j),$$
where Φ is the cumulative distribution function of the normal distribution. An IRT model can be justified theoretically as an operationalization of a spatial model of voting in one dimension,Footnote 26 but it can also be justified empirically as a data summarization technique, akin to factor analysis. Under the latter interpretation, IRT ideal-point estimates can be thought of as a rescaled weighted proportion of bills on which a senator supported the progressive alternative, with the weights determined by how correlated voting on a given bill is with voting on other bills in the sample.
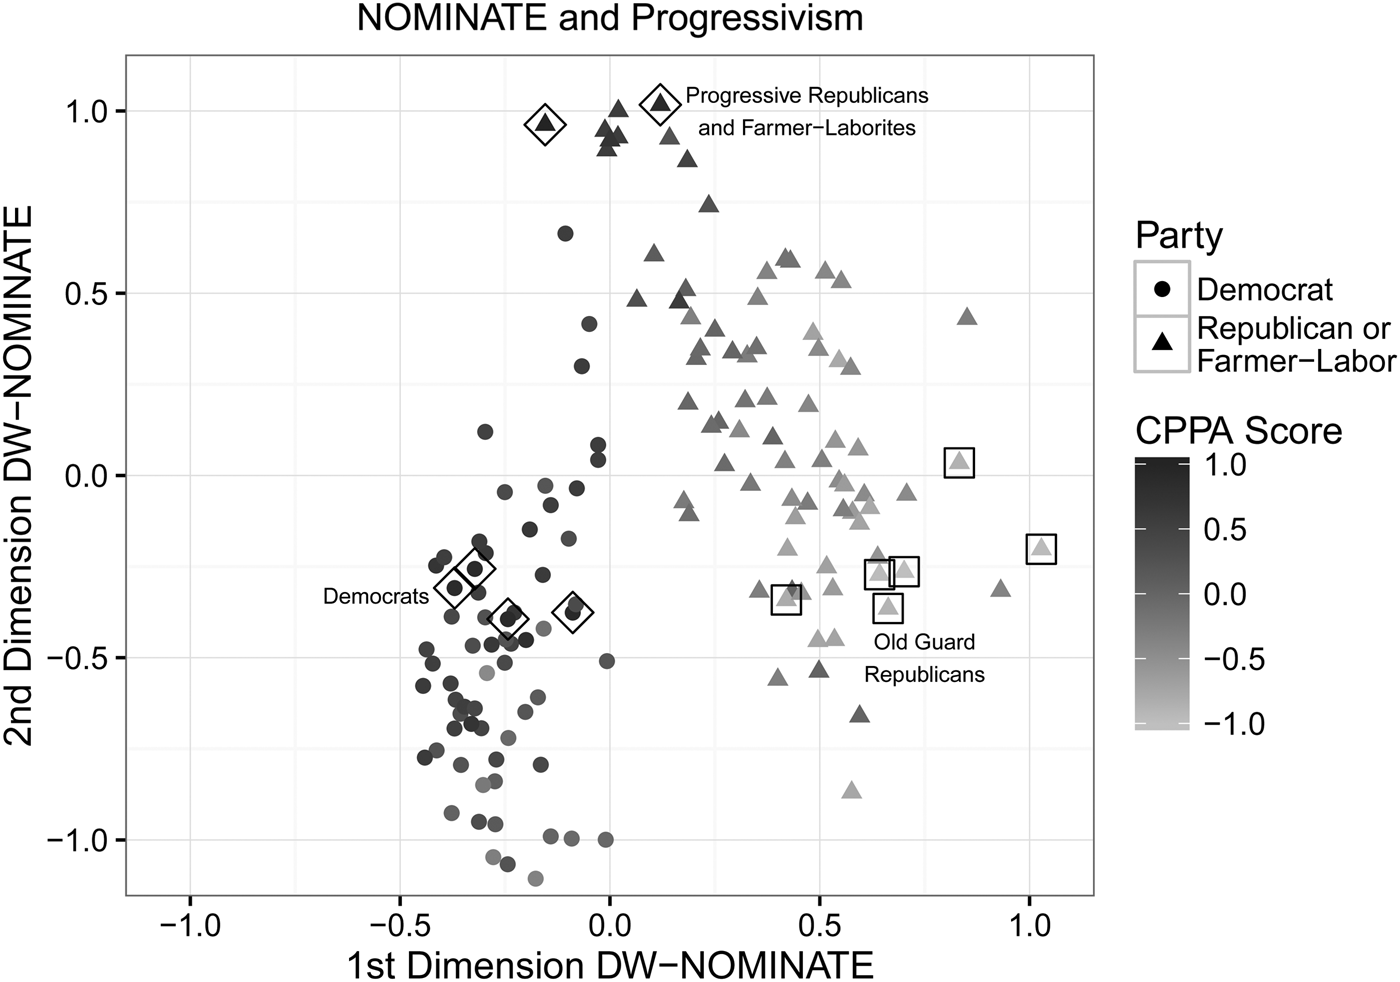
Figure 2 provides a scatterplot of first- and second-dimension NOMINATE scores and their relationship with CPPA scores. Republicans and Farmer-Laborites are indicated with triangles and Democrats with circles. The plot averages each senator's DW-NOMINATE scores over the 66th to 68th Congresses (1919–24), the three during which CPPA votes occurred.Footnote 27 Darker plots indicate higher CPPA scores, which have been scaled to range from −1 (least progressive) to +1 (most progressive). To highlight the extremes of the scale, the figure also indicates the six most progressive (hollow diamonds) and least progressive (hollow squares) senators. The extreme low scorers are all Northeastern old guard Republicans located in the lower-right quadrant of two-dimensional NOMINATE space. By contrast, the highest scorers are split into two clusters. One, composed of Midwestern Republicans and Farmer-Laborites such as Wisconsin's La Follette, is located at the top of the second dimension but in the middle on the first. The second cluster, which includes Southern and Western Democrats such as Morris Sheppard of Texas and John Kendrick of Wyoming, is about even with old guard Republicans on the second dimension but far to their left on the first dimension. Thus, while Democrats were typically more progressive than Republicans, with an average CPPA score of 0.37 versus −0.28, the GOP contained both the most and least progressive members of the Senate.
Senate CPPA Scores in Two-Dimensional NOMINATE Space, 1919–24. Hollow diamonds indicate the six most progressive senators (i.e., with the highest CPPA scores), and hollow squares indicate the six least progressive senators.

By the typical interpretation of first-dimensional NOMINATE, under which higher scores indicate greater conservatism, we should expect that senators with high (progressive) CPPA scores to have low first-dimension NOMINATE scores. We do see a good deal of evidence for this in Figure 2: The lightest (least progressive) senators are, with a few exceptions, found on the right side of the plot. The bivariate correlation between the CPPA and first-dimension scores is an impressive −0.80, stronger than the correlation between CPPA scores and Democratic Party affiliation (r = 0.65), though weaker than the correlation between NOMINATE and ADA or ACU scores in more recent Congresses. It is thus clear that first-dimension NOMINATE scores do broadly distinguish between progressives and conservatives, as those terms were understood at the time.
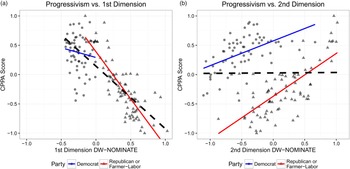
On the other hand, it is also evident that first-dimension NOMINATE does a much better job of picking up ideological variation within the Republican caucus than within the Democratic one. CPPA and first-dimension scores are nearly as strongly correlated among Republicans alone as they are among all senators. The correlation among Democrats, however, is a mere −0.13. The weak relationship within the Democratic caucus can more easily be seen in the left panel of Figure 3, which plots CPPA scores against first-dimension DW-NOMINATE. And while it is true that the variation in progressivism among Democrats (standard deviation, SD = 0.30) is smaller than among Republicans (SD = 0.43), it is clear that there are also substantial differences between Democrats—differences poorly explained by first-dimension NOMINATE scores, which vary relatively little within the Democratic caucus.
Senate CPPA Scores by First- and Second-Dimension NOMINATE Scores. The black dashed line indicates the relationship for all senators, and the colored lines indicate the within-party relationships.

Consider, for example, the contrast between Democratic senators John Kendrick of Wyoming and Oscar Underwood of Alabama. Kendrick, the rightmost diamond in the Democratic cluster in Figure 2, was a leading organizer of progressives in the Senate and had the second-highest CPPA score of any senator. In the 66th Congress (1919–20), for example, Kendrick spearheaded an unsuccessful effort to create a Federal Livestock Commission empowered to break the domination of the “Big Five” packing companies.Footnote 28 Despite his status as a leading progressive, however, Kendrick's relatively high first-dimension DW-NOMINATE score of −0.09 classifies him as one of the most “conservative” Democrats in the Senate (to the right of over 80 percent of his co-partisans). According to DW-NOMINATE, Oscar Underwood was considerably to the left of Kendrick. The Democratic leader in the Senate between 1920 and 1923 (and previously majority leader in the House), Underwood's first-dimension score of −0.27 was exactly at the median in the Democratic caucus and around the 20th percentile in the Senate as a whole. Underwood's CPPA score of 0.14, however, reveals him to have been one of the least progressive Democrats in the Senate (only 19 percent of Senate Democrats had a lower score) and a moderate relative to the chamber as a whole. The first-dimension scores of other progressive Democrats, such as Massachusetts's David Walsh (−0.19) and Texas's Morris Sheppard (−0.37), are similarly uninformative, given that they do not clearly distinguish them from relative conservatives such as Carter Glass of Virginia (−0.36) and Joseph Robinson of Arkansas (−0.36).
The CPPA's classification of Underwood, Glass, and Robinson as conservative Democrats is consistent with how they were viewed by observers at the time. Underwood, for example, was frequently portrayed as a leader of the conservative faction of the Democratic Party.Footnote 29 When Underwood ran for president in 1924, progressive Democrats regarded him as “too conservative to make the Democratic party thoroughly progressive.” One referred to him as “reactionary,” and another as “the Republican Administration's candidate for the Democratic nomination.”Footnote 30 In 1925, when Treasury Secretary Mellon moved to undo the tax increases recently pushed through by Sheppard, Walsh, and other progressives, Underwood—described by the Los Angeles Times as “one of the conservative leaders of the Democratic party”—showed himself “in sympathy in large measure” with Mellon's program.Footnote 31 He was joined by Senator Glass, who with Underwood backed “a program of tax reduction [for high earners] diametrically opposed to the plan of Democratic leaders.”Footnote 32 Underwood, along with the “inherently conservative” Robinson, was also a key ally of President Coolidge in the latter's battle to block George Norris's proposal to produce public power using Alabama's Muscle Shoals Dam (a plan ultimately fulfilled by the Tennessee Valley Authority in 1933).Footnote 33
Substantively, a left-of-center score on first-dimension NOMINATE was thus consistent with being either a strong advocate of corporate regulation, progressive taxation, and public power, like Kendrick, Walsh, and Sheppard, or an opponent of such progressive measures, like Glass, Robinson, and Underwood. What, then, are first-dimension scores measuring? As Poole and Rosenthal note, the first NOMINATE dimension almost always describes conflicts that divide the two parties. Thus, extreme first-dimension scores can be interpreted as measuring party loyalty as much as anything else. And Glass, Underwood, and Robinson—the latter two of which successively served as Democratic floor leaders in the Senate—were indeed party loyalists. In the 1920s (and for Robinson into the 1930s), this loyalty often led them to support party-line positions that put them on the progressive side of some issues, but their personal conservatism (and that of their most important constituents) often dominated on more ideological issues on which party loyalty did not control.
What about the second NOMINATE dimension? At other points in history, the second dimension picks up liberal–conservative conflict over issues orthogonal to the parties, such as civil rights in the 1950s and 1960s. Was this the case for the issues that defined progressivism? The answer is a qualified yes. In the Senate as a whole, second-dimension and CPPA scores are entirely uncorrelated, as indicated by the dashed line in right panel of Figure 3. If Democrats and Republicans are examined separately, however, a strong relationship emerges within each party.Footnote 34 While Republican senators were much more conservative than Democrats, Republicans with high scores on the second dimension were about as progressive (in terms of CPPA votes) as Democratic low scorers on the second dimension.
It is worth emphasizing that the second dimension in the 1920s had little to do with racial issues, not least because there were very few roll calls on such issues during this decade (nor were any civil rights roll calls included in the CPPA votes). Indeed, in the 1920s the ideological polarity of the second dimension is the opposite what it would become later in the century, when higher scores on the second dimension came to indicate racial and social conservatism. Among the large majority of Democratic senators in these years who were Southern, there was little observable variation in racial conservatism, as all were firmly committed to Jim Crow.Footnote 35 Southern Democrats nevertheless exhibited large variation on the second NOMINATE dimension as well as in their CPPA scores, and the relationship between the two sets of scores is about as strong within this group as among Democrats as a whole.
In addition to conforming more closely to contemporaries' and historians' views of the ideological leanings of individual senators, the CPPA scores also fit better with many observers' conviction that the two parties were far from ideologically polarized. Both parties had their progressive and conservative wings, and although the Republicans were by the 1920s considered more conservative overall, the party also contained several of the foremost leaders and organizers of the progressive movement. The ideological overlap between the two parties can easily be seen in Figure 4, which plots the distributions of CPPA scores in the two parties. In stark contrast to Figure 1, which portrays the parties in this period as clearly separated on the first NOMINATE dimension, Figure 4 highlights their ideological overlap. Unlike Figure 1, for example, the Democratic senator in the 10th percentile of progressivism of his party is substantially more conservative than the Republican in the 90th percentile for his party. Indeed, the CPPA scores of fully 13 percent of all senators (9 percent of Democrats and 16 percent of Republicans) were closer to the opposing party's median than to their own party's, as compared to only 3 percent of senators (all of them Republicans) that were closer to the opposing party on the first NOMINATE dimension.Footnote 36
Kernel Density Plot of CPPA Scores in the Democratic and Republican Caucuses, 1919–25. The dashed and dotted lines indicate the 10th- to 90th-percentile ranges of the Republican and Democratic distributions, respectively. This plot pools together all senators who served in the 66th through 68th Congresses, with the exception of the two Farmer-Labor senators, both of whom had high CPPA scores.

In sum, the comparison of NOMINATE and CPPA scores suggests some of the strengths and limitations of our workhorse measure of member ideology. On the one hand, senators' first-dimension DW-NOMINATE scores are highly correlated with their CPPA scores, suggesting that the first NOMINATE dimension does capture conflict between conservatives and progressives in this era. Moreover, the second dimension also distinguishes conservatives and progressives within each party. On the other hand, as direct measures of senators' ideological orientation, NOMINATE scores on both dimensions leave much to be desired. This is especially true for Democrats, whose first-dimension NOMINATE scores vary little and are only faintly related to their placement on the progressive–conservative spectrum. First-dimension scores thus convey little more information about Democrats' ideological orientation than simply knowing their party affiliation. More importantly, using a more direct measure of senators' progressivism yields a different picture of 1920s politics, one more in line with the accounts of historians and contemporaneous observers. Unlike NOMINATE, which suggests that partisan polarization in the 1920s Senate was nearly as severe as it is today, CPPA scores portray a political world in which the parties had not yet clearly sorted themselves ideologically.
AFL and Farm Bloc Scores
In this section, we present analogous (but briefer) analyses of roll call lists compiled by two other organizations, the AFL and the Farm Bloc. Both of these groups were affiliated with progressivism, though each had its own distinctive concerns. As we did with the CPPA list, we measure senators' support for each group's priorities with a one-dimensional IRT model estimated using only the roll calls included on the group's list of key votes. Broadly speaking, this analysis uncovers the same patterns as our examination of CPPA scores.
The AFL was the leading labor organization in the country in the early twentieth century. Dominated by craft unions, the AFL had a somewhat ambiguous ideological reputation, and it was clearly more conservative than the Congress of Industrial Organizations (CIO), the rival labor federation that in 1935 formed to challenge it. Although the AFL often refrained from direct involvement in electoral politics, the group did track senators' support for its priorities using twenty-six roll calls between 1920 and 1930.Footnote 37 The topics on this list, which include railroad regulation, progressive income taxation, publication of income tax returns, and public power development, overlap substantially with the CPPA list. Several votes related to labor policy, of course, but the AFL also included votes in favor of McNary-Haugen and other legislation sought by farmers. Most of the positions backed by the AFL in these roll calls were consistent with the outlook that more clearly “liberal” unions—such as those in the CIO—would put forward in the late 1930s. The one exception is that the AFL coded support for the restrictive Immigration Act of 1924 as pro-labor, a position that the CIO and other labor liberals of the late 1930s and 1940s would not have taken.Footnote 38
The AFL-based ideal points track first-dimension NOMINATE scores and CPPA scores fairly closely. For the Senate as a whole, AFL scores correlate at −0.75 with NOMINATE scores and at 0.87 with CPPA scores.Footnote 39 Once again, AFL scores correspond much more closely to the first NOMINATE dimension for Republicans than for Democrats: The correlation between the two measures is −0.69 for Republicans and just −0.13 for Democrats. In other words, the first NOMINATE dimension has almost no predictive power with respect to Democrats' AFL support scores. By contrast, CPPA and AFL scores do track one another fairly well for Democrats, with a correlation of 0.64 (as compared to 0.79 for Republicans). The AFL and CPPA indices thus suggest that there was a structure to Democratic voting on a progressive–conservative dimension that is essentially orthogonal to the first NOMINATE dimension.Footnote 40
Despite its focus on agricultural rather than labor issues, the Farm Bloc scores yield similar patterns to the AFL scores. The Farm Bloc rose to prominence in 1920–21 but faded as progressives became a more organized force in Congress by 1923. In the interim, the group pushed an aggressive program of policies designed to bail out farmers facing severe economic challenges in the aftermath of World War I. Olssen compiled a list of thirty-three roll calls that he attributes to the Farm Bloc program.Footnote 41
The Farm Bloc scores correlate reasonably strongly with first-dimension NOMINATE scores. For the full chamber, the correlation is −0.74 (for senators serving in the 66th and 67th Congresses, which is the time period for the Farm Bloc votes). Among Republicans, Farm Bloc votes are very closely tied to NOMINATE scores (r = −0.78 on the first dimension, r = 0.77 on the second dimension). Among Democrats, the relationship is again much weaker (r = −0.43 for first-dimension scores, 0.30 for the second dimension). Farm Bloc votes are also closely correlated with both the CPPA and AFL indices: for the full chamber, all of the correlations are in the range of 0.79 to 0.86. Similarly, the three sets of scores (AFL, Farm Bloc, and CPPA) are correlated at 0.77 to 0.88 for Republicans. Among Democrats, the Farm Bloc scores are fairly closely related to CPPA (r = 0.62) and AFL (r = 0.50) ideal points.
In sum, the three alternative measures of progressivism—derived from votes identified by the CPPA, AFL, and Farm Bloc—are all correlated with first-dimension NOMINATE, but this correlation is almost entirely driven by Republicans. Among Democrats, the group-specific scores have little relationship with the first NOMINATE dimension. They are, however, highly correlated with each other, reinforcing the conclusion that they measure a distinct progressive dimension not fully captured by first-dimension NOMINATE, especially within the Democratic Party. Moreover, all three sets of scores suggest that Democrats and Republicans were much less ideologically polarized than first-dimension NOMINATE scores would imply.Footnote 42
More broadly, these findings suggest that scholars should exercise considerable caution in their interpretation of NOMINATE scores in this era. Neither first- nor second-dimension scores can be interpreted as straightforward measures of senators' conservatism, as that term was understood at the time. This is particularly true of Democrats, whose considerable ideological variation is poorly captured by the limited range of their NOMINATE scores. Thus, if analysts require substantive measures of MCs' ideological positions, as opposed to mere summaries of their voting patterns, they may be better off constructing ideal-point scores tailored to their substantive purposes. Difficulties of interpretation become even more severe when the goal is comparison over time. The parties' polarized NOMINATE scores in recent Congresses clearly reflect deep ideological differences between the Democrats and Republicans, but as Figure 4 reinforces, the same cannot be said of the 1920s. How then should we compare of polarization and homogeneity across time? There is no easy answer to this question. But given the divergence between NOMINATE scores and more direct measures of ideology, scholars would be on safer ground if they interpreted NOMINATE-based polarization measures as measuring merely the divergence between the roll call patterns of the two parties on the main dimension of congressional conflict, not as ideological differences on a liberal–conservative scale.
IDEOLOGICAL CHANGE: SOUTHERN SENATORS IN THE AGE OF FDR
If progressives found the 1920s a time of frustration with both major parties, the 1930s brought a welcome increase in ideological clarity to the American party system. Franklin Roosevelt's embrace of activist regulatory, developmental, and social-welfare policies positioned the Democratic Party—or at least its presidential wing—clearly on the left of the political spectrum, occasioning an exodus of prominent conservatives from the party during his first term.Footnote 43 Nevertheless, the party remained something of a “schizophrenic” hybrid due to the continued prominence within it of the white South, for whom Democratic loyalty was essential to their defense of regional autonomy and white supremacy.Footnote 44 Although Southern MCs gave enthusiastic support to the early New Deal, their support waned in reaction to its increasingly urban and social-democratic orientation and the incorporation of Northern blacks and organized labor into the Democratic coalition. By the end of Roosevelt's long presidency, Southern Democrats in Congress had begun allying with Republicans to limit and retrench important elements of the New Deal.Footnote 45
The 1930s and 1940s were thus decades of tremendous flux in congressional politics. The majority party, the policy agenda, and voting alignments all changed dramatically in a short period of time. As Poole and Rosenthal have shown, NOMINATE provides a powerful means of summarizing and visualizing these momentous changes.Footnote 46 Nevertheless, this period also highlights the limitations of off-the-shelf NOMINATE scores and the potential payoffs of using a model and data chosen specifically for a particular research question. While such customization was once out of the reach of practitioners due to its steep technical and computational requirements, advances in statistical software and computing power have made it much easier to implement.
In this section, we use Southern senators' ideological evolution with respect to the New Deal to illustrate the advantages of a tailored approach over an off-the-shelf one. We focus on three kinds of choices open to empirical researchers: how to model spatial change over time, what roll calls to include in the data, and how many dimensions to estimate. Each choice can have important consequences for the model estimates and their interpretation.
Models of Spatial Change Over Time
Comparing ideal points across different time periods or institutional settings is one of the most difficult and fragile aspects of ideal-point estimation. Doing so requires assumptions that bridge the model across contexts. One approach is to assume that actors who move between contexts, such as state legislators moving to Congress, remain spatially constant.Footnote 47 A second approach is to bridge using positions taken by actors in different contexts on the same choice, such as Supreme Court cases or congressional bills.Footnote 48 The first approach is unsuitable for measuring ideal-point change because, by assumption, it holds constant the very quantities whose evolution we wish to measure. The second approach is possible in theory but usually infeasible in practice due to limited repetition of votes and changes in the policy status quo over time.Footnote 49 Consequently, most studies of Congress have relied on a third approach, which is to impose statistical restrictions on members' spatial movement over time.
DW-NOMINATE, the dynamic form of W-NOMINATE, constrains ideal points to move as a polynomial function of time (e.g., a straight line or a parabola). Since Poole and Rosenthal have found that a simple linear trend provides the best model of change over time, the DW-NOMINATE scores available for public download are based on a linear dynamic model.Footnote 50 Under this assumption, ideal points are cardinally comparable across time—that is, it is possible to say that a given legislator moved x distance between congressional terms. A downside of the linearity assumption is that any spatial movement in a legislator's ideal point is apportioned evenly across their entire congressional career. Thus, while the assumption of a linear trend may be adequate for most purposes, it is not well suited for analyzing rapid or non-monotonic change.Footnote 51
An alternative to the linear-change restriction is to bridge the model over time via Bayesian priors about the distribution of ideal-point shifts between congressional terms.Footnote 52 In this approach, shifts between Congresses are typically assumed to follow a normal distribution centered at zero—that is, legislators may jump to the left or right, but their expected location in a given Congress is their location in the previous Congress.Footnote 53 A legislator's ideal point in term t is estimated as a weighted combination of the ideal point implied by their voting record in term t and their ideal points in adjacent terms, where the weight on term t is determined by the (typically large) variance of the normal distribution.Footnote 54 Even though this model allows ideal points to move very flexibly over time, the ideal points are bridged across Congresses by the assumption that their expected value in t is their value in t − 1.Footnote 55
Policy Domains and Dimensionality
In Section 2, we scaled roll call votes chosen by advocacy organizations to score MCs. To the extent that the positions of these organizations derive from a coherent political ideology, ideal-point estimates based on these votes have an ideological interpretation in a substantive as well as a statistical sense.Footnote 56 An alternative way to imbue ideal-point estimates with greater substantive interpretability is to restrict the roll call data to a particular policy (as opposed to ideological) domain. In the application that follows, for example, we measure senators' support for New Deal liberalism in the 1930s–40s with an IRT model estimated using only roll calls related to economic issues. Because the roll calls have not been preselected for ideological content, we cannot as confidently interpret the economic ideal points as pure measures of liberal–conservatism as we could with interest-group scores in the 1920s. Nor, for that matter, is there any guarantee that a one-dimensional model captures all systematic variation in voting patterns on economic issues, which in this period occasionally involved a second dimension of conflict.Footnote 57 Nevertheless, estimating ideal points in a restricted policy domain does increase their substantive interpretability relative to NOMINATE scores, which are estimated using roll calls on civil rights, foreign policy, and other questions unrelated to the economic issues at the heart of the early New Deal agenda. The exclusion of noneconomic roll calls, especially civil rights, decreases the importance of a second dimension. But even if voting on economic issues was occasionally two dimensional, the domain-specific ideal points can still be interpreted as weighted averages of MCs' support for liberal roll call positions, with weights determined by the correlation of voting patterns across bills.Footnote 58 Below, we illustrate the advantages of such a model, focusing on the ideological evolution of Southern senators in the wake of the New Deal.
Southern Senators' Ideological Evolution
The New Deal altered the character of Southern politics in important ways, even if in the short term it did not fundamentally undermine its exclusionary one-party regime.Footnote 59 The economic emergency forced Southern MCs to reconsider—and in most cases, temporarily abandon—their usual hostility to federal intervention in their region. Through the mid-1930s, only a few Southern senators, most notably Josiah Bailey of North Carolina and Virginia's Harry Byrd and Carter Glass, maintained their commitment to fiscal conservatism. Most others, out of party loyalty and deference to Roosevelt's overwhelming popularity among their constituents, swallowed any personal objections to the New Deal, or else risked being denied renomination for insufficient fealty to Roosevelt.Footnote 60 At the same time, the New Deal clarified the ideological divisions within the one-party system, spawning a “new generation” of New Dealish Southern politicians for whom alignment with Roosevelt gave them the means to challenge the region's conservative leadership.Footnote 61 These developments were particularly salient in the Senate, which saw the entry of such strong New Dealers as Theodore Bilbo (MS) in 1934, Joshua Lee (OK) in 1936, and Lister Hill (AL) and Claude Pepper (FL) in 1937.
Though Roosevelt remained personally popular, Southern support for further liberal reform began to wane by the second half of the 1930s, first among the region's industrial and business elite and eventually among the white voting public at large.Footnote 62 By the 75th Congress (1937–38), usually cited as the origin of the Conservative Coalition between Republicans and Southern Democrats, the typical Southern senator had become slightly less supportive of the New Deal than the party average.Footnote 63 Southern disaffection with New Deal liberalism, especially with regard to labor policy, intensified through the end of Roosevelt's presidency, manifesting itself in convention battles, congressional investigations, and a generally uncooperative mood on Capitol Hill.Footnote 64
Here, we use the tools of spatial modeling to examine the effects of these political dynamics on roll call voting in the Senate during the Roosevelt administration (the 73rd to 79th Congresses).Footnote 65 We gauge senators' support for the New Deal using two Congress-specific measures: first-dimension DW-NOMINATE scores and ideal-point estimates from a one-dimensional dynamic IRT model. Only roll calls involving social welfare or economic regulation—the core of the New Deal issue complex—were used to estimate the IRT model, which was implemented in R using the function MCMCdynamicIRT1d.Footnote 66
For a feel for the differences between the two sets of estimates, consider the career of Mississippi Democrat Theodore Bilbo, who served in the 74th to 79th Congresses (he died in 1947). Bilbo is now remembered as one of the last full-throated racial demagogues in the Senate, to an extent that embarrassed even his fellow Southerners.Footnote 67 Yet Bilbo's embrace of racial demagoguery occurred relatively late in his political career. Until the early 1940s, Bilbo was best described as a “redneck liberal” who expressed a flamboyant form of economic populism.Footnote 68 After two progressive terms as governor of Mississippi, Bilbo challenged incumbent senator Hubert Stephens, whose lukewarm support for the New Deal left him electorally vulnerable. Bilbo defeated Stephens in the Democratic primary and, according to his biographer, entered the Senate as a typically solid Southern supporter of Roosevelt. In contrast to most of his Southern colleagues, however, “as the New Deal moved towards welfare liberalism after 1935, Bilbo's enthusiasm waxed rather than waned.”Footnote 69 Only in the early 1940s, as race began to eclipse economics in political salience, did Bilbo embrace racial demagoguery and turn sharply against the New Deal.Footnote 70
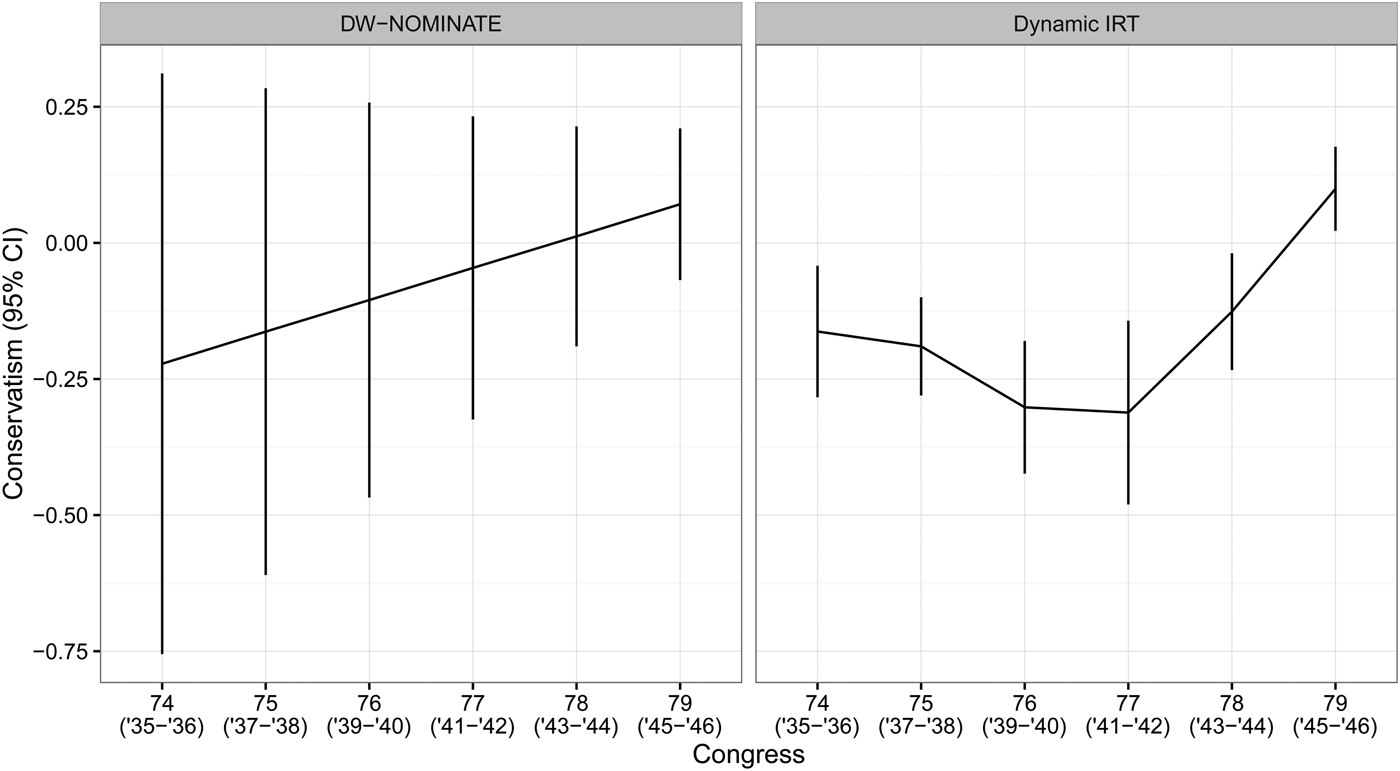
Figure 5 compares DW-NOMINATE and dynamic IRT estimates of Senator Bilbo's conservatism in each Congress in which he served. The two scaling methods tell very different stories. As required by its linear time trend, DW-NOMINATE portrays Bilbo as having become steadily more conservative in each term. According to this measure, Bilbo was the 17th-most-liberal senator in the 74th Congress (1935–36), the 45th-most in the 77th (1941–42), and the 53rd-most in the 79th (1945–46). Clearly, the linear conservative trajectory implied by first-dimension DW-NOMINATE does not match Bilbo's biographer's assessment that the senator's liberalism “waxed rather than waned” in the late 1930s before he turned sharply to the right in the 1940s.
The Ideological Evolution of Senator Theodore Bilbo (D-MS) between the 74th (1935–37) and the 79th (1945–46) Congresses. Both sets of scores have been scaled to range from −1 to + 1, with positive scores more conservative.

By contrast, the dynamic IRT estimates fit much better with qualitative descriptions of Bilbo's career. According to the IRT model, Bilbo's liberalism ranks in the 74th, 77th, and 79th Congresses were 16, 7, and 50, respectively. Thus, while the DW-NOMINATE and IRT models essentially agree on the starting and ending points of Bilbo's career, they convey very different pictures of his ideological trajectory over time. In particular, DW-NOMINATE portrays him as one of the most conservative Democrats in the Senate between 1939 and 1942, whereas the IRT model estimates him to be among the most liberal on economic issues. During these years, even as many erstwhile liberals turned against Roosevelt, Bilbo remained a steadfast ally, supporting such late New Deal initiatives as the Fair Labor Standards Act, the Farm Security Act, public housing, and increased old-age pensions. The fact that these liberal positions are reflected in Bilbo's IRT scores but not his DW-NOMINATE scores highlight the advantages of the former. It is also worth noting another benefit of the dynamic IRT model: the greater precision of its estimates. The DW-NOMINATE scores' standard errors are so large that none of Bilbo's term-specific scores are statistically distinguishable from his scores in other terms.Footnote 71 Indeed, based on DW-NOMINATE scores we cannot reject the null hypothesis that Bilbo had the same ideal point in every Congress. By contrast, as Figure 5 shows, the standard errors for the dynamic IRT estimates are much smaller, enabling us to conclude with statistical confidence that Bilbo became sharply more conservative in his final two terms.Footnote 72
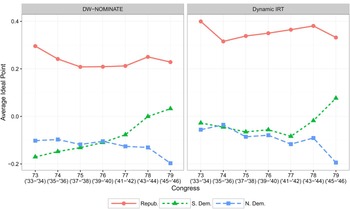
While Bilbo's ideological journey was unusual for its extreme swings, a similar pattern can be discerned for Southern Democrats as a whole. Figure 6 plots the average ideal points of Northern Democrats, Republicans (all of whom were Northern), and Southern Democrats in the Senate, as estimated by DW-NOMINATE and dynamic IRT. The trends for Republicans and Northern Democrats are quite similar across the two measures, but for Southern Democrats, the measures diverge, as they did with Senator Bilbo. Based on DW-NOMINATE, Southern Democrats began the New Deal period clearly to the left of their Northern co-partisans, and their subsequent ideological trajectory is roughly linear. That is, Southern Democrats gradually drifted to the right, as their Northern counterparts remained stable and eventually shifted left during the war. According to the IRT model, however, Southern Democrats did not trend towards the right in the 1933–42 period, and their scores tracked Northern Democrats quite closely until the 78th Congress, when Southerners turned sharply to the right.Footnote 73 Only in the mid-1940s did Southern Democrats in the Senate clearly diverge from their non-Southern co-partisans on the economic issues at the heart of the New Deal.
The Ideological Evolution of Northern Democrats, Southern Democrats, and Republicans in the Senate between the 73rd (1933–35) and 79th (1945–46) Congresses.

The point of the foregoing analysis is not that the IRT estimates are correct and the DW-NOMINATE scores are not. Rather, it is that the estimates generated by an ideal-point method can depend significantly on the assumptions of the model. No method is assumption-free, of course. But the appropriateness of different assumptions varies according to the structure and goals of the analysis. For most purposes and for most of congressional history, DW-NOMINATE's linear-change assumption seems to work well. In this era of ideological flux, however, it provides a poor fit to the data and to the historical record, whereas a dynamic IRT model is more plausible. Moreover, estimating a more flexible model changes our impressions of the period in subtle but significant ways. According to the IRT estimates, Southern senators' shift to the right relative to their non-Southern counterparts was not a gradual process originating in the early 1930s, as DW-NOMINATE implies, but rather a sharp shift that did not take off until the 1940s. The timing of this shift suggests that perhaps the Second World War, and not earlier developments in the New Deal, was the crucial break point in Southern Democrats' ideological evolution.
IMPLICATIONS AND ADVICE
In this final section, we draw out some larger lessons from the case studies we have examined. At the outset, we wish to reemphasize our appreciation for the NOMINATE research program and its contributions to the study of congressional history and development. Our goal is not to criticize NOMINATE but to encourage historically oriented congressional scholars to think more deeply about the interpretation of NOMINATE scores and to consider alternative approaches that may be better suited to their research goals.
NOMINATE and other scaling methods are tools for summarizing legislators' voting behavior in parsimonious form. While this summarization alone is useful, it takes on additional meaning to the extent that the statistical assumptions of the scaling model faithfully represent the decision-making process of legislators. This is not a one-size-fits-all question. Assumptions that are reasonable in one setting may not be in others; similarly, approximations that are acceptable for one research goal may not be for another. The important issue is that applied researchers understand the assumptions of their chosen method and interpret its estimates appropriately.
NOMINATE scores have substantial advantages. The first is ease of use: Researchers can download them easily (along with related information) from www.voteview.com. The second is comprehensiveness: They cover all legislators and roll calls throughout congressional history. Third, NOMINATE has been subject to extensive scrutiny, validation, and explication.Footnote 74 Finally, NOMINATE scores come in several varieties that are suited for different purposes.
W-NOMINATE scores, for example, are estimated separately by Congress and thus are not cardinally comparable across time. DW-NOMINATE achieves such temporal comparability, but at the cost of restricting ideal points to move linearly across time.Footnote 75 Common Space NOMINATE scores are comparable across institutions (e.g., House and Senate), but they constrain ideal points to be constant over time. A hybrid of these approaches is Nokken-Poole NOMINATE, which involves first estimating roll call locations with a constant ideal-point model and then estimating Congress-specific ideal points conditional on the roll call estimates.Footnote 76
As versatile as NOMINATE scores are, it often is better to use ideal-point estimates tailored to particular research goals. Section 3's case study of the Southern Democrats during the New Deal, for example, highlights the difficulty of using off-the-shelf DW-NOMINATE scores to examine rapid, nonlinear spatial change. As an alternative, it uses scores from a one-dimensional dynamic IRT model estimated using roll call data restricted to the New Deal issue complex. The IRT model hews more closely to the substantive outcome of interest (support for New Deal liberalism) and more accurately detects Southern senators' sharp rightward turn in the early 1940s.
How should congressional scholars, particularly those with a historical bent, choose an approach to measuring spatial change over time? At the risk of overgeneralization, we offer the following advice. First, for many if not most purposes, Congress-specific measures such as W-NOMINATE—which allow comparisons of legislators' positions relative to one another—should work fine. Only for cardinal comparisons across time are dynamic measures such as DW-NOMINATE required.Footnote 77 It should be emphasized, however, that even dynamic measures cannot detect spatial shifts common to all legislators.Footnote 78
DW-NOMINATE should accurately portray spatial change, especially of groups of legislators, in periods when the dimensional structure of voting alignments is stable and ideological change is driven primarily by member replacement. However, because DW-NOMINATE scores are affected by past and future votes, they are not well suited for use as control variables in a causal inference analysis unless the causal variable of interest does not affect legislators' future votes.Footnote 79 Finally, although it is possible to derive estimates of additional quantities, such as the location of the chamber median, from DW-NOMINATE scores, the uncertainty (i.e., the standard error) of these estimates is not derivable from publicly available data.Footnote 80
An alternative to relying on publicly available data is to estimate a dynamic model tailored to a particular application. One option, though hardly the only one, is the dynamic IRT model we used in Section 3, which lacks the rigidity and other drawbacks of DW-NOMINATE.Footnote 81 Nevertheless, the dynamic IRT model is not without its costs. Foremost among these is computation time.Footnote 82 Accurate estimation of legislators' ideal points and their uncertainty requires many thousands of Monte Carlo simulations, which can require several weeks or more to complete.Footnote 83 For contemporary scholars used to statistical analyses taking seconds rather than weeks, this may feel prohibitively time-consuming, though it is probably a fraction of the total time they will spend on the project.
The case study of progressivism in the 1920s raises a different methodological and conceptual question: How should scholars identify and assess the main ideological cleavage in politics at a particular moment in time? The simplest answer would be to say that the relevant ideological cleavage is whatever emerges from a one- or two-dimensional estimation of ideal points based on all roll calls in Congress. The advantage of this assumption is its simplicity: It allows one to assess behavior across time without relying on potentially subjective coding decisions or expert judgments. Many consumers of NOMINATE scores implicitly (or at times explicitly) make this move when they treat the scale as providing a consistent measure of ideological polarization, party homogeneity, and so on.
One potential criticism of this approach is that the first dimension identified by NOMINATE may be as much a partisan dimension as it is an identifiable ideological dimension.Footnote 84 From this perspective, it is striking that Poole and Rosenthal refer to the first NOMINATE dimension as both a partisan dimension and a liberal–conservative dimension. One might resolve the apparent tension between a partisan and ideological interpretation of the first dimension by arguing that the relevant ideological cleavage at a given point time is simply what the two major parties choose to focus on, perhaps inspired by the main organized groups constituting each party's coalition.Footnote 85 These items will tend to dominate the congressional agenda and thus dictate the contours of the first dimension. High polarization on the first dimension means that the two parties' members vote in opposition to one another on the issues subject to many roll call votes in a given Congress.
The results presented about the 1920s suggest, however, that the behavioral voting dimension uncovered by NOMINATE can correspond quite imperfectly to other, seemingly plausible conceptualizations of ideological divisions. In particular, the disjuncture between NOMINATE and CPPA scores in assessing Democrats' positioning and in measuring party overlap calls into question the NOMINATE scores' validity as indicators of ideology in the 1920s. When two sets of scores diverge in this way, what are the grounds for preferring one over the other?
We would argue against the idea that there is a global answer to this question. The purpose of one's study is crucial. If one is interested in party-based cleavages, NOMINATE's limitations are of much less concern. But if one is seeking to understand the “liberalism,” “progressivism,” or “conservatism” of particular members or factions, the fit between NOMINATE and alternative metrics at a given point in time is central.
What would make an alternative metric a valid indicator of ideological positioning? Hans Noel has highlighted the role of political thinkers—such as pundits and policy intellectuals—in crafting ideological terms of debate and alignments.Footnote 86 From this standpoint, magazines such as the New Republic and The Nation provide one way to identify a liberal or progressive program. Indeed, the New Republic was founded in 1914, at least in part to try to persuade politicians, activists, and voters that the true conflict in politics was between conservatives and progressives rather than between the two parties' espoused positions at the time.
But simply because the dominant intellectuals of the day are talking about one set of problems does not mean those problems are the “real” conflict and that what NOMINATE picks up is less important. After all, party coalitions were defined largely by region and section for most of American history, while the predominant intellectual voices have tended to be concentrated in a handful of cities, such as New York, Boston, and Chicago, far from the lived experience of most Americans (and American politicians).
Our admittedly tentative answer to these challenges is that validating an alternative measure—such as the CPPA scores—involves showing that practicing politicians themselves recognized the underlying dimension that the scale purports to assess. This recognition need not be universal or comprehensive, but to the extent that political actors themselves see the relevant dimension of conflict similarly to the measure, we can be confident that the scores capture something meaningful rather than being a reification of a dimension that was not operative for individual politicians. Ideology is, in part, a heuristic that people use as they evaluate new proposals and issues. For it to operate as a heuristic, however, the relevant actors have to “see” the relevant dimension.
Our initial examination of the 1920s suggests that many political actors did view the cleavage highlighted by the CPPA as corresponding to the key political battle of the era. For example, news coverage routinely labeled politicians as progressive or conservative, based, evidently, on their position on the broad set of issues highlighted by the CPPA. There is also some evidence that politicians themselves—even outside of the Progressive group—saw the progressive–conservative cleavage as central. Thus, for example, a handful of conservative Democrats formed the Thomas Jefferson League following the 1924 election in order to “educate the American people in the ways of the Constitution.”Footnote 87 These Democrats—including William Bruce of Maryland, Thomas Bayard of Delaware, and Edwin Broussard of Louisiana—were among the most conservative Democrats on the CPPA scale and explicitly sought to distance their party from the progressive Republican “radicals.” A systematic analysis of press coverage and members' own statements, however, is needed before firm statements can be made about how well the progressive–conservative cleavage, as articulated by the CPPA and reflected in its scale, corresponded to members' self-perception of the political conflicts of the 1920s.
At a minimum, however, our results indicate that the first NOMINATE dimension in the 1920s only imperfectly reflected the redistributive and anti-corporate agendas that were a core concern of the CPPA, and that resonate with later understandings of liberalism as articulated in the 1930s and beyond. Where NOMINATE tells us that such prominent Senate Democrats as Oscar Underwood and Carter Glass—as well as John Nance Garner in the House—were mainstream “liberal” Democrats in the 1920s, the CPPA scores (and the later behavior of Glass and Garner as the New Deal unfolded) suggests that these were loyal Democratic partisans in the 1920s, but were by no means advocates of heavy redistribution or attacks on corporate control of utilities.
For students of congressional history, our case studies of progressivism in the 1920s and of Southern Democrats in the New Deal era illustrate the promise and pitfalls of alternative approaches to scaling congressional roll calls. There is little doubt that NOMINATE has made possible a far richer understanding of patterns in congressional behavior and has allowed a much closer conversation between historically oriented scholars and mainstream quantitative analysts. At the same time, efforts to use scaled ideal points across a long time span face difficult challenges. First, the underlying dimensions being estimated cannot be assumed to have a common meaning across time, at least insofar as that meaning is given an ideological interpretation. Second, the appropriate identifying assumptions for estimating ideal points will depend, in part, on both the historical context and the analysts' purposes. While no approach is without its limitations, in many cases scholars will be able to answer their particular research questions with greater precision and plausibility by using data and models tailored to specific applications.