Implications
An implication of this work is a better understanding of the impact of diet on food crop needs at a global level. This impact is critically dependent on the feed from food plants/animal food product ratio, which is highly variable in the world and poorly documented. Taking into account its level and evolution leads to a more accurate foresight on competition between plant food for human consumption and animal feed from food plants.
Introduction
Several observers surmise that livestock consumption will continue to increase steeply in the coming decades, and many are concerned about its potential impact on the environment and global food security. Whereas the potential impact of meat production on global natural resources is increasingly being debated (e.g. de Haan et al., Reference de Haan, Steinfeld and Blackburn1999; Delgado et al., Reference Delgado, Rosegrant, Steinfled, Ehui and Courbois1999; Steinfeld et al., Reference Steinfeld, Gerber, Wassenaar, Castel, Rosales and de Haan2006), its potential impact on food availability is not so well documented. Some authors support the idea that crop production could be too low to satisfy the demand for meat. Keyzer et al. (Reference Keyzer, Merbis, Pavel and van Wesenbeeck2005) wrote ‘the central challenge for world food markets in the medium-term future is not whether it will be physically possible to feed the growing population, but whether we can feed the animals’. Godfray et al. (Reference Godfray, Beddington, Crute, Haddad, Lawrence, Muir, Pretty, Robinson, Thomas and Toulmin2010) further hint that a diet shift toward a larger share of plant food would help sustain future populations: ‘the efficiency of conversion of plant into animal matter is ∼10%; thus there is a prima facie case that more people could be supported by the same amount of land if they were vegetarian’. Has livestock production really become such a plague? A key unknown for the understanding of the potential competition between crop production used to feed animals and crop production used to feed humans is the amount of feed (for animals) made of grains and other crop products that could be used as food (for humans).Footnote 1 The growing world demand for grains for feed is expected to be the major source of production increase in the coming decades, and will impact on global farm production and prices. But the evolution of this amount of feed based on grains and edible crop products is by no means easy to anticipate, and the objective of this article is to quantify the range of such an evolution.
Delgado et al. (Reference Delgado, Rosegrant, Steinfled, Ehui and Courbois1999) provide a projection of the amount of cereals used as feed in 2020 using technical coefficients from empirical studies at the breeding system level (Seré and Steinfeld, Reference Seré and Steinfeld1996; Bouwman et al., Reference Bouwman, van der Hoek, Eickhout and Soenario2005). They forecast an increase in the growth rate of cereals used as feed (from 0.7%/year from 1980 to 1990 to 1.4%/year from 1993 to 2020). This rate decreases in a more optimistic scenario defined by an improving conversion efficiency ratio (+1%/year) and increases in a more pessimistic scenario defined by a conversion efficiency ratio that increases more slowly (+0.5%/year). According to us, the fact that scenarios are defined by exogenous conversion efficiency ratios is a limitation to the projection of livestock production in 2020. By contrast, Keyzer et al. (Reference Keyzer, Merbis, Pavel and van Wesenbeeck2005) include more explicit technological assumptions in their foresight, based on the relative share of three types of feed: cereal feed, residuals and grazing areas. They find that the relative share of these three types of feed has a considerable impact on cereal feed used in 2030. For the same level of meat demand, the growth rate of cereal feed increases from 1.4%/year in the most favourable technology (residuals increase as fast as cereal feed) to 4.0%/ year in the less favourable technology (residuals and grazing areas growth on trend). The total amount of feed needed is about four times higher in the least favourable technology as in the most favourable one. Although the analysis of future technology through the analysis of the cereal feed/meat ratio is a clear improvement, it is based on theoretical arguments, not on an empirical analysis of past trajectories. In particular, the evolution of the cereal feed/meat ratio in 2030 is postulated and, according to our findings, underestimates the potential improvement of this ratio at the world level. Additionally, these studies do not integrate dairy products, whose inclusion in the analysis is important for simulation of future demands for feed.
Our contribution is an empirical analysis of recent animal feeding trajectories at a global level and some rationale to anticipate their evolution under a series of consumption-based scenarios. To do so, our approach has consisted of analysing the evolution of the AFP/FFP ratio (animal food products/feed from food plant), to infer its evolution. The animal food product is defined as the protein weight of all farm animal products used as food (meats, milk, eggs, fats, etc.) and the feed from food plants is the protein weight of all edible plant products that could be used for human consumption but that are used as feed for animals (cereals, oilseeds, tuber, cakes and brans, etc.). This ratio indicates the quantity of animal products that can be obtained from one unit of feed from edible plants. Higher ratios indicate a more efficient technology in terms of feed consumption. The past evolution of this ratio in several world regions yields important information for constructing foresight scenarios. This ratio is not similar in each area, is not constant and its evolution is neither linear nor even monotonous. As a result, the long-term evolution is not a foregone conclusion. The understanding of these evolutions is critical to the calculation of feed requirements in 2050 and thus to agricultural production as a whole. These evolutions must also be related to the changing proportion of grazing and non-grazing animal products, the increasing protein content of feed and several other aspects of technical change. In this respect, our approach has been to estimate a model of animal production based on the historical relation between aggregate animal products and aggregate feed use, which separates feed from food crops and from non-food plants (grass, dry fodder, residues, etc.). The intuition in support of this approach is that a model accounting for a global scale is more robust when its parameters are estimated from aggregated data than when they are derived from micro-data that are specific to each breeding system and then extrapolated to national and global scales. The main reason for this is that the proportion of each breeding system has a major influence on the global conversion efficiency ratio, and this proportion cannot be extrapolated from micro-data on breeding systems. The model is estimated with information from all countries and all years from 1961 to 2003.
We compute three diet-based scenarios for 2050 to measure the influence of diets on feed needs in 2050 compared with today's needs with the same three diets. These three diets are as follows: (i) the present existing diet (in 2003) for each region; (ii) a diet scheme with no animal products; and (iii) the present average diet of developed countries applied to the whole world. These three diets are simulated with the present population and with the 2050 expected population. The simulations presented here are not meant to be plausible scenarios that could be used for prediction, but heuristic scenarios that should be used for foresight purposes. Their main interest is to provide a quantitative order of magnitude of the impact of extreme changes in diet on the feed from food plants. The diet scheme with no animal products, in particular, should be considered as a theoretical baseline with no feed, and not as a plausible or a desirable situation. Furthermore, we show simulation here for which only two variables change in 2050 in comparison with today's situation: populations and diets. No additional technical progress is assumed after 2003, no change in grassland areas is assumed and no change in the grazing/non-grazing animal products is assumed in those simulations. The scenarios are thus mostly conservative and provide the upper bound of feed from food plants for each diet hypothesis.
Material and methods
Aggregating data for feed, food, animal products and grassland
The data of 150 countries accounting for >98% of the global surface area have been extracted from Agribiom, a tool for biomass balance accounting that uses data from the FAOSTAT supply–utilization accounts ‘Commodity Balance’ (FAO (Food and Agriculture Organization of the United Nations), 2006b) over the 1961 to 2003 period, and transforms these data in terms of their nutritional value. From this, energy values (kcal) and protein values (tons of proteins) of edible crops used as food, edible crops used as feed and edible animal products have been calculated.Footnote 2 For each country, each year and each type of biomass (>100 types of food products from plants and >10 types of food products from animals), the utilization–supply balance has been checked and inconsistencies in primary data have been detected and corrected. The detailed conversion of data from FAOSTAT into Agribiom data has been presented elsewhere (Paillard et al., Reference Paillard, Dorin and Treyer2010).
For each country and each year, we calculate the aggregate quantity of FFP, the aggregate quantity of AFP for grazing and non-grazing animal products and the total area of grassland (GRASS). FFP is the sum of all types of feed from edible crop products expressed in tons of proteins (tons of proteins of cereals used as feed, plus tons of proteins of roots used as feed, plus tons of proteins of oilseeds used as feed, plus tons of proteins of oilcakes, etc.). FFP does not include fodder crops that are not edible for human beings such as alfalfa, clover or silage. AFP includes all types of edible animal food products from farm production, and is expressed in tons of proteins. At some point in the analysis, we distinguish the animal food product from grazing animals (AFP g ; tons of proteins of cow's milk and milk-derived products, plus tons of proteins of beef, plus tons of proteins of sheep and goat milk, etc.) and animal food products from non-grazing animals (AFP ng ; tons of proteins of eggs plus tons of proteins of poultry meat, etc.). Grassland includes all types of permanent pasture (>5 years) used for grazing, including bushes, savannahs, steppes, etc. and is expressed in hectares. This variable is quite heterogeneous.
These country data are used to estimate seven regional production functions of animal products: Asia excluding China (Asia-Ch), China, Former Soviet Union (FSU), Latin America (LAM), Middle East and North Africa (MENA), Organisation for Economic Co-operation and Development (OECD)-1990 (the 1990 definition of OECD) and Sub-Saharan Africa (SSA).
An aggregate animal production model
Following Keyzer et al. (Reference Keyzer, Merbis, Pavel and van Wesenbeeck2005), who use a linear relationship between meat, cereals used as feed and residuals (grass, crop residues, etc.), we establish a linear relationship between AFP, FFP and GRASS and a constant term accounting for non-grass-roughage (not measured). The total AFP produced in a country is expressed in tons of animal protein, FFP is expressed in tons of plant protein, GRASS is expressed in ha (coefficient b is expressed in tons of animal protein per 1000 ha) and c is expressed in tons of animal proteins (those produced through roughage). Coefficient a has no unit and expresses the marginal productivity of FFP:


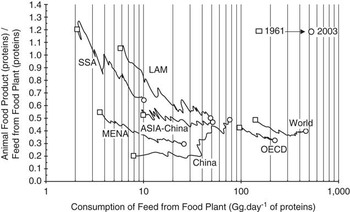
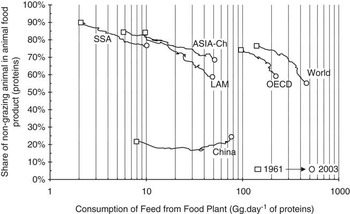
Equation (1) shows the production function of animal products and, equivalently, equation (2) expresses the average productivity of FFP, that is, the amount of protein in animal food products that is produced with 1 t of proteins of feed from food plants. The evolution of this ratio over time is not self-evident. If all coefficients are constant, the AFP/FFP ratio is decreasing; in other words, the overall efficiency of feed would be decreasing, and increasingly more feed from food plant is needed as animal production increases. This is consistent with several analyses quoted above.Footnote 3 But in the long run, these coefficients may not be constant. In particular, it seems that the marginal productivity of feed, a, may be increasing in several countries due to technical improvement of feed and especially because of a changing composition of AFP (see empirical support for this argument below). It is therefore conceivable that the AFP/FFP ratio is increasing. This occurs in particular in China, meaning that it takes increasingly less plant protein to produce one animal protein (Figure 1). The reason for this is straightforward: China is the only region (not the only country) where grazing animal products (milk in particular) are increasing faster than non-grazing animal products, and this improves the overall AFP/FFP ratio (see Figure 2). Indeed, because of roughage and grass, grazing animals appear to be more efficient users of feed from food plants than non-grazing animals. In all other areas, the share of grazing animal products decreases, and the average productivity of FFP decreases. But animal production in China is so huge and growing so fast that it influences the world total AFP/FFP enough for this world ratio to have increased globally in recent years (Figure 2). Note that the rate of non-grazing animal products in China remains much higher than elsewhere.Footnote 4
Animal food product (in tons of proteins) per unit of Feed from Food Plant (in tons of proteins): AFP/FFP, from 1961 to 2003. OECD = Organisation for Economic Co-operation and Development; MENA = Middle East and North Africa; LAM = Latin America; SSA = Sub-Saharan Africa.

Share of animal food product from grazing animals (AFP g , in tons of proteins) in total animal food product (AFP in tons of proteins) and use of feed from food plant (logarithmic scale), from 1961 to 2003. OECD = Organisation for Economic Co-operation and Development; LAM = Latin America; ASIA-Ch = Asia excluding China; SSA = Sub-Saharan Africa.

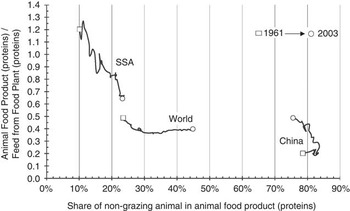
Figure 3 confirms that the average productivity of feed from food plants (AFP/FFP) decreases when the share of non-grazing animals increases. Only two regions in the world are presented here, for readability, but this decreasing slope is observed in all regions. Once again, this does not mean that non-grazing animals use more resources than grazing animals, but simply that they use more resources from food plants than do grazing animals. The high productivity of feed in terms of dairy products is also important in this result.
Animal food product (in tons of proteins) per unit of feed from food plant (in tons of proteins) and share of animal food product from non-grazing animals (AFP ng , in tons of proteins) in total animal food product (AFP in tons of proteins), from 1961 to 2003. SSA = Sub-Saharan Africa.

We therefore carry out a separate estimation for animal food products from grazing animals – AFP g and animal food products from non-grazing animals – AFP ng .
Estimation method of the model
Since FAOSTAT data do not distinguish the share of feed devoted to grazing and non-grazing animals, we use a simultaneous estimation of both production functions, following Just et al. (Reference Just, Zilberman and Hochman1983):


Homogeneity constraints are imposed in the estimation:


The subscripts i and t stand for country and year, respectively. The coefficient α 1 stands for the marginal productivity of feed from food plants in terms of grazing animal products, that is, the amount of grazing animal products that is produced with an extra quantity of feed from food plants used for the production of AFP g , when the area of grassland and the quantity of non-grazing animal products are maintained constant. In the same way, α2 is the grassland marginal productivity in terms of grazing animal products (in tons of protein per 1000 ha), that is, the quantity of protein of AFP g obtained using an additional hectare of grassland of the average quality of grassland in the country, and β is the substitution coefficient, expressing the quantity of grazing animal products that is produced if a country reduces its non-grazing animal production by one unit, maintaining its feed and grassland area constant. The constant term α 0 is the quantity of AFP g that can be produced with no feed from food plants. It can be interpreted as the share of grazing animals fed with non-food plants from roughage, fodder crops and residues (alfalfa, clover, silage, waste, etc.). Equation (3) aims to forecast the quantity of grazing animal products when we know the quantity of feed from food plants used, the grassland area and the level of non-grazing animal products. Equation (4) interprets these in the same way for non-grazing animals. The existence of grassland area as an explanatory variable of non-grazing animal production is necessary for theoretical reasons. The intuition is that for a given quantity of FFP available and for a given quantity of grazing animals to produce, the quantity of FFP available for non-grazing animals increases when the grassland increases. Theoretically, if they were estimated using perfect information, equations (3) and (4) would be redundant and equation (3) would be enough to predict both types of production, given the share of AFP g and AFP ng . But empirically, because of inaccurate or incomplete information, separate estimations of equations (3) and (4) yield some differences. We therefore estimate both equations simultaneously, and use homogeneity constraints (5) to (8) to ensure consistency between the two equations.
For each region, we have a system of two-output two-input cross-country production functions reflecting the average technology used for livestock production (in line with Hayami and Ruttan, Reference Hayami and Ruttan1970; Mundlak and Hellinghausen, Reference Mundlak and Hellinghausen1982). The final data set used consists of panel data of 150 countries and 43 years. Parameters are estimated using a two-stage least squares estimation to correct for the endogeneity of the variable FFP and the substitute production (AFP ng in (3) and AFP g in (4)). A total of five instrument variables are used for the first stage estimation: GRASS, TRAC (number of tractors in use in the country) extracted from the machinery database from FAOSTAT to account for the capital used in farm production, POP (total population, expressed in number of people) extracted from the FAO population database, AF (animal food), which is the daily availability of animal food per capita, expressed in kilocalories, and a trend term. These variables are chosen essentially because they are theoretically reasonably exogenous to the instrumented variables. The structural form of this first stage is as follows:


A simplified estimation has been carried out for China, where cross-country estimation was not possible, and the complete estimation of (3) to (8) did not yield robust coefficients. Grassland and the substitute term have been excluded from the estimation. Finally, a non-negativity constraint for the grassland term has been introduced for MENA.
Estimates analysis
Estimates of the production models (3) and (4) are available online at http://www.journals.cambridge.org/anm (Supplementary Tables S1 and S2, respectively).Footnote 5 The equations show highly significant parameters (apart from the constant term, which is the roughage contribution to animal production). The marginal productivity of FFP is higher for grazing animal products than for non-grazing animal products, which confirms the graphical analysis (Figure 3). Given the existing level of grassland and roughage, and given the existing share of milk in grazing animal products, one additional protein of feed from food crops fed to grazing animal is more productive (from 0.36 in OECD to 0.66 in ASIA-Ch) than an additional protein fed to non-grazing animals (from 0.16 in MENA to 0.28 in ASIA-Ch). Coefficients for China are obtained with a different set of variables and should not be compared with other regions. The marginal productivity of grassland shows a wider variation between regions (ranging from 135 g of protein per ha in ASIA-Ch to 2715 in LAM). The positive marginal productivity of grassland in the non-grazing equation represents the additional quantity of non-grazing AFP produced if we maintain the feed from food crops and the grazing animal production constant and increase grassland by 1 ha. If we increase grassland and maintain the production of grazing animals constant, it means that more FFP is provided to non-grazing animals. The fact that the substitution term is greater for grazing animals in absolute value is consistent with the analysis of the marginal productivity. In OECD, if the production of non-grazing animal decreases by 1 protein, the production of grazing animal increases by 1.62 proteins, everything else being equal.
Regarding the 2050 simulations, each scenario fixes the expected population in each region (following UN intermediate scenarios), the animal food products in the human diet for each region (expressed in calories per day per person and then converted into proteins using the 2003 protein rate for each type of animal product), trade rules (zero import and zero export of animal products in order to simulate the case where each region produces its own animal food product) and grassland areas in each region (unchanged in comparison with 2003). The reason why grassland and trade are kept as simple as possible is that we do not want to predict the future but rather to understand specifically the impact of diets on feed from food crops. We suppose no form of technical progress between now and 2050, other than the increasing share of feed from food plant in total feed, due to the constant amount of roughage and grass. The share of grazing animals depends on the scenario (unchanged for 2003 and fixed at 60% of total animal products for the diet of developed countries).
The amount of feed from food plants is the only unknown variable for each region, given by equation (12), which is derived from equation (3), when estimated using constraints (5) to (8). The ‘tilde’ marks correspond to these estimates:

The subscript J stands for region J and nj is the number of countries in region J, required to shift from the cross country to the regional production function. FFPJ is given in tons of proteins and then converted into calories using the nutritional value of each type of feedstuff.
Results
Three contrasted diets and feed requirements in 2003
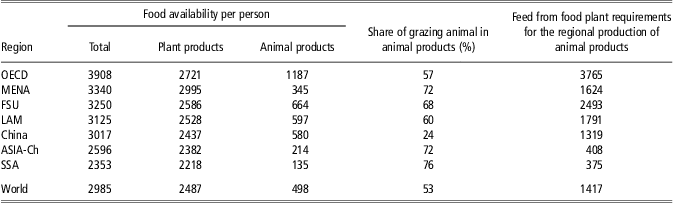
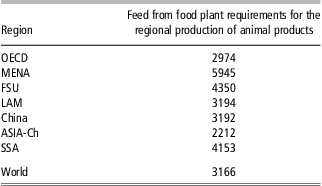
The first diet we consider is the existing diet in each region in 2003. Table 1 presents the figures summarizing these diets and their counterparts in terms of feed requirements. In 2003, the average daily use of food plants for feed and food per capita is around 3900 kcal/day, out of which 2500 are used for food and 1400 are used for feed (which produces in average 500 kcal of animal food products). An additional 600 kcal are used for other purposes (seeds, waste and non-food uses), which are not analysed here. The world average 3900 kcal of food plant used per day per capita ranges from 2590 in SSA (of which 375 are for feed) to 6490 in OECD (of which 3765 are for feed).
Feed requirements to meet present regional diets (2003)

OECD = Organisation for Economic Co-operation and Development; MENA = Middle East and North Africa; FSU = Former Soviet Union; LAM = Latin America; ASIA-Ch = Asia excluding China; SSA = Sub-Saharan Africa.
Notes: Values in kcal/day per person. Feed from food plant requirements are given by equation (12) and then divided by the regional human populations in 2003. Feed can be locally produced and/or imported.
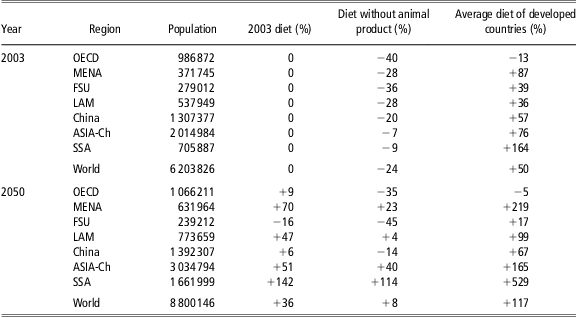
The second diet we consider is the developed countries’ average diet extended to the whole world. Table 2 presents the feed requirements in each region to reach this diet. This diet is comprised of 2700 kcal of food plants and 1000 kcal of animal products. With the 2003 population, the necessary amount of total food plants to reach this diet would increase by 160% in Africa, 76% in Asia (excluding China) and 50% on a global scale (Table 3).
Regional requirements in feed from food plants to meet the present diet of developed countries (2003)

OECD = Organisation for Economic Co-operation and Development; MENA = Middle East and North Africa; FSU = Former Soviet Union; LAM = Latin America; ASIA-Ch = Asia excluding China; SSA = Sub-Saharan Africa.
Notes: Values in kcal/day per person. Feed requirements are estimated using equation (12) and then divided by the regional human populations in 2003. The developed countries’ diet in 2003 is made of 2700 kcal of plant products and 1000 kcal of animal products available per person per day, 60% of the latter consisting of products from grazing animals.
Percentage changes in total food plant needs compared with the 2003 situation

OECD = Organisation for Economic Co-operation and Development; MENA = Middle East and North Africa; FSU = Former Soviet Union; LAM = Latin America; ASIA-Ch = Asia excluding China; SSA = Sub-Saharan Africa.
The third diet we consider is a virtual situation where no region would use any feed from food plants and where the total energetic value of each regional diet would be maintained constant (as it is in 2003 in each region). In other words, each calorie of animal products is replaced by one calorie of food plants. This situation is provided only as a quantitative benchmark. In this benchmark, the regional average food consumption ranges from 2350 kcal in SSA to 3900 kcal in OECD. In comparison with today's situation, this benchmark without animal products would require 920 fewer kcal per day per capita of food plants in the world average (920 being the difference between the total need in 2003, 2487 kcal of food + 1417 kcal of feed per person per day and the total need in the benchmark, 2985 kcal of food per person per day). This average decrease ranges from 240 kcal/day in SSA to 2578 kcal/day in OECD, where human consumption of animal products reaches 1187 kcal/day and food plant contribution to animal feed reaches 3765 kcal/day per capita (Table 1). This means that 40% of edible plants that are required in OECD would not be required in this benchmark, where calories of animal products are replaced by calories from food plants. At the world level, 24% of edible plants that are required today would not be required in this scenario (Table 3).
Simulation of total food plant requirement in 2050
If the average 2003 diets are projected to the 2050 expected population, that is, if each region of the world follows the same diet as in 2003 until 2050, we can observe the effect of the population increase on consumption, based on the United Nations medium assumption. The requirement in total food plant increases by 36% (Table 3). The largest increase occurs in SSA, +142%, which is more than the expected population growth, because animals will be fed with relatively more crop products and less roughage and grass than at present.
If the average diet of developed countries is extended to all regions in 2050, there would be a larger increase in feed from food plants at the world level, especially in regions where the present animal product consumption is low (remember that each region produces 100% of its needs in animal products in all scenarios). The necessary amount of food plants would increase by 529% in Africa, 165% in Asia (excluding China) and 117% on a global scale.
Finally, if we simulate the benchmark diet without animal products for the whole world in 2050, the total food plant need at the world level would be similar (8% higher) to the actual total food plant used in 2003. The diet shift almost compensates for the population increase on average. The increase is significant in Africa (+114%), where the expected population increase is the largest and the present use of food plant as feed is already low (Table 3).
Discussion
The plausibility of scenarios
Common prospects are meant to describe a most likely future, like in FAO (2006a). Some foresights are intended to describe a desirable future, such as Agrimonde 1 scenario in Paillard et al. (Reference Paillard, Dorin and Treyer2010), other exercises provide both optimistic and pessimistic projections of the future, such as the International Food Policy Research Institute (IFPRI, 2010) or Keyzer et al. (Reference Keyzer, Merbis, Pavel and van Wesenbeeck2005). Our scenarios are defined as two extremes of feasible evolutions, that are not meant to be plausible. Among the infinite possible diets and the infinite possible ways to produce necessary animal products to allow for these diets, we choose three simple and stereotypical diets. This foresight exercise is not a prediction. In particular, our scenario with no feed from food plants is neither plausible nor recommended, for nutritional, environmental and economic reasons. Farmers have been feeding animals with cereals and oilseeds for a long time, and they have good reasons to do so. This scenario simply provides a quantitative benchmark against which present and future situations can be compared.
Does feed from food plant demand really matter?
The surge in the demand for animal products has led to growing areas of croplands and pastures devoted to feeding animals with cereals, oilseeds, fodder crops and other biomass. Continuation of these trends could contribute to: (i) a greater depletion of global carbon and biodiversity pools through the expansion of agricultural land and deforestation; (ii) increased use of freshwater, fertilizers, pesticides, antibiotics and fossil fuels that are used to boost crop yields and breed animals; (iii) greater livestock emissions of methane and nitrous oxide, two powerful greenhouse gases; and (iv) increase in grain prices. Of course, these environmental and social impacts differ substantially depending on the composition of feed. Feed from crops uses fewer land resources than grass or fodder crops per unit of animal product, but uses more non-renewable resources (fertilizers) in particular. An environmental comparison of the impacts from grassland through greater deforestation and the impacts from crops through greater use of fossil resources are not beyond the scope of this article. However, a better understanding of the dynamics of food plant content and the roughage content of feed is crucial. The implication of our results on food security is more straightforward. If the production systems around the world can produce more with proportionally less feed from food plants (and as much grassland), it would mitigate potential increases in grain prices.
The importance of the product/feed ratio in the scenarios
The AFP/FFP ratio is very similar to the inverse of the cereals/meat ratio of Keyzer et al. (Reference Keyzer, Merbis, Pavel and van Wesenbeeck2005), except that FFP includes a broader range of products (cereals but also oilcakes, brans, roots, vegetables, etc.) and AFP includes a broader range of products (such as dairy products and eggs). Keyzer et al. (Reference Keyzer, Merbis, Pavel and van Wesenbeeck2005) consider that the cereal/meat ratio is likely to increase with time since the share of residuals in total feed is likely to decrease. They are aware that technical progress could decrease this feed/meat ratio, but it is highly unlikely that this could compensate for the relative decrease in residual contribution to meat production. For instance, in their ‘pessimistic’ scenario (actually corresponding to a high meat demand), the annual growth rate of feed demand (from cereals) between 2015 and 2030 is 2% in the most favourable technology assumption (low increase in the feed/meat ratio) and 4.7% in the least favourable technology assumption (high increase in the feed/meat ratio). In 15 years, the global increase in feed demand would vary from 35% to 99%. Most of their simulations forecast higher increases than expected in several studies (Delgado et al., Reference Delgado, Rosegrant, Steinfled, Ehui and Courbois1999; FAO, 2003). Drawing on their intuition, one could expect a decreasing AFP/FFP ratio. Looking at past values of this ratio, we find that their intuition is supported by recent data for all regions except China. At the global level, however, this ratio is currently increasing because of the impact of China, but also because of the re-allocation of feed use towards regions with relatively higher – even though decreasing – AFP/FFP ratio, such as Africa and Asia. Because our simulations do not imply that the AFP/FFP ratio will worsen, we project a lower annual growth rate of feed from food plants (between 2003 and 2050): from 0.5% in the scenario with the 2003 diet up to 2.6% in the scenario with developed countries’ diet throughout the world.
The performance of grazing animals
It appears that the aggregate ‘animal food products from grazing animals’ exhibits a higher marginal productivity of feed from food plants than the aggregate ‘animal food products from non-grazing animals’ (see Supplementary Tables S1 and S2 at http://www.journals.cambridge.org/anm, and Figures 2 and 3). There are two main reasons for this: first, a large part of the AFPg is made of protein from milk, for which feed requirements are lower than the protein from pig meat or poultry meat, and second, the largest part of feed used for grazing animals consists of grass, hay, silage, crop residuals, etc., and not of cereals or oilseed. For this reason, the marginal effect of feeding one extra protein of FFP to a grazing animal is superior in terms of protein output to the marginal effect of an extra protein fed to a non-grazing animal (which is typically already fed with ‘enough’ proteins from food plants). This finding is not contradictory to the fact that grazing animals have a lower energy conversion efficiency for meat production than non-grazing animals (meat/total feed).
The aggregate analysis of technologies
The estimated relationship between feed and animal products is not built upon ex ante nutritional knowledge on animal needs for each type of animal, but on statistical evidence at the global level. Thus, we do not need to know or assume the nutritional value of grass and residuals, which are potential sources of errors when aggregated into global forecast models. We do not need to know or assume the allocation of each type of feed to each type of breeding system or to each type of animal product to be able to forecast a reliable relationship between feed and grassland on the one hand and animal products on the other. We do not need to know the share of each breeding system now or in 2050, because it is implicitly included in our technical coefficient at aggregate level and this is a real advantage. The evolution of the AFP/FFP ratio partly arises from technological changes within breeding systems, which micro-level analyses can deal with, but they also partly arise from changes in the proportions of breeding systems, or changes in the proportion of production from each region, which micro-level analyses have to assume. As we have shown, these changes in the proportions between systems and regions should not be minimized. If the share of the most efficient system increases, the overall feed/product ratio can improve globally even if this ratio worsens in all breeding systems.
The corollary is that our highly aggregated approach leaves no room for the description of technical evolutions within breeding systems. The marginal productivity of feed from food plants stems from a large number of technical aspects, including the number of births per animal and per year, the age of slaughtering, carcass weight, composition of feed, etc. (Seré and Steinfeld, Reference Seré and Steinfeld1996; Bouwman et al., Reference Bouwman, van der Hoek, Eickhout and Soenario2005). The individual effect of all these aspects in the overall productivity of feed from food plants cannot be isolated, and it is not possible for us to compare our parameters with local or system-specific data, which would improve the farm-level validation of our model.
Technical improvements to be made to the model
The seven regions of the world that we consider here are homogeneous enough from the economic point of view, although not from the animal production point of view. Our production functions are therefore not as precise as they would have been with a finer partitioning of the world. We assume that the marginal productivities of a hectare of grassland in South Africa and in Mali are the same, which is a strong approximation. The marginal productivities of protein of feed in India and in Vietnam are assumed to be the same, which is also an approximation.
Another major problem is that econometric theory would require that we estimate a production function based on equation (2) instead of equation (1), which is more sensitive to the countries’ size differences. The researches that we have undertaken in this direction have yielded interesting results in terms of statistical analysis, but not in terms of prediction power at the regional level, which is the reason for our final choice.
Conclusion
Theoretical knowledge on the needs of animals for each breeding system is not enough to anticipate the evolution of feed requirements on a global scale, especially since the roles of crop residues, fodder and roughage are uncertain and since the changing proportions of each breeding system are unknown. Instead of making a series of assumptions on the way in which requirements for each breeding system add up, we use a direct method to infer statistical relationships between aggregate animal products, grassland areas and aggregate feed from food plants, to build foresight. We show that the AFP/FFP varies from 0.67 (ton of protein of AFP per ton of protein of FFP) (in SSA) to 0.30 (in MENA) in 2003 and that the world average is around 0.40. In most countries, this ratio has been decreasing since the 1960s, but in China and a few other developing countries, it has been increasing. Overall, we find that AFP/FFP is increasing slowly, which indicates that in the world average, the benefits derived from technical progress, changes in animal product proportions and the increasing share of world proportion from Asia and Africa outweigh the negative effects of the decrease in the roughage contribution to feed. We formulate production models that account for these aspects. Using information on feed, grasslands and animal production at an aggregate scale for the 1961 to 2003 period, we estimate regional production functions that are compatible with either increasing or decreasing AFP/FFP ratios. These functions are used to simulate the necessary plant calories required to feed animals in quantities corresponding to different human diets. Our simulations do not support the idea that AFP/FFP will decrease drastically. In the extreme scenario, if the world adopts the average consumption of developed countries, the daily total use of food plant calories would increase by 50% at present and by 117% in 2050.
Acknowledgements
This work stems from the CIRAD/INRA Agrimonde Project and we are grateful to Agrimonde's members for the impetus given to our research. The article has also benefited from important suggestions by Philippe Chemineau, Philippe Lecomte, Yves Dronne and critical comments by four anonymous reviewers.
Supplementary materials
For supplementary material referred to in this article, please visit http://dx.doi.org/doi:10.1017/S1751731112000377