Introduction
The aim of precision agriculture to improve the management of nitrogen (N) fertilisers for arable cropping is long-standing (Sylvester-Bradley et al., Reference Sylvester-Bradley, Lord, Sparkes, Scott, Wiltshire and Orson1999), and many precision farming services for N management are now used widely on farms. The Yara N sensor and satellite sensing services from SOYL and IPF are the most widely used techniques for in field variable rate applications of N fertiliser in the UK, with sensing units such as Crop Circle, Optrx, Greenseeker, Rapidscan and Isaria also used. Whilst ‘absolute’ N calibrations for sensing technologies have been developed for oilseed rape, current systems for cereals vary N rates around a pre-determined field average, so do not directly give a ‘recommendation’ for total N.
Fertiliser N requirements are quantified on an absolute basis (and recommendations are normally given in the UK) from knowledge of three components: Crop N Demand (CND), Soil N Supply (SNS) and Fertiliser N Recovery (FNR), where:
 $$\eqalignno{ {\rm Fertiliser}\;&{\rm N}\;{\rm requirement}\,\left( {{\rm kg}\,{\rm ha}^{{{\!\minus}{\!\rm 1}}} } \right)\cr&{\rm {\equals}\,}{{{\rm CND}\,\left( {{\rm kg}\,{\rm ha}^{{{\!\minus}{\!\rm 1}}} } \right){\rm -SNS}\,\left( {{\rm kg}\,{\rm ha}^{{{\!\minus}{\!\rm 1}}} } \right)} \over {{\rm FNR}\,\left( {\rm \,\%\,} \right)}}$$
CND is the amount of N taken up by the optimised crop [so is largely the product of grain yield and grain N content (=protein ÷ 5.7) but including a minor amount of N in straw; standard CND values are 23 kg t−1 grain for UK feed wheats and 25 kg t−1 for milling wheats]. SNS is the amount of N available from the soil in the absence of fertiliser. FNR is the percentage of fertiliser N applied that gets into the optimised crop. Current UK guidance for wheat (Sylvester-Bradley, Reference Sylvester-Bradley2009) advocates stepwise estimation of CND, SNS and FNR to determine N requirements of wheat crops with ‘sliding-scale’ adjustments for any expected differences from standard values. This approach is just as applicable to variation within fields as it is between fields, since each of CND, SNS and FNR can potentially be estimated ‘automatically’ from prior information available through precision farming technologies, as follows.
CND can be estimated from likely yields and protein requirements. Yield maps from previous harvests enable estimates of yield to be made on a spatial basis, recognising that spatial patterns can vary year to year due mainly to weather. Fields can be zoned using statistical approaches to summarise seasonal variation (Milne et al., Reference Milne, Webster, Ginsburg and Kindred2011), or using other information (e.g. soil surveys, aerial and satellite imagery, digital elevation maps, etc.); yield estimates can then be made for each zone. Despite some uncertainties in their interpretation, standard targets for grain protein content have long been prescribed for feed and milling varieties of wheat in the UK and monitoring of grain protein is advocated as a means of retrospectively judging success of N management (Sylvester-Bradley and Clarke, Reference Sylvester-Bradley and Clarke2009). Thus CND can be estimated automatically from expected yield, target grain protein (hence N) content, and a standard N harvest index (say 0.7; Sylvester-Bradley et al., Reference Sylvester-Bradley, Berry, Blake, Kindred, Spink, Bingham, McVittie and Foulkes2008) to account for straw N. Protein sensors for grain harvesters are available (Whelan et al., Reference Whelan, Taylor and Hassall2009) but have not yet been widely adopted commercially.
SNS is considered to include all N that becomes available to the crop from the soil throughout the growing season (i.e. not from fertiliser or manure N applied within-season), including soil mineral N (SMN) present at the start of growth plus SMN that mineralises subsequently. The amount of N in an unfertilised crop at harvest (termed ‘harvested SNS’) is the ultimate measure of SNS (Kindred et al., Reference Kindred, Knight, Berry, Sylvester-Bradley, Hatley, Morris, Hoad and White2012). Variation in SNS is commonly seen as the prime driver of variation in N requirements in the UK and, on a field-to-field basis, is commonly estimated from previous crop, soil type and over-winter rainfall. Within fields, variation in SNS can be indicated by early crop growth. Sylvester-Bradley et al. (Reference Sylvester-Bradley, Clarke, Hatley, Wiltshire, Kindred and Wilson2009) showed that canopy sensing of NDVI (Normalised Difference Vegetation Index) using a Crop Circle (Holland Scientific) through winter and early spring could consistently distinguish plots where previous N response experiments had caused different residual SMN levels. Thus, based on a standard trajectory of ‘maximum NDVI’ (determined from sites with non-limiting SMN, and with site differences reconciled by plotting NDVI in relation to thermal time from sowing,), calibrations can be developed to infer spatial variation in SNS in spring (Kindred et al., Reference Kindred, Sylvester-Bradley, Milne, Marchant and Storer2016a).
FNR varies substantially between N response experiments and fertiliser types (Sylvester-Bradley et al., Reference Sylvester-Bradley, Kindred, Wynn, Thorman and Smith2014); for efficient fertilisers, the majority of this variation is not predictable. Whilst FNR is assumed to be 60% on most UK soils, distinctions are made for chalky (55%) and sandy and silt soils (70%; Defra, 2010). In principle soil sensing techniques such as electromagnetic induction (EMI), electrical conductivy (EC) and soil brightness could be used to identify zones in fields where soil types vary and different FNRs are expected.
Variability in N requirements within fields has seldom been assessed directly (Lark and Wheeler, Reference Lark and Wheeler2003) and variation in its components and hence its predictability has not been examined before. Thus the aims of this paper are to report results from recent ‘chessboard’ trials conducted in two separate projects (one on winter wheat and the other on winter barley) that quantified spatial variation in N requirements and in their components, and then to assess the predictability of within-field variation in N requirements using precision farming technologies.
Materials and methods
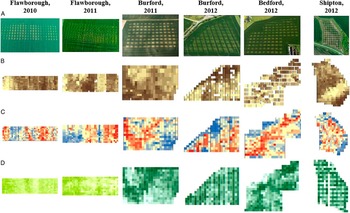
Field scale N response experiments were set up in a ‘chessboard’ design (Pringle et al., Reference Pringle, McBratney and Cook2004) on winter wheat crops harvested from 2010 to 2012 with detailed methodology and results as described by Kindred et al. (Reference Kindred, Milne, Webster, Marchant and Sylvester-Bradley2015; Reference Kindred, Sylvester-Bradley, Milne, Marchant and Storer2016a). Three similar experiments on barley harvested in 2015 (2 trials) and 2016 have not been described previously. Suitable fields and farms were identified and rates of total fertiliser N were set at either 0, 100, 200 and 300 or 0, 120, 240 and 360 kg ha−1 depending on initial SMN analysis. Fertiliser N was applied by the farmer as urea ammonium nitrate (UAN) with a sprayer (e.g. width 24 m) using the same procedure on each of two occasions. On each occasion N was applied in perpendicular directions to create a grid of plots with the four N rates arranged regularly (Fig. 1A). First, the smallest N rate (e.g. 50 kg ha−1) was applied by half of the sprayer width (nil being applied by the other half) in parallel runs along the field; then twice the first N rate (e.g. 100 kg ha−1) was applied by half of the sprayer in parallel runs running across the field; again nil was applied by the other half of the sprayer. Thus, after both occasions, >250 square plots had been created, fertilised with one of four N rates arranged in a grid, with the whole experimental area exceeding 3.5 ha (Fig. 1A). A plot harvester measured grain yield of each plot and samples were taken for protein analysis by near infra-red (NIR). Whole crop samples were also taken from each plot of the wheat experiments to determine N harvest index and total N uptake. Kriging then enabled estimation of CND, ‘harvested SNS’, and FNR on all plots. Linear plus exponential response curves were then fitted for each plot (with a common R parameter optimised for all plots at each site; Sylvester-Bradley et al., Reference Sylvester-Bradley, Kindred, Wynn, Thorman and Smith2014) and economic optimum N amounts were determined, assuming 5 kg grain and 1 kg fertiliser N were of equal value. Plan photographs were also taken from aircraft and maps of EMI, N sensor output and NDVI were made.
Aerial images (A) of six chessboard trials on wheat, with plots of 10×10 m or 12×12 m, showing their design and shape, and maps showing patterns of variation in ‘predictors’ assessed prior to any N applications, for comparison with subsequent patterns in final crop performance (Figure 2); B: EMI Soil electrical conductivity (darker=higher), C: average yields from previous seasons (Blue=low, red=high), and D: NDVI by Crop Circle in spring.

Results and discussion
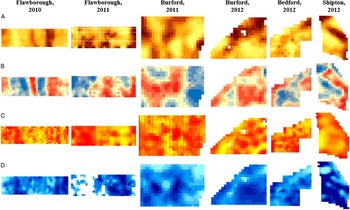
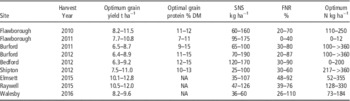
Figure 1 shows aerial images, to demonstrate the experiments’ design and shapes, with maps of variation in predictive variables for wheat: EMI, average previous yields and NDVI. Table 1 gives ranges of optimum grain yield and protein, harvested SNS, FNR and optimum N in the six wheat and three barley experiments, and Figure 2 shows their spatial variation for wheat.
Maps of six chessboard trials on wheat showing kriged values for A: ‘harvested SNS’ (darker=greater), B: optimum grain yield (blue=low, red=high), C: optimum grain protein (yellow=low, orange=high), and optimum applied N (darker=greater). Ranges for each variate are given in Table 1.

Summary of variation in N requirement (N optimum) and its three components in six chessboard experiments with wheat (2010–2012) and three with barley (2015–16)

Within-field variation in fitted N optima exceeded 100 kg ha−1 at all but one site and was more than 200 kg ha−1 at half of the sites. Spatial variation in optimal yield exceeded 2 t ha−1 at all wheat sites and harvested SNS varied by 50 kg ha−1 or more at seven of the nine sites. Wide ranges were also apparent for each of optimal grain yield, grain protein and FNR.
Patterns of spatial variation in all variates (Fig. 1 and 2) showed broad similarities, however patterns were far from identical. Thus some of the spatial variation in N optima can be explained in terms of SNS and crop N demand at some of the sites, but such explanations were imperfect. Also, a tendency for positive correlations between SNS and optimum yield diminished spatial variation in N optima, i.e. high yielding areas also tended to have higher SNS, so the increased requirement from higher CND (largely the product of grain yield and protein; Fig. 2) was counteracted by the reduced requirement due to higher SNS. Variation in harvested SNS (Fig. 2A) explained more variation in N optima than any other factor both within and between sites; it was more important than variation in yield (Fig. 2B). The variation in FNR was large at all sites (Table 1) and is largely unexplained, hence unpredictable. Much spatial variation was also apparent in optimal grain protein content; note that this variation appears to limit the usefulness of grain protein as a retrospective indicator of success in N management, something that has been advocated for many years in the UK to support field-to-field decision-making (Sylvester-Bradley, Reference Sylvester-Bradley2009).
Turning to the prediction of CND, SNS and FNR, hence requirements for applied N, the spatial variation in CND could be reasonably well anticipated from the use of past yield maps (Fig. 1C), despite the variation in grain protein and straw N. Also, spatial patterns in harvested SNS could be anticipated from crop sensing measures in spring (Fig. 1D); absolute values were predicted after scaling estimates in relation to an expected SNS for the field as a whole, based on previous crop type and soil type (Sylvester-Bradley, Reference Sylvester-Bradley2009). Nothing was found to render variability in FNR predictable. This and variability in grain protein content, together with the interactions between SNS and grain yield, limited the extent to which N optima could be predicted, even though SNS and optimum yield could be predicted fairly well.
Further ‘validation trials’ to those described here have demonstrated the practical feasibility of yield maps being used with canopy sensing to generate estimates of N requirement and being automated so that variable amounts of N fertiliser can be applied across fields automatically on a rational basis, following N management guidelines (Kindred et al., Reference Kindred, Sylvester-Bradley, Milne, Marchant and Storer2016a). However, to advocate investment in the technology to implement such automation on an extensive basis, the benefits must exceed the costs.
Surprisingly, the economic benefit of variable rate applications in the chessboard trials here was modest, generally being less than £10 ha−1 assuming that the comparable uniform N rate for the field was correct. The biggest economic benefits arose through accurately predicting N rates for each field, rather than fine tuning rates within fields. This partly reflects the limited impact on grain yield of perfectly optimising N rates. Spatial variation in yield was barely diminished by application of N fertiliser; variation in yield at the optimum was similar to that at any given N rate. Overall the impact on yield of optimal N application was generally less than 0.5 t ha−1 compared to the recommended N rate (Defra 2010), and less than 0.1 t ha−1 where the average N rate for the field was correct. This is despite the large variation in calculated N optima. The flat nature of all N response curves around their optima (not shown) dictated that the economic costs of over- or under-fertilising with N (by up to ~50 kg ha−1) were slight; with sub-optimal N the value lost in yield was nearly negated by savings in N fertiliser, and with super-optimal N the extra cost of N used was almost negated by slightly larger yields.
Conclusions and Implications
Whilst we have demonstrated large variation in N fertiliser requirements within fields associated with large variation in yield, available N from the soil, fertiliser recovery and achieved grain protein contents, it is also obvious that N fertiliser is not the main cause of yield variation in fields; getting fertiliser N rates perfectly right on every metre only gives modest increases in total yields beyond applying a fixed rate everywhere (say 200 kg ha−1). This is not the conclusion we expected to reach at the outset of this work, and is not the widely held perception amongst those who practise precision agriculture.
From an economic perspective, it is much more important to achieve an accurate average N rate for the whole field than to account precisely for within-field variation. Thus, the priorities must be to achieve accuracy for the whole farm overall, then for each field, and lastly for zones within fields. To achieve such accuracy it will be necessary to be able to monitor the success of N management on-farm, and it is concluded that this is only possible currently by testing the impacts of applying more or less N than the decided N rate. The potential for farmers to test 60 kg ha−1 more and less N on ‘test’ tramlines is now being studied in the ‘LearN’ project.
Given that variation in grain yield within all fields studied here was large, but largely not due to N limitation, then a very important question remains unanswered: ‘Why?’ It seems unlikely that deficiencies in non-N nutrients could explain much of the unexplained variation in yields in the UK, given the limited responses to macro- and micro-nutrients seen in recent trials (Sylvester-Bradley et al., Reference Sylvester-Bradley, Withers, Rollett, Talboys, Walker, Edwards, Payvandi, Heppell, Roose and Jones2017; McGrath et al., Reference McGrath, Stobart, Blake-Kalff and Zhao2013). Within-field differences in solar energy or rainfall received by areas with different topography or aspect would be trivial here because these fields were largely flat or unidirectional, and there was no shading by trees, hedges or buildings. Causes of yield variation would seem much more likely to relate to the soil, and most probably to the accessibility of soil water; patterns in EMI maps (Fig. 1B) seem to support this.
Compared to other trial designs (e.g. Mamo et al., Reference Mamo, Malzer, Mulla, Huggins and Strock2003) the chessboard trial design used here can provide invaluable insights into the impacts of soil on crop performance, and ways in which management can be optimised according to soil variation. These chessboard trials have revealed how much imprecision in conventional (replicated, randomised) trials is due to soil variation, and furthermore they have shown how the location of a conventional trial within a field can fundamentally affect its conclusions. With conventional trials interactions with soil type must commonly be inferred from multiple trials across widely dispersed locations where different varieties, management, site history and weather are all invariably confounded; with chessboard trials the only significant spatial differences arise from variations in the soil. It is now possible to envisage series of chessboard trials, with tailored treatments and measurements, which could address important questions concerning soil-related intra-field yield variation.
The intimate collaborations between scientist and precision farmers developed here also showed the scope for ‘agronōmics’, an approach to empower both farmers and the scientists who support them to make significant advances in understanding not only variation in N requirements, but in many other soil-related husbandry issues (Kindred et al., Reference Kindred, Sylvester-Bradley, Clarke, Roques, Smillie and Berry2016b).
Acknowledgements
The Auto N LINK project (LK09134) was sponsored by Defra through the Sustainable Arable LINK programme with support from AHDB Cereals & Oilseeds, AgLeader, Agrii, BASF, Farmade, FOSS, Hill Court Farm Research, Precision Decisions, SOYL, Soilessentials, Yara and Zeltex. We thank Murray Lark for statistical advice. We are also grateful to host farmers of the chessboard experiments John Hawthorne, Nick August, Ian Rudge, David Blacker and Neil Butler for their considerable support. The authors are grateful to Innovate UK for part funding the barley experiments through Project 101909 and to project partners: CF Fertilisers UK Ltd, Hill Court Farm Research, Precise Crop Nutrition, Syngenta UK, Precision LandCare, Patchwork Technology and also to Fritzmeier.