1. Introduction
Natural disasters have resulted in significant economic and human loss long before Adam Smith wrote about the Unterwald's communitarian tax mobilization. Major catastrophic events – recently the January 2010 earthquake in Haiti – repeatedly bring the human and material cost of these crises to the forefront of our attention. Natural disasters also figure prominently in public discussions about global warming, especially in relation to the attendant changes in the patterns of climatic events and sea levels (e.g., Elsner et al., Reference Elsner, Kossin and Jagger2008). Curiously, we appear to know very little about the fiscal consequences of disasters.
In developing the Emergency Events Database (EM-DAT) on disasters, a significant research effort has gone into measuring the primary direct costs of disasters in terms of human lives lost, the number of people affected, and the damage to property and infrastructure. In a recently emerging literature, several papers have used this data to examine the determinants of these economic costs (e.g., Kahn, Reference Kahn2004; Anbarci et al., Reference Anbarci, Escaleras and Register2005; Skidmore and Toya, Reference Skidmore and Toya2007; Raschky, Reference Raschky2008). Some further work has estimated the short- and long-run secondary impacts of disaster on production, productivity, and output (e.g., Skidmore and Toya, Reference Skidmore and Toya2002; Noy and Nualsri, Reference Noy and Nualsri2007; Cuaresma et al., Reference Cuaresma, Hlouskova and Obersteiner2008; Noy, Reference Noy2009; Cavallo et al., Reference Cavallo, Galiani, Noy and Pantano2010).Footnote 1 However, the likely fiscal impact of a natural disaster has not been examined before in any comparable or comparative framework.Footnote 2
On the expenditure side, the disaster reconstruction costs to the public may be very different from the original magnitude of destruction of capital that has occurred. For example, the cost for delivering and supplying populations with both short-term survival needs and longer term reconstruction may be fraught with logistical expenses and can also lead to other macroeconomic dynamics that will have an adverse impact on the government's fiscal spending. On the other hand, it is also possible that the added reconstruction costs be lower, especially if much of the capital that was destroyed is no longer necessary or was anyway becoming obsolete, is cheaper to replace, or because of wide-scale loss of life. In such cases, the fiscal spending burden may potentially be smaller (see Fengler et al., Reference Fengler, Ihsan and Kaiser2008, for more detail on these possibilities).
On the other side of the fiscal ledger, the impact of disasters on tax and other revenue sources has also not been quantitatively examined. To a large extent, impacts on revenue depend on the macroeconomic dynamics occurring following the disaster shock, and the structure of revenue sources (income taxes, consumption taxes, custom dues, etc.) since each may react differently in the aftermath of the disaster event.
Our work's aim is to obtain accurate estimates of the likely fiscal costs of a natural disaster. Such estimation can be useful in enabling better cost-benefit evaluation of various mitigation programs, particularly those that will likely be financed by the public purse. These estimates should also assist foreign aid organizations and international multilateral institutions in planning and preparing their programs, though this is not our primary motivation. Another rationale behind our direct estimates of the fiscal costs is a better enabling of governments to insure against disaster losses, indirectly through the issuance of catastrophic bonds (CAT bonds), or through precautionary savings.Footnote 3
We estimate the fiscal consequences of natural disasters using quarterly fiscal data for a large panel of countries. Our work does not provide any insight on other macroeconomic impacts of disasters, nor does it provide information about the fiscal dynamics in tranquil times or in times of consumer-generated volatility or uncertainty. In our estimations, we employ a panel vector autoregression (PVAR) framework. We find fiscal behavior in the aftermath of disasters in developed countries that can be characterized as counter-cyclical, but pro-cyclical decreased spending and increasing revenues in developing countries following large natural disasters. We explore the policy consequences of our findings in the concluding section.
2. Data
Our dataset include 22 developed and 20 developing countries; only data availability restricted our sample (see the appendix for a list of countries). We collected quarterly data on natural disasters and government finance for the period from 1990 to 2005. The natural disaster data are extracted from the EM-DAT database collected by the Centre for Research on the Epidemiology of Disasters (CRED).Footnote 4 The EM-DAT database provides information on worldwide disasters compiled from various sources, including UN agencies, non-governmental organizations, insurance companies, research institutions, and press agencies. Disasters reported in the database include hydro-meteorological disasters (floods, wave surges, storms, droughts, landslides, and avalanches), geophysical disasters (earthquakes, tsunamis, and volcanic eruptions), and biological disasters (epidemics and insect infestations). CRED defines a disaster as a natural situation or event which overwhelms local capacity necessitating a request for external assistance. Specifically, at least one of the following four criteria must be fulfilled: (1) 10 or more people reported killed; (2) 100 people reported affected; (3) declaration of a state of emergency; or (4) call for international assistance.
We construct a series of standardized quarterly disaster variables which reflect the magnitude of these disasters. We aggregate the amount of direct damage from disaster events reported in the EM-DAT database for a country in a given quarter, and then divided by the country's GDP from the same quarter of the previous year to facilitate cross-country comparisons.Footnote 5 The data on quarterly GDP comes from the International Finance Statistics (IFS) database provided by the International Monetary Fund (IMF).Footnote 6
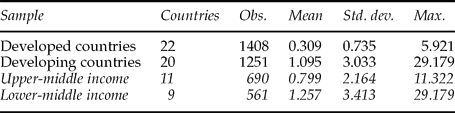
Table 1 reports the summary statistics of our disaster variable. It seems very likely that the direct cost of disaster relates to the level of development. Over the period from 1990–2005, the average damage amount from disasters is more than three times higher in developing countries than in developed countries (1.095 vs. 0.309 percent of GDP). This result is widely reported in the literature, with most explanations emphasizing the capacity of rich nations to better prepare and mitigate the cost of disasters. As has been already observed in Cavallo and Noy (Reference Cavallo and Noy2009), the EM-DAT records a large number of disasters so that, depending on the sample, about 30% of the observations include a disaster. Our empirical identification of the disaster effects, therefore, does not rely on a small number of observations (a potential problem given the time-series properties of such an empty series).
Summary statistics of disaster damage variable

Notes: See the appendix for a list of countries. Means and standard deviations are computed from disaster episodes only; number of observations denotes the total number of quarterly observations we obtain for each sample, including ‘no disaster’ observations.
The data on fiscal policy is primarily taken from the section on government finances in the IFS database (this data was supplemented by data from the Government Finance Statistics, also available from the IMF). The government finance data include cash flows of the budgetary central government (the statement of sources and uses of cash) and/or accrual flows of the consolidated general government (the statement of government operations). The two statements broadly correspond to each other, but with variation in the terminology used. In the analysis, we examine the following five fiscal variables: government consumption (govcon); government revenue (govrev); government payment (govpay); government cash surplus (govsurp); and government outstanding debt (govdebt).
Government consumption (line 91f, IFS) consists of consumption expenditure incurred by general government. The government revenue (line c1 or a1, IFS) consists of the following four main components: taxes; social contribution; grants; and other receipts. The government payment (line c2 or a2, IFS) includes compensation of employees, purchase of goods and services, consumption of fixed capital, interest payment, subsidies, grants, social benefits, and other payments. The government cash surplus or government net lending (line ccsd or anlb, IFS) is the net result of the net cash balance or net operating balance and the net acquisition of nonfinancial assets. The government outstanding debt (line c63 or a63, IFS) refers to the direct and assumed debt of the reporting level of government. We remove seasonal effects using the X12 seasonal adjustment method and present the data as GDP percentage.
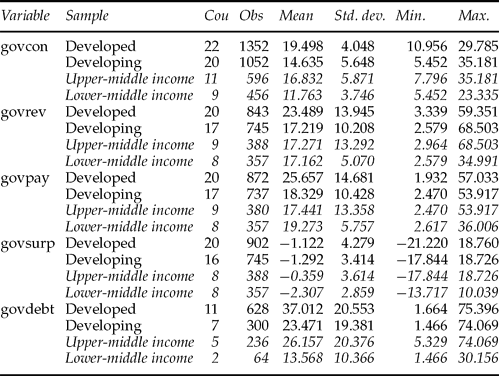
Table 2 displays the main descriptive statistics of the fiscal variables. The size of government is clearly larger in developed countries. However, upper-middle income countries have on average lower fiscal deficits than developed countries, while the lower-middle income countries have the largest average deficits (the sample mean of govsurp = −2.3% of GDP). Note that the outstanding debt variable contains substantially fewer observations, and should be interpreted with caution. In addition, though the government debt is usually stated in annual GDP percentage, the debt data presented here is divided by quarterly GDP.
Summary statistics of fiscal variables

3. Methodology
Eichenbaum and Fisher (Reference Eichenbaum and Fisher2005) estimate the impact of the 9/11/2001 terrorist attacks on the US government's fiscal accounts. Our aim in this paper is similar to theirs; we would like to describe the typical fiscal policy response following a large exogenous shock, a natural disaster, in a panel of developed and developing countries. In terms of the methodology we use, this paper is closest to Burnside et al. (Reference Burnside, Eichenbaum and Fisher2004) that described macroeconomic developments in the United States following three large exogenous fiscal shocks. The shocks they identify are the Korean War, the Vietnam War, and the Carter–Reagan military buildup. In their work, they use a vector autoregression (VAR) methodology that is in principle identical to ours; though our use of a panel necessitates a different estimation procedure.Footnote 7
We estimate a PVAR model and the corresponding impulse–response functions. The reduced form equation is as follows:

where xi, t is a two-variable vector: {disaster, fiscal}, αi is a vector of country-specific effects, λt is a vector of time-effects, and ei, t is an independently and identically distributed (i.i.d.) disturbance vector. Specifically, the bivariate vector {disaster, fiscal} encompasses five model specifications that correspond with the five fiscal variables we examine: government consumption, revenue, payments, surplus, and debt. As suggested in Love and Zicchino (Reference Love and Zicchino2006), the original variables are time-demeaned and the fixed individual effects are removed by the Helmert transformation method.Footnote 8
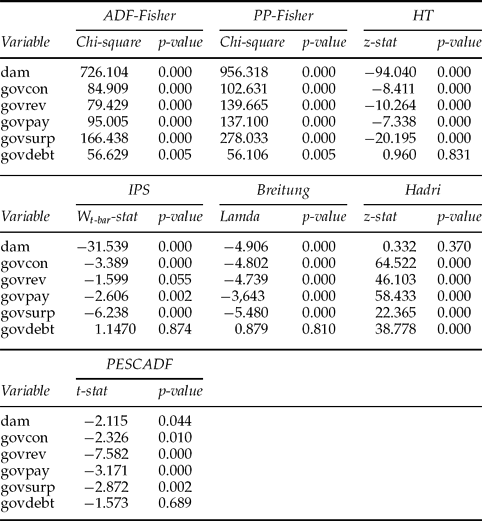
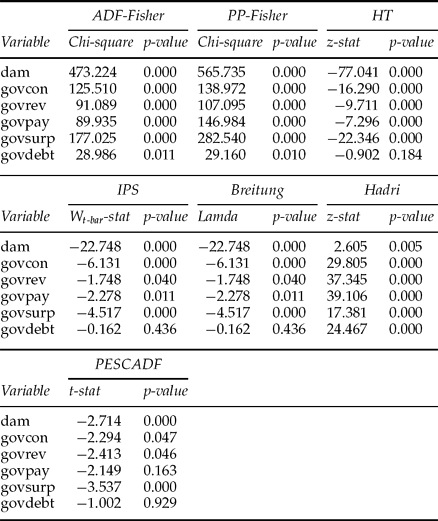
We test for stationarity by implementing a battery of panel unit root tests, including some which aim to account for cross-sectional dependence (in particular, see Breitung and Das, Reference Breitung and Das2005 and Pesaran, Reference Pesaran2007). The results of these unit-root tests are reported in tables 3a and 3b; and although these are not completely conclusive, we believe the preponderance of evidence suggests that the assumption of stationarity is probably warranted for all variables (with the exception of government debt where the evidence is more mixed when some of the newer tests do not reject a unit root in that series).
Panel unit root test results: developed countries

Notes: Variables shown are transformed variables using time-demeaned and the Helmert fixed-effect transformation methods. The ADF-Fisher and PP-Fisher tests are the Fisher-type tests using ADF and PP proposed by Maddala and Wu (Reference Maddala and Wu1999). The HT test is the test proposed by Harris and Tzavalis (Reference Harris and Tzavalis1999). The IPS test is the test proposed by Im et al. (Reference Im, Pesaran and Shin2003). The Breitung test is the test proposed by Breitung (Reference Breitung and Baltagi2000) and Breitung and Das (Reference Breitung and Das2005). The test allows for cross-sectional dependence in the panel data. The Hadri test is the LM test proposed by Hadri (Reference Hadri2000). The test allows for heteroskedasticity across panels. The PESCADF test is the test proposed by Pesaran (Reference Pesaran2007). The test allows for heterogenous panels with cross-section dependence. All the tests, except the Hadri LM test, have the null hypothesis that the data contain a unit root. The Hadri LM test has the null hypothesis that all the panels are stationary, while the alternative hypothesis is that at least some of the panels contain a unit root.

The model is estimated using a generalized method of moments (GMM) estimation with untransformed variables used as instruments for transformed variables. The numerical impulse–response is computed from the estimated PVAR coefficients. We perform Monte Carlo simulations to the estimated standard errors to generate 10th and 90th percentiles of the distribution which will be used as a confidence interval of the impulse–response. The number of repetitions is 1,000 times.
4. Results
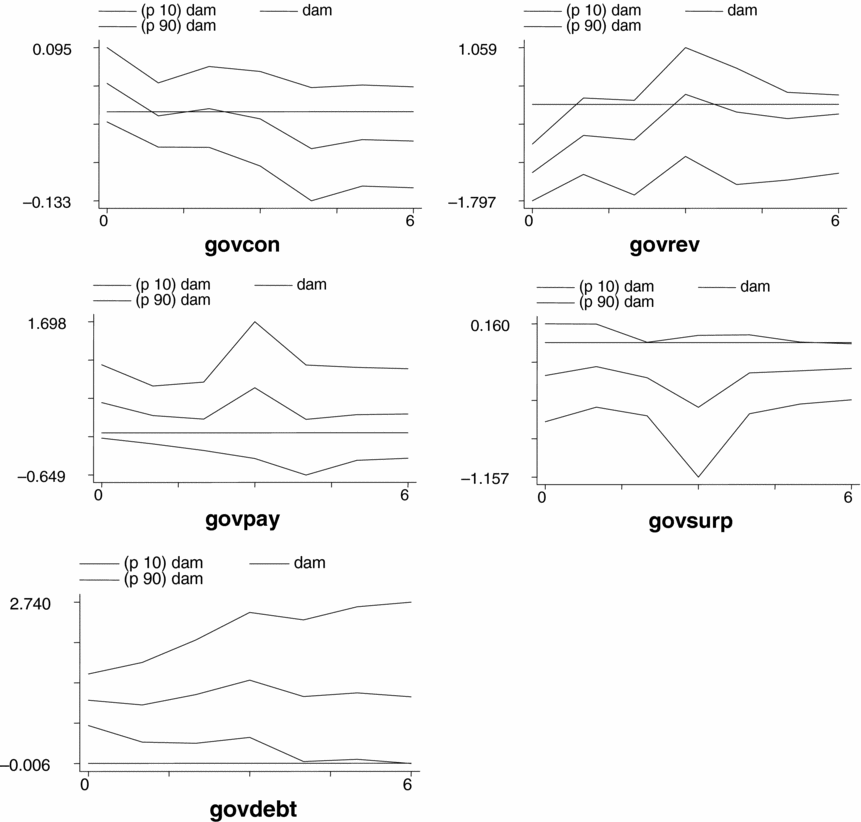
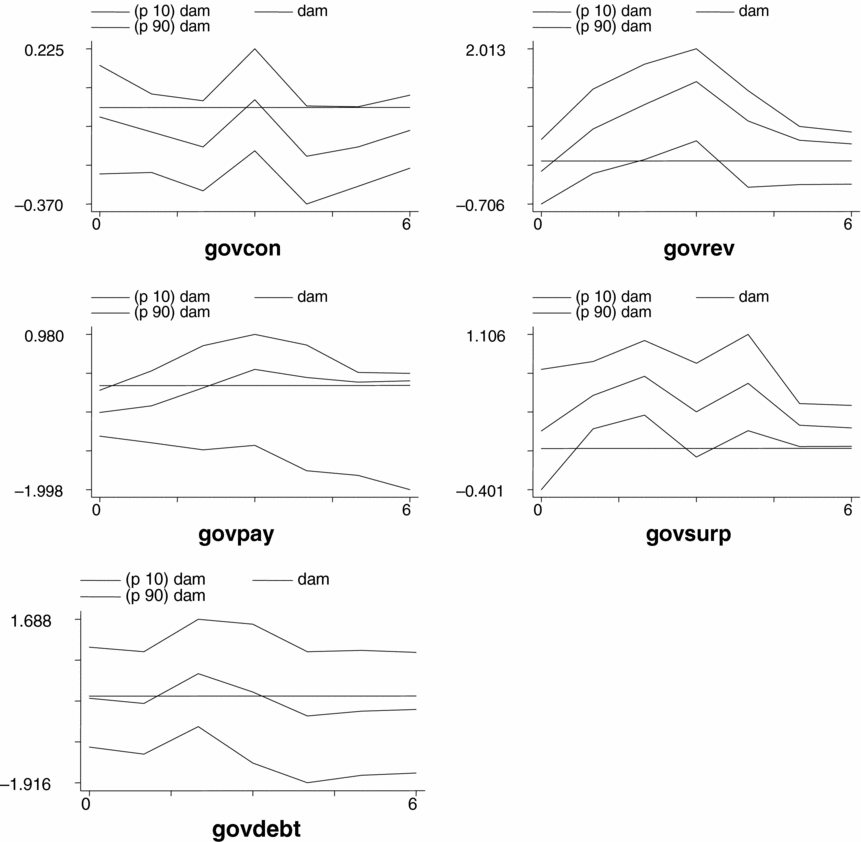
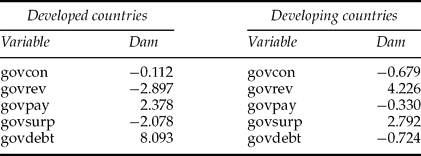
Figures 1a and 1b show impulse–response dynamics of a disaster shock on the fiscal variables for developed and developing countries from the baseline model as specified in equation (1). We set the magnitude of the disaster shock to two standard deviations because we want to examine the impact of large-scale disasters. We summarize the cumulative fiscal impact of a large (2 STD) natural disaster over the first six quarters in tables 4a and 4b.
Selected impulse–response graphs from the baseline model for developed countries (two-standard-deviation disaster shock).

Selected impulse–response graphs from the baseline model for developing countries (two-standard-deviation disaster shock).

Cumulative impact: (a) developed countries and (b) developing countries

Note: From the baseline model with four lags.
For developed countries, we find that the government consumption ratio rises on impact (0.04 per cent of GDP) and gradually declines thereafter. The government revenue drops immediately (−1.27 per cent of GDP) with negative cumulative impact, despite some improvements over time. The government payment, on the other hand, increases on impact (0.46 per cent of GDP) reaching its peak in the third quarter. The government cash surplus is negative on impact, which is equivalent to being a net borrower (−0.28 per cent of GDP) and continually getting worse. Finally, the government outstanding debt increases following the shock (1.07 per cent of GDP), accumulating more than 8 per cent of GDP over a year and a half.
The dynamic responses of developing countries are quite different from those of developed countries. Developing countries pursue a largely pro-cyclical fiscal policy following a large natural disaster shock. On impact, government consumption, government revenue, government payment, and outstanding debt respond negatively, whereas the government cash surplus increases. The cumulative impact shown in table 4b emphasizes even more this surprising pro-cyclical behavior. The cumulative government consumption expenditure and government payment decline (−0.68 per cent and −0.33 per cent of GDP, respectively), government revenue and cash surplus rise (4.23 per cent and 2.79 per cent of GDP, respectively), and outstanding debt decreases (−0.72 per cent of GDP).Footnote 9
5. Robustness
In the baseline model, we estimate the PVAR model using four lags based on the Akaike Information Criterion (AIC) (with quarterly data). This choice, while intuitively appealing given the use of quarterly data, is certainly ad hoc. In order to verify the robustness of our results, we expand the lag length to six and eight lags to generate the corresponding impulse–response function and cumulative impact. For both sub-samples, results are, to a large extent, robust and similar to the four lags estimations. For the interested reader, more details, including the impulse–response graphs and data describing the cumulative impacts, are available in Noy and Nualsri (Reference Noy and Nualsri2008).
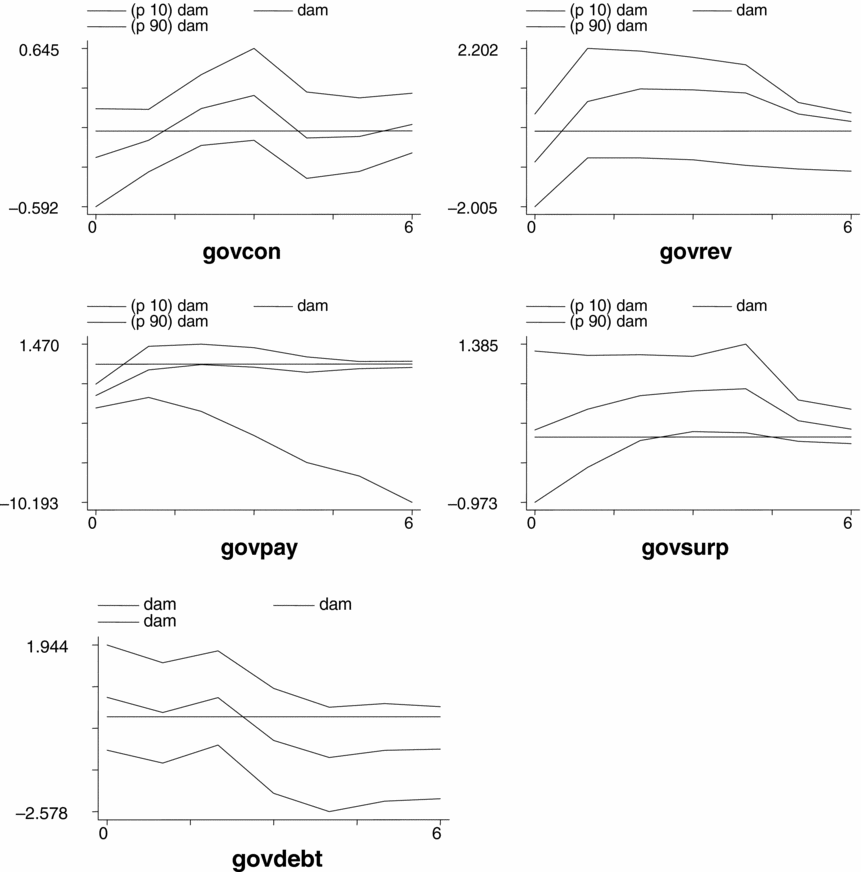
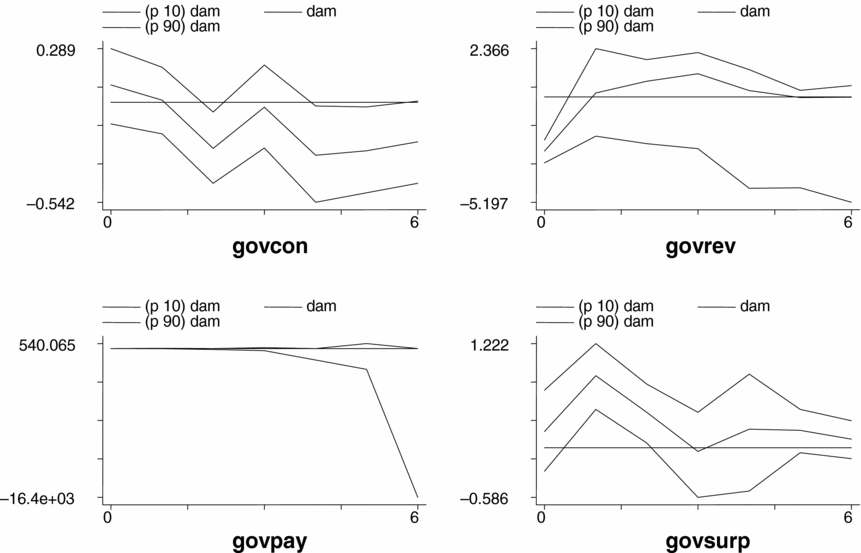
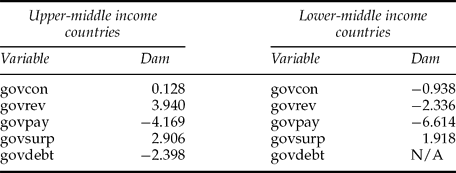
In addition, we split the developing countries sub-sample into upper-middle income and lower-middle income countries. Figures 2a and 2b show their impulse–response graphs and tables 5a and 5b report their cumulative impacts. We find that in the cumulative impact, the pro-cyclical fiscal policy is stronger in the lower-income developing countries, suggesting a decreasing ability to use fiscal policy to withstand external negative shocks that is associated with lower income.
Selected impulse–response graphs from the baseline model for upper-middle income countries (two-standard-deviation disaster shock).

Impulse–response graphs from the baseline model for lower-middle income countries (two-standard-deviation disaster shock).

Cumulative impact: (a) upper-middle income countries and (b) lower-middle income countries

Note: From the baseline model with four lags.
6. Fiscal projections for some prototypical cases
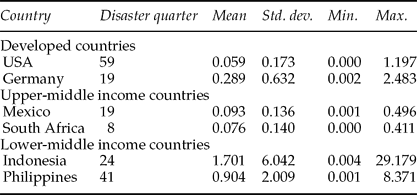
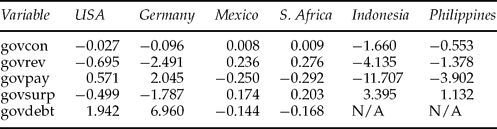
One of the purposes for this work is to equip policy makers with an estimate of the likely impact of a large natural disaster on their government accounts. Since different countries have different vulnerabilities to disasters – both in terms of occurrence probabilities, and the different disaster scales – we calculate for several countries the average magnitude of a two-standard-deviation disaster and from that calculate the disaster's likely fiscal impact. The disaster data for specific countries are presented in table 6, while the cumulative fiscal impacts are presented in table 7.
Summary statistics of disaster variable for selected countries

Note: All statistics are calculated from disaster episodes.
Cumulative impacts – selected countries

Note: From the baseline model with four lags.
Table 7 provides us with the magnitude of the estimated fiscal effects for several countries. These estimates are based on the regression results presented in tables 4a, 5a, and 5b. Table 7 clearly demonstrates that while our empirical exercise was aimed at estimating the average effect of a disaster on fiscal variables, the actual magnitude of the estimated effects are different across different countries as these countries face different disaster probabilities and different distributions of the disaster magnitude.
7. Conclusions, policy, and future research
We estimated the fiscal consequences of natural disasters using quarterly fiscal data for a panel of 22 developed and 20 developing countries from 1990–2005 using VARs, as in Burnside et al. (Reference Burnside, Eichenbaum and Fisher2004). In our estimations, we employ a PVAR framework that also controls for the business cycle and was developed by Love and Zicchino (Reference Love and Zicchino2006). We find fiscal behavior in the aftermath of disasters to be different between developed countries and developing countries. In developed countries, governments seem to be ‘leaning against the wind’ and increasing spending and cutting taxes following a large disaster event. On the other hand, fiscal policy in developing countries can best be described as pro-cyclical; with governments largely decreasing spending and increasing revenues in the aftermath of large natural disaster events.
While we cannot conclude anything about the reasons behind this differentiated behavior, we observe that this counter-intuitive pro-cyclical fiscal policy in developing countries is well documented in other contexts, most recently by Ilzetzki and Végh (Reference Ilzetzki and Végh2008). These findings suggest an extra urgency to develop insurance mechanisms that will enable governments to insure against these adverse fiscal consequences. This need is especially acute in developing countries, since the pro-cyclical policy adopted in the aftermath of the disaster leads to further and deeper adverse macroeconomic outcomes because of these events.
Our quantitative results suggest the exact amount of coverage that governments need to accumulate to insure against these adverse outcomes. For example, given the results presented in table 7, we suggest that given past experiences, the Indonesian government should insure itself, perhaps through the issuance of CAT bonds, to a larger extent than the Philippine government. These are preliminary results, and while suggestive, a mechanism to measure more precisely the amount of insurance needed to account for both the occasional large-scale disaster together with frequent smaller disasters needs to be developed.
Once we obtain a benchmark for the likely fiscal dynamics after a disaster, we can also start to examine the determinants of these effects. For example, different public responses to disaster damage may depend on the government accountability to the electorate, i.e., more democratic regimes with freer speech/press and more transparent institutions may be more likely to respond more aggressively to disasters than autocratic governments, which are neither responsive nor accountable to the population. The seminal contribution discussing this hypothesis is Sen (Reference Sen1981), which discussed the absence of large-scale famines in democracies.
A small literature has later examined Sen's hypothesis using various empirical methodologies and datasets, yet has reached little agreement. Besley and Burgess (Reference Besley and Burgess2002) observe that flood impacts in India are negatively correlated with newspaper distribution and therefore political accountability; and Eisensee and Strömberg (Reference Eisensee and Strömberg2007) reach similar conclusions regarding the response of US disaster aid to media reports. In contrast, Rubin (Reference Rubin2009) casts doubts on the salience of democracies in preventing famines, and like Plumper and Neumayer (Reference Plumper and Neumayer2008), argues for a more nuanced causal relationship between political accountability and famine occurrence that also depends on other structural factors.Footnote 10
Detailed fiscal expenditure data, coupled with the available disaster data from the EM-DAT, can be used to examine Sen's hypothesis directly: Is indeed the fiscal response in democratic regimes more aggressive following disasters? The availability of fiscal expenditure data at the sub-national level may even be more useful in this context, especially in federal systems like the United States and India.Footnote 11
Appendix: List of countries

Group classification based on the World Bank.