NOMENCLATURE
Symbols
 $a,b$
Model coefficients in various prediction models
- $e$
Error between predicted value and true value
- $f1, p_{1}$
The regression coefficient vectors of partial least squares regression model
- $l_{i}$
The combination coefficient of the i-th prediction model
- $P_{k}$
Partial autocorrelation function of ARIMA
- $s_{t}$
The smoothed value of time t in exponential smoothing model
- $x(t)$
Historical values of variables to be predicted at time t
- $\hat{x}(t), y(t)$
Prediction value of variable at time t
- $\alpha$
Weight coefficient in chain prediction model
- $\theta$
Connection threshold of BP model
- $\lambda_{i}$
The order ratio of sequence is in GM (1,1) model
- $\hat{\rho}_{k}$
Autocorrelation function of ARIMA
- $\omega$
Connection weight of BP model


Abbreviations
- $\textrm{ARIMA}$
Autoregressive integrated moving average model
- $\textrm{BP\ model}$
Back propagation neural network prediction model
- $\textrm{GM(1,1)}$
Grey prediction model of one variable
- $\textrm{GM(1,4)}$
Grey prediction model of four variables
- $\textrm{RMSE}$
The root mean square error
- $\textrm{R}^{2}$
The coefficient of determination
- $\textrm{SSE}$
The square sum of dispersion


1.0 INTRODUCTION
In recent years, China’s economy has developed rapidly, and the disposable income of the individuals has also increased considerably. The traffic volume between various regions and various countries has expanded each year(Reference Cao1). People are no longer satisfied with the traditional modes of transportation. For the sake of convenience, speed and even safety, more and more people choose to travel by air, which has also contributed to the rapid development of China’s aviation industry. China’s air passenger demand is growing at a faster rate, far exceeding the development rate of the global civil aviation industry(Reference Lin2). From 2000 to 2018, China’s civil aviation passenger traffic maintained a compound growth rate of 14.2%, while the global civil aviation industry passenger traffic growth rate was about 5.5%(Reference Liu, Hang, Wang and Zhou3). At the same time, China’s C919 passenger aircraft project transitioned smoothly from research and development to airworthiness. For long-term development, it is necessary for these companies to master the future product market. Therefore, the demand forecast for civil aircraft market has become increasingly important.
The forecast of civil aircraft market demand has guiding significance for the analysis of existing aircraft products and the development of aviation-related industries(Reference Ellison and Stafford4). First, the forecast of market demand can be applied to the construction of aviation infrastructure. The operation time of airports is generally more than 20–30 years, and the investment is several billions. Without understanding the future aviation market demand, it is impossible to build an airport that meets the needs of the next few decades(Reference Ito5). Second, the market demand forecast can be used as the basis of development planning for aviation industry-related industries (Reference Brown6). Airlines need to schedule flights and plan for capacity through market demand forecasts. Finally, the forecast of the aviation market is of great significance to aircraft manufacturers. The development cycle of a typical aircraft is roughly 10 years, which indicates that a model aircraft which is currently under development is usually launched a decade later(Reference Franz, Hrnschemeyer, Ewert, Fromhold-Eisebith and Reichmuth7). If a company does not understand the market demand, it is very likely that the consequences of the aircraft’s mismatch with market demand will be a waste of billions of dollars.
At present, the international companies represented by Boeing and Airbus attach great importance to the forecast of demand analysis of the civil aircraft market, and use this to guide the development of new products. They regularly publish a global aviation market demand forecast report to inform the airlines on the introduction of aircrafts. Therefore, the forecasts from these aircraft manufacturers are highly commercially oriented, and the predicted results will also serve their product strategy. For example, Boeing’s forecasts tend to favour small- and medium-sized wide-body aircraft, while Airbus is more optimistic about the market for large wide-body aircraft(Reference Anker8).
However, they do not publish their predictive analysis methods and relevant details. There are many researchers working on prediction models of aviation passenger demand. Dipasis Bhadra has established a regression analysis model to consider economic and demographic factors (Reference Bhadra9). The study found that air transport demand is determined by the population level at the beginning and end, spatial variables, airport characteristics, route characteristics, network characteristics, etc. Profillidi applied fuzzy linear regression to forecast the passenger demand at Rhodes Airport in southern Greece(Reference Profillidis10); Rengaraju and Thamizh Arasan used urban resident population, employment ratio, number of university degree holders, distance, flight frequency, air and rail travel time indicators and other indicators to establish a city-to-gravity model to study the demand for air passengers among 40 cities in India(Reference Rengaraju and Arasan11); Gregory M et al. considered factors such as flight connection quality, carrier, fare, aircraft type, flight time, etc., and used Multinomial Logit (MNL) to calculate the share of different airlines in the overall aviation market and forecast the future market demand(Reference Coldren, Koppelman, Kasturirangan and Mukherjee12).
China’s research on the demand forecast of the civil aircraft market started late. Domestic commercial aircraft companies have begun to publish an annual forecast report of the civil aircraft market only in recent years. It is conceivable that the methods and systems for forecasting are not mature. However, some researchers have still conducted some research on this aspect. Sun Hong and Shi Hongsheng used the Gross Domestic Product (GDP) index of the national economy as an independent variable to determine the air transportation demand between two cities using the gravity model(Reference Sun and Shi13). Wang Xingyun established a neural network model for flight demand forecasting, which proves that the neural network model has advantages of fast online prediction and relatively high prediction accuracy(Reference Wang, Fan, Wu and Chi14); Zhang Yongli and Zhang Lingxiang studied the prediction effects of the grey prediction model and the shared model proposed by Boeing, and proved that the grey prediction model has better applicability and higher prediction accuracy(Reference Zhang and Zhang15).
The rest of this paper is organised as follows. The current predictive model systems and the principles of several specific predictive models used in this work are introduced in section 2. The third section uses multiple models for simulation prediction, and three models with better prediction results are obtained. In section 4, a combination of three models to predict China’s civil aircraft market in the next 20 years is proposed. Finally, we conclude the work in section 5.
The innovation of this article is listed as follows. We use a variety of models to predict future data of relevant factors, then apply these data and the causal analysis prediction model to predict the future value of target data. The predictive chain method is adopted to predict relevant factors affecting the target data step by step, finally obtaining the future predicted value of the target data. The multiple forecasting methods are combined flexibly to form a forecasting system for predicting the market demand of civil aircraft. The method of combining human judgement and the correlation coefficient is used to select the influencing factors of the target data. The experimental prediction error of the historical data is used to determine the selection of the combined model dynamic coefficient.
2.0 MARKET FORECASTING METHODS
2.1 Forecasting method system
The existing forecasting methods can be divided roughly into qualitative forecasting and quantitative forecasting. Qualitative forecasting is based on the historical data and intuitive materials that have been mastered, using personal experience and analytical judgement ability to assess the nature and extent of the future development of things. Quantitative prediction uses a certain mathematical method to carry out scientific processing according to the relatively complete historical statistics that have been mastered, which are mainly used to study and explore the numerical value of a certain attribute of a subject in the future.
Quantitative prediction is divided into the time series prediction method and the causal analysis prediction method(Reference Zhang and Guo16,Reference Torralbo17) . The time series prediction method is constructed on the basis of time series data of things, and uses a certain mathematical method to establish a mathematical model to describe its changing law and to predict the extension. The causal analysis prediction method is proposed on the basis of the causal relationship of the change of the object, looking for the reasons for the market change, analysing the connection structure between the cause and the result and establishing a mathematical model to predict the future development trend of the market. In general, the causality analysis method needs a larger amount of data than does the time series method, its theory and calculation are more complicated and the prediction accuracy is generally higher.
According to the characteristics of medium- and long-term forecast in China’s civil aircraft market demand forecasting, this work uses the time series forecasting method, causal analysis forecasting method and chain prediction model method to predict China’s civil aircraft demand. The prediction models involved are the grey time series prediction model GM(1,1), Autoregressive Integrated Moving Average (ARIMA) model, exponential smoothing prediction model, multiple regression prediction model, grey correlation system prediction model GM(1,N), the Back Propagation (BP) neural network model and partial least squares regression. Each model has its own applicable conditions (Table 1). The application principles of these models are detailed below.
Comparison of common market forecasting methods(Reference Zhang and Guo16)

2.2 Grey prediction model
The grey system theory was first proposed by the Chinese scholar Professor Deng Julong in the international market in March 1982. The grey prediction is a method for predicting systems with uncertain factors and is widely used in various fields(Reference Javed and Liu18). The grey time series prediction model GM(1,1) can also have good predictive effects when the time series is short and the statistical data are sparse. Compared with GM(1,1), the grey correlation system prediction model GM(1,N) not only retains the characteristics of using less data for prediction, but also increases the other relative data that affect the data change, so that the model also contains historical data of other influencing factors(Reference Cai19).
The model is built as follows:
Step 1. Get the original sequence of target historical data
$X_0^{(0)}(k)$, and the correlation factor original sequence matrix $\{ {X_i^{(0)}(k)}\}\left( {{\rm{i=1,2,3}}..{{n}}} \right)$, where k is the number of time series and n is the number of related variables. If it is the time series prediction model GM(1,1), we have n = 1 and $X_i^{(0)}(k)\{ {{\rm{i=1,1,1}}..{{1}}}\}$.Step 2. Perform a ratio test on the original sequence of target data. If ratio
${\lambda _i}(t)$ is in the interval $(e^{-\frac{2}{n+1}},e^{\frac{2}{n+1}})$, it passes the test. Otherwise, it is necessary to process the sequence to make it fall within the interval.(1)
\begin{align}
{{\boldsymbol\lambda _\textbi{i}}(\textbi{t}) = \frac{{\textbi{x}_{\textbi{i}}^{\bf (0)}\left( {\textbi{t} - {\bf 1}} \right)}}{{\textbi{x}_{\textbi{i}}^{\bf (0)}\textbi{t}}}\left( {\textbi{t}=\textbf{2,\,3 \ldots}\textbi{k}} \right)}\\[-18pt]\nonumber
\end{align}
Step 3. There are n + 1 series of columns to form a matrix X(0). Accumulate each column of the matrix to get matrix X(1).
(2)
\begin{equation}\begin{array}{*{20}{c}}{\textbi{x}_{\textbi{i}}^{\bf (1)}(\textbi{t}) = \sum \nolimits_{\textbi{j}=\textbf{1}}^{\textbi{t}} \textbi{x}_{\textbi{i}}^{\bf(0)}(\textbi{t})\;\;\;\;\textbi{t} = \left( {\textbf{2,\,3 \ldots .}}\textbi{k} \right)}\end{array}\end{equation}
Step 4. Generate immediate matrix B.
(3)
\begin{align}B &= \left[ {\begin{array}{c@{\quad}c@{\quad}c@{\quad}c}{{\rm{ - }}{{\rm{z}}_0}^{(0)}(1)}&{{x_1}^{(1)}(1)}&{..}&{{x_n}^{(1)}(1)}\\ \\[-9pt]{{\rm{ - }}{{\rm{z}}_0}^{(0)}(2)}&{{x_1}^{(1)}(2)}&{..}&{{x_n}^{(1)}(2)}\\ \\[-9pt] {..}&{..}&{..}&{..}\\ \\[-9pt] {{\rm{ - }}{{\rm{z}}_0}^{(0)}(k)}&{{x_1}^{(1)}(k)}&{..}&{{x_n}^{(1)}(k)}\end{array}} \right]\nonumber\\[3pt] \textbi{z}_{\bf 0}^{\bf (1)}\textbi{i} & =\begin{array}{*{20}{c}}{ \frac{\bf 1}{\bf 2}\left( {\textbi{x}_{\bf 0}^{\bf (1)}\left( \textbi{i} \right) + \textbi{x}_{\bf 0}^{\bf (1)}\left( {\textbi{i} - {\bf 1}} \right)} \right)\;\;\left( {\textbi{i} = {\textbf{2,\,3 \ldots k}}} \right)}\end{array}\end{align}
Step 5. Establish GM (1, N) model.
(4)where,
\begin{align}
{\textbi{x}_{\bf 0}^{\bf (0)}(\textbi{t}) + \textbi{az}_{\bf 1}^{\bf (1)}(\textbi{t}) = \mathop \sum \nolimits_{\textbi{i}={\bf 2}}^{\textbi{n}} {\textbi{b}_{\textbi{i}}}\textbi{x}_{\textbi{i}}^{\bf 1}(\textbi{t})}\\[-18pt]\nonumber
\end{align}
$x_0^{(0)}(t)$ is the grey derivative, $z_1^{(1)}(t)$ is the background value and a, ${b_i}$ are the parameters. Then, the whitening differential equation of GM(1,N) is(5)
\begin{align}
{\frac{{{\rm{dx}}_{\bf 0}^{\bf (1)}}}{{{\rm{dt}}}} + \textbi{ax}_{\bf 0}^{\bf (1)}(\textbi{t}) = \mathop \sum \nolimits_{\textbi{i}={\bf 1}}^{\textbi{n}} {\textbi{b}_\textbi{i}}\textbi{x}_{\textbi{i}}^{\bf (1)}(\textbi{t})}\\[-20pt]\nonumber
\end{align}
Solve it to get the time response function of the whitening differential equation:
(6)
\begin{align}
{\widehat{\textbi{x}}}^{({\bf 1})}_{{\bf 0}}\left(\textbi{t}+{\bf 1}\right)=\left({\textbi{x}}^{({\bf 1})}_{{\bf 0}}({\bf 1})-\frac{{\bf 1}}{\textbi{a}}\sum^{\textbi{n}}_{\textbi{i}={\bf 1}}{{\textbi{b}}_{\textbi{i}}{\textbi{x}}^{({\bf 1})}_{\textbi{i}}\left(\textbi{t}+{\bf 1}\right)}\right){\textbi{e}}^{-\textbi{at}}+\frac{{\bf 1}}{\textbi{a}}\sum^{\textbi{n}}_{\textbi{i}={\bf 1}}{{\textbi{b}}_{\textbi{i}}{\textbi{x}}^{({\bf 1})}_{\textbi{i}}\left(\textbi{t}+{\bf 1}\right)} \\[-24pt]\nonumber
\end{align}
Parameters a and
${b_i}$ can be obtained by the least squares method.(7)
\begin{equation}[\textbi{a},{\textbi{b}_{\bf 1}},{\textbi{b}_{\bf 2}}, \ldots {\textbi{b}_{\textbi{n}}}]^{\textbi{T}} = {({\textbi{B}^{\textbi{T}}\textbi{B}})^{\bf - 1}}{\textbi{B}^{\textbi{T}}}\textbi{Y},\textbi{Y} = {[\textbi{x}_{\bf 0}^{\bf (0)}({\bf 2}),\textbi{x}_{\bf 0}^{\bf (0)}\left( \textbf{3} \right), \ldots \textbi{x}_{\bf 0}^{\bf (0)}(\textbi{k})]^{\textbi{T}}}\end{equation}
Step 6. After obtaining sequence
$\hat{X}_{0}^{(1)}(k+\phi)$, the prediction sequence is $\hat{X}_{0}^{(0)}(k+\phi)$, obtained by subtracting in turn, where${\rm{\;}}\phi $ is the length of time to be predicted.


ARIMA model parameter selection reference standard

2.3 Autoregressive integrated moving average model (ARIMA)
Introduced by Box and Jenkins(Reference Young20), the ARIMA model has been one of the most popular approaches for time series forecasting. The autoregressive moving model transforms the non-stationary time series into a stationary time series. It is a model established by regression of the lag value of the dependent variable and the present and lag values of the random error term. The ARIMA model regards the sequence of data formed over time as a random sequence. The sequence reflects the continuity of the original data in time and is affected by external factors as well as the law of self-change(Reference Narendra and Eswara21).
The modeling process is shown in Figure 1, and the detailed steps are as follows:
Step 1. Perform a stationarity test on the original sequence. If the sequence is unstable, perform differential operations on it. If d-order differential sequence is smooth, replace the original sequence
${X^{(0)}}(k)$ with the d-order difference sequence ${X^{(d)}}( {k - d})$.Step 2. Calculate the Autocorrelation Function (ACF) and Partial Autocorrelation Function (PACF) of the sequence. By analysing the autocorrelation graph and the partial autocorrelation graph, the best hierarchical p and the order q are obtained. The selection method is shown in Table 2. Then, three parameters in ARIMA(d, p, q) are determined.
(8)
\begin{equation}\begin{array}{c}{\hat{\boldsymbol\rho}}_{\textbi{k}}=\dfrac{\sum^{\textbi{n}-\textbi{k}}_{\textbi{t}={\bf 1}}{\left({\textbi{x}}_{\textbi{t}}-\bar{\textbi{{x}}}\right)\left({\textbi{x}}_{\textbi{t}+\textbi{k}}-\bar{\textbi{{x}}}\right)}}{\sum^{\textbi{n}}_{\textbi{t}={\bf 1}}{({\textbi{x}}_{\textbi{t}}-\bar{\textbi{{x}}})^{{\bf 2}}}} \end{array}\end{equation}
(9)
\begin{equation}\begin{array}{c}{\textbi{P}}_{\textbi{k}}=\dfrac{\textbi{Cov}\left[\left({\textbi{x}}_{\textbi{t}}-{\widehat{\textbi{x}}}_{\textbi{t}}\right),\left({\textbi{x}}_{\textbi{t}+\textbi{k}}-{\widehat{\textbi{x}}}_{\textbi{t}+\textbi{k}}\right)\right]}{\sqrt{\textbi{Var}({\textbi{x}}_{\textbi{t}}-{\widehat{\textbi{x}}}_{\textbi{t}})^{\phantom{f}}}\sqrt{\textbi{Var}({\textbi{x}}_{\textbi{t}+\textbi{k}}-{\widehat{\textbi{x}}}_{\textbi{t}+\textbi{k}})^{\phantom{f}}}} \end{array}\end{equation}
Step 3. Determine the model and estimate the parameters.
(10)where μ and
\begin{equation}\begin{array}{c}{\widehat{\textbi{x}}}_{\textbi{t}}=\boldsymbol\mu+\sum\nolimits^{\textbi{p}}_{\textbi{i}={\bf 1}}{\boldsymbol\varphi_{\textbi{i}}{\textbi{x}}_{\textbi{t}-\textbi{i}}+{\textbi{e}}_{\textbi{t}}+\sum\nolimits^{\textbi{q}}_{\textbi{i}={\bf 1}}{\boldsymbol\theta_{\textbi{i}}{\textbi{e}}_{\textbi{t}-\textbi{i}}}} \end{array}\end{equation}
$\phi$i are the parameters of AR and $\theta$i is the parameter of MA, which can be estimated by the maximum likelihood estimation.Step 4. Through the white noise test and parametric test of the model residual value, it is judged whether the model is desirable; if not, return to step 2.
Step 5. Use this model to make predictions about the target sequence.


Modelling flow chart of the ARIMA model.

2.4 Exponential smoothing model
The exponential smoothing method as one of the moving average methods is a relatively simple but robust approach to time-series based forecasting(Reference Maia and Goncalves22) and was first developed by Trigg and Leach(Reference Gardner23,Reference Shone24) . The performance of the method is characterised by different weight coefficients for a past observation value. This means that the weights of the more recent observation value are greater than the weights of the long-term observation value(Reference Newcome25). According to different smoothing times, the exponential smoothing method is divided into the single exponential smoothing method, quadratic exponential smoothing method and cubic exponential smoothing method. Their basic idea is that the predictive value is the weighted sum of the previous observations, and different weights are given to different data; thus, the new data are given more weight, while the old data are given less weight.
Basic formula of the exponential smoothing is
 \begin{equation}\begin{array}{c}{{\textbi{s}_{\textbi{t}}} = \textbi{a}\,{\ast}\,{\textbi{x}_\textbi{t}} + \left( {{\bf 1} - \textbi{a}} \right){\textbi{s}_{\textbi{t} - {\bf 1}}}}\end{array}\end{equation}
where S t is the smoothed value of time t, X t is the actual value at time t and a is the smoothing constant which takes the range [0, 1].
The quadratic exponential smoothing method is applied to perform a smoothing process after the single smoothing process, and the cubic exponential smoothing exponential model can be obtained by this method.
The model is built as follows:
Step 1. According to the time series trend, the smoothing model is selected. We cannot find an obvious trend to select the single exponential smoothing method. Nevertheless, there is a linear trend to select the quadratic exponential smoothing method, and the quadratic curve trend is used to choose the cubic exponential smoothing method.
Step 2. According to the data characteristics, the smoothing constant a is selected to establish an exponential smoothing model.
(12)
\begin{equation}\begin{array}{c}{\widehat{\textbi{x}}}_{\textbi{t}+{\bf 1}}=\textbi{a}{\textbi{x}}_{\textbi{t}}+\left({\bf 1}-\textbi{a}\right){\widehat{\textbi{x}}}_{\textbi{t}} \end{array}\end{equation}
(13)
\begin{equation}\begin{array}{l}\left\{ \begin{array}{c}{\widehat{\textbi{x}}}_{\textbi{t}+\textbi{T}}={\textbi{a}}_{\textbi{t}}+{\textbi{b}}_{\textbi{t}}\textbi{T} \\ \\[-6pt] {\textbi{a}}_{\textbi{t}}={\bf 2}{{\textbi{s}}_{\textbi{t}}}^{({\bf 1})}-{\textbi{s}}^{\left({\bf 2}\right)}_{\textbi{t}} \\ \\[-6pt] {\textbi{b}}_{\textbi{t}}=\frac{\textbi{a}}{{\bf 1}-\textbi{a}}({\textbi{s}}^{({\bf 1})}_{\textbi{t}}-{\textbi{s}}^{\left({\bf 2}\right)}_{\textbi{t}}) \end{array}\right. \end{array}\end{equation}
(14)where Equation (12) is the single exponential smoothing model, Equation (13) is the quadratic exponential smoothing model and Equation (14) is the cubic exponential smoothing model.
\begin{equation}\begin{array}{c}\left\{ \begin{array}{c}{\widehat{\textbi{x}}}_{\textbi{t}+\textbi{T}}={\textbi{a}}_{\textbi{t}}+{\textbi{b}}_{\textbi{t}}\textbi{T}+{\textbi{c}}_{\textbi{t}}{\textbi{T}}^{{\bf 2}} \\ \\[-6pt] {\textbi{a}}_{\textbi{t}}={\bf 3}{\textbi{s}}^{({\bf 1})}_{\textbi{t}}-{\bf 3}{\textbi{s}}^{\left({\bf 2}\right)}_{\textbi{t}}+{\textbi{s}}^{\left({\bf 3}\right)}_{\textbi{t}} \\ \\[-6pt]{\textbi{b}}_{\textbi{t}=}\frac{\textbi{a}}{{\bf 2}\textbi{(}{\bf 1}-\textbi{a}{\textbi{)}}^{{\bf 2}}}\left[\left({\bf 6}-{\bf 5}\textbi{a}\right){\textbi{s}}^{({\bf 1})}_{\textbi{t}}-{\bf 2}\left({\bf 5}-{\bf 4}\textbi{a}\right){\textbi{s}}^{\left({\bf 2}\right)}_{\textbi{t}}+\left({\bf 4}-{\bf 3}\textbi{a}\right){\textbi{s}}^{\left({\bf 3}\right)}_{\textbi{t}}\right] \\ \\[-6pt]{\textbi{c}}_{\textbi{t}}=\frac{{\textbi{a}}^{{\bf 2}}}{{\bf 2}\textbi{(}{\bf 1}-\textbi{a}{\textbi{)}}^{{\bf 2}}}\big[{\textbi{s}}^{({\bf 1})}_{\textbi{t}}-{\bf 2}{\textbi{s}}^{\left({\bf 2}\right)}_{\textbi{t}}+{\textbi{s}}^{\left({\bf 3}\right)}_{\textbi{t}}\big] \end{array}\right. \end{array}\end{equation}
Step 3. Perform a residual test on the model, then return to the second step if it is unreasonable.
Step 4. Use the model to predict the time series of future values.


2.5 Multiple regression prediction model
Compared with other models, regression analysis may be an easier and more practical way to solve different problems(Reference Catalina, Iordache and Caracaleanu26,Reference Yoshikane27) . There are two general applications for Multiple Regression (MR): prediction and explanation(Reference Kantar and Cavcar28). The theory of multiple regression prediction models is relatively simple, in which multiple regression equations between data and relevant factors are established to predict future time series data.
The model is built as follows:
Step 1. Establish multiple relevant matrices.
(15)
\begin{equation}\begin{array}{c}\textbi{X}=\left[ \begin{array}{c@{\quad}c@{\quad}c@{\quad}c@{\quad}c}{\bf 1} & {\textbi{x}}_{{\bf 1}}({\bf 1}) & {\textbi{x}}_{{\bf 2}}({\bf 1}) & \textbi{\dots } & {\textbi{x}}_{\textbi{n}}({\bf 1}) \\ \\[-6pt]{\bf 1} & {\textbi{x}}_{{\bf 1}}({\bf 2}) & {\textbi{x}}_{{\bf 2}}({\bf 2}) & \textbi{\dots } & {\textbi{x}}_{\textbi{n}}({\bf 2}) \\ \\[-6pt]\textbi{\dots } & \textbi{\dots } & \textbi{\dots } & \textbi{\dots } & \textbi{\dots } \\ \\[-6pt]{\bf 1} & {\textbi{x}}_{{\bf 1}}(\textbi{k}) & {\textbi{x}}_{{\bf 2}}(\textbi{k}) & \textbi{\dots } & {\textbi{x}}_{\textbi{n}}(\textbi{k}) \end{array}\right] \end{array}\end{equation}
Step 2. The coefficient of the regression equation is calculated by the least squares method to establish a regression equation.
(16)
\begin{equation}\begin{array}{c}\left[ \begin{array}{c}\textbi{y}({\bf 1}) \\ \\[-6pt]\textbi{y}({\bf 2}) \\ \\[-6pt]{\rm \dots } \\ \\[-6pt]\textbi{y}(\textbi{k}) \end{array}\right]=\left[ \begin{array}{c@{\quad}c@{\quad}c@{\quad}c@{\quad}c}{\bf 1} & {\textbi{x}}_{{\bf 1}}({\bf 1}) & {\textbi{x}}_{{\bf 2}}({\bf 1}) & \textbi{\dots } & {\textbi{x}}_{\textbi{n}}({\bf 1}) \\ \\[-6pt]{\bf 1} & {\textbi{x}}_{{\bf 1}}({\bf 2}) & {\textbi{x}}_{{\bf 2}}({\bf 2}) & \textbi{\dots } & {\textbi{x}}_{\textbi{n}}({\bf 2}) \\ \\[-6pt]\textbi{\dots } & \textbi{\dots } & \textbi{\dots } & \textbi{\dots } & \textbi{\dots } \\ \\[-6pt]{\bf 1} & {\textbi{x}}_{{\bf 1}}(\textbi{k}) & {\textbi{x}}_{{\bf 2}}(\textbi{k}) & \textbi{\dots } & {\textbi{x}}_{\textbi{n}}(\textbi{k}) \end{array}\right] \bullet \left[ \begin{array}{c}{\textbi{a}}_{{\bf 0}} \\ \\[-6pt]{\textbi{a}}_{{\bf 1}} \\ \\[-6pt]\textbi{\dots } \\ \\[-6pt]{\textbi{a}}_{\textbi{n}} \end{array}\right] \end{array}\end{equation}
Step 3. Use the model to predict future data, and comprehensively analyse the predicted values to determine the final predicted value.


2.6 Partial least squares regression
When there are many independent variables, multiple correlations between independent variables are inevitable. Sometimes the sample data are small, even less than the dimensions of the variables. The partial least squares regression is intended to solve these difficult problems(Reference Wu and Liu29).
The model is built as follows:
Step 1. The independent variable matrix X and the dependent variable matrix Y are normalised to obtain a matrix X0, Y0.
(17)where
\begin{equation}\begin{array}{c}{\textbi{X}}_{{\bf 0}}\left(\textbi{i},\textbi{j}\right)=\frac{\textbi{X}\!\left(\textbi{i},\textbi{j}\right)-{\overline{\textbi{x}}}_{\textbi{j}}}{{\widetilde{\textbi{x}}}_{\textbi{j}}} \end{array}\end{equation}
$\bar{x}_{j}$ represents the average value and $\tilde{x}_{j}$ represents the standard deviation.Step 2. Calculate the main component
${t_1}$of the independent variable and the main component ${u_1}$of the dependent variable.
(18)where
\begin{equation}\begin{array}{c}{\textbi{t}}_{{\bf 1}}={\textbi{X}}_{{\bf 0}}{\textbi{w}}_{{\bf 1}},{\textbi{u}}_{{\bf 1}}={\textbi{Y}}_{{\bf 0}}{\textbi{C}}_{{\bf 1}} \end{array}\end{equation}
${{\rm{w}}_1}$ is the matrix $X_0^{\prime}{Y_0}Y_0^{\prime}{X_0}$ corresponding to the eigenvector of the largest eigenvalue, ${{\rm{u}}_1}$ is the matrix $Y_0^{\prime}{X_0}X_0^{\prime}{Y_0}$ corresponding to the eigenvector of the largest eigenvalue.Step 3. Establish a regression equation:
(19)
\begin{equation}\begin{array}{c}{{\mathbf X}}_{{\bf 1}}={{\mathbf X}}_{{\bf 0}}-{{\mathbf t}}_{{\bf 1}}{\textbi{p}}^{{\mathbf T}}_{{\bf 1}}{\mathbf \ \ \ \ \ \ \ \ \ }{{\mathbf Y}}_{{\bf 1}}={{\mathbf Y}}_{{\bf 0}}-{{\mathbf u}}_{{\bf 1}}{\textbi{f}}^{{\mathbf T}}_{{\bf 1}} \end{array}\end{equation}
(20)where
\begin{equation}\begin{array}{c}{{\mathbf p}}_{{\bf 1}}=\frac{{{\mathbf x}}^{{\mathbf T}}_{{\bf 0}}{{\mathbf t}}_{{\bf 1}}}{{\left\|{{\mathbf t}}_{{\bf 1}}\right\|}^{{\bf 2}}}{\mathbf \ \ \ \ \ \ }{\mathbf f}_{{\bf 1}}=\frac{{{\mathbf Y}}^{{\mathbf T}}_{{\bf 0}}{{\mathbf u}}_{{\bf 1}}}{{\left\|{{\mathbf u}}_{{\bf 1}}\right\|}^{{\bf 2}}} \end{array}\end{equation}
${p_1}$ and f 1 are regression coefficient vectors.${\rm{\;}}$Step 4. Analyse whether the equation meets the accuracy requirements. If not, replace X0 and Y0 with X1 and Y1, and return to the second step until the accuracy is accepted.
Step 5. When the regression equation satisfies the accuracy requirements, the conversion can be performed to obtain the final regression equation:
(21)
\begin{equation}\begin{array}{*{20}{c}}{\textbi{w}}_{\textbi{m}}^{\ast} = \mathop \prod \limits_{\textbi{j}={\bf 1}}^{\textbi{j} = \textbi{i} - {\bf 1}} \left( \textbi{I} - {\textbi{w}_{\textbi{j}}{\textbi{p}_{\textbi{i}}}^{\textbi{T}}} \right){\textbi{w}_{\textbi{i}}}\end{array}\end{equation}
(22)
\begin{equation}\begin{array}{*{20}{c}}{{{\textbi{Y}}_0} = {{\textbi{f}}_1}{{\textbi{X}}_0}{\textbi{w}}_1^{\ast} + {{\textbi{f}}_2}{{\textbi{X}}_0}{\textbi{w}}_2^{\ast} + \cdots {{\textbi{f}}_{\textbi{m}}}{{\textbi{X}}_0}{\textbi{w}}_{\textbi{m}}^{\ast}}\end{array}\end{equation}


2.7 Back propagation (BP) neural network prediction model
To model a time series with non-linear structures, three-layer feed-forward back-propagation network is commonly used(Reference Curran, Raghunathan and Price30). By continuously inputting and outputting data to ‘train’ the network, the network continuously adjusts the weights of each node according to the input and output. After the training is finished, the output value can be obtained by giving the network an input value. By this method, the BP neural network model is generally used to establish the prediction model. Figure 2 is a visual representation of the model.
Schematic diagram of the BP neural network model.

Each artificial neuron can be abstracted with a mathematical expression:
 \begin{equation}\begin{array}{*{20}{c}}{\textbi{y} = \textbi{f}\left( {\mathop \sum \nolimits_{\textbi{j}}^{\textbi{n}} {\boldsymbol\omega _{\textbi{i}}}{\textbi{x}_{\textbi{i}}} - \boldsymbol\theta } \right)}\end{array}\end{equation}
where  $\theta$ is the threshold,
 $\omega$ is the connection weight and the function f(x) is the activation function. The commonly used sigmoid function is
 \begin{equation}\begin{array}{*{20}{c}}{\boldsymbol\sigma(\textbi{s}) = \frac{\bf 1}{{{\bf 1} + {\textbi{e}^{ - \boldsymbol\alpha \textbi{s}}}}}}\end{array}\end{equation}
The training process is to input the sample data into the network. The network calculates the output of each layer node in the forward direction, further calculates the error of the actual output and the expected output, then inversely calculates from the output layer to the input layer(Reference Lakshminarayanan31). In this way, the network adjusts the connection weights in a direction that reduces the error according to a certain principle and repeats the above steps for each sample until all the errors fulfil the requirements.
The model is built as follows:
Step 1. After clearly determining the target, find relevant factors related to the predicted target based on experience.
Step 2. Determine the input and output layers, determine the number of hidden layer nodes, which is generally less than N – 1 (N is the number of variables), and select the activation function and the initial weight.
Step 3. Enter the sample data, calculate the value of each node and the value of the final output layer, and calculate the error between the result and the expected value.
(25)
\begin{equation}\begin{array}{c}{\textbi{E}}_{\textbi{p}}=\frac{{\bf 1}}{{\bf 2}}\sum\limits^{\textbi{k}}_{\textbi{i}={\bf 1}}{\textbi{(}{\textbi{w}}_{\textbi{i}}-{\widehat{\textbi{w}}}_{\textbi{i}}{\textbi{)}}^{{\bf 2}}} \end{array}\end{equation}
This formula presents the error between the output layer value of the pth sample and the expected value, so the total error of the p samples is
(26)
\begin{equation}\begin{array}{c}\textbi{E}=\frac{{\bf 1}}{{\bf 2}}\sum\limits^{\textbi{p}}_{\textbi{p}={\bf 1}}{\sum\limits^{\textbi{k}}_{\textbi{i}={\bf 1}}{\left({\textbi{w}}^{\textbi{p}}_{\textbi{i}}-{\widehat{\textbi{w}}}^{\textbi{p}}_{\textbi{i}}\right)={\textbi{E}}_{\textbi{p}}}} \end{array}\end{equation}
Step 4. Adjust the connection weight according to the steepest descent method.
(27)
\begin{equation}\begin{array}{*{20}{c}}\boldsymbol\Delta {\boldsymbol\omega _{\textbi{nm}}} = - \boldsymbol\eta \frac{{\boldsymbol\partial \textbi{E}}}{{\boldsymbol\partial {\boldsymbol\omega _{\textbi{nm}}}}} = \mathop \sum \nolimits_{\textbi{p}={\bf 1}}^{\textbi{p}} \left( - \boldsymbol\eta \frac{\boldsymbol\partial {\textbi{E}_{\textbi{p}}}}{{\boldsymbol\partial {\boldsymbol\omega _{\textbi{nm}}}}} \right)\end{array}\end{equation}
(28)
\begin{equation}\begin{array}{*{20}{c}}\boldsymbol\Delta {\boldsymbol\nu _{\textbi{nk}}} = - \boldsymbol\eta \frac{{\boldsymbol\partial \textbi{E}}}{{\boldsymbol\partial {\boldsymbol\omega _{\textbi{nk}}}}} = \mathop \sum \nolimits_{\textbi{p}={\bf 1}}^{\textbi{p}} \left( - \boldsymbol\eta \frac{\boldsymbol\partial {\textbi{E}_{\textbi{p}}}}{{\boldsymbol\partial {\boldsymbol\nu_{\textbi{nk}}}}} \right)\end{array}\end{equation}
$\Delta {\omega _{{\rm{nm}}}}$ is the adjustment amount of the connection weight of the input layer and the hidden layer, and $\Delta {\nu _{{\rm{mk}}}}$ is the adjustment amount of the connection weight of the hidden layer and the output slave.Step 5. Repeat training until all errors meet the requirements.
Step 6. Enter the value of the input variable that needs the predicted value, obtain the predicted value and comprehensively analyse the predicted value to determine the final predicted value.


2.8 Combined forecasting model
The idea of combined forecasting was first proposed by Bates and Granger(Reference Bates and Granger32). Their starting point was to acknowledge the difficulty of constructing a real model, but for the same problem different forecasting methods can be applied. Different prediction methods have different prediction accuracy, and there is no prediction technology that achieves zero error. Nevertheless, different forecasting methods can provide different information(Reference Diebold and Pauly33). If some methods are simply discarded, this information will be lost. If various single predictions are regarded as different pieces of information, the unique uncertainty of a single prediction can be dispersed through the integration of information, thereby making full use of various prediction sample information(Reference Zhang34,Reference Chen, Zhu and Qu35) . The idea of combined forecasting is to make full use of the independent information contained in each single forecasting method. In theory, it should be more accurate than a single forecasting model. The independent information contained in a single prediction method may come from two sources: Equation (1), that is, the variables and information on which the prediction is based are not considered by other methods, and Equation (2). This method makes different assumptions about the relationship between variables than other methods. Since the 1970s, combined forecasting has gained attention in the theoretical and practical application fields. In 1989, the combined forecasting album published by an authoritative academic journal in the field of forecasting, Journal of Forecasting, established an important position of combined forecasting in the field of forecasting research(Reference Chen36).
The method of combined prediction is to assign different weights to the prediction results of each single prediction model to synthesise new prediction results. For an actual problem, k prediction models  ${\textbi{f}_{\bf 1}},{\textbi{f}_{\bf 2}}, \ldots ,{\textbi{f}_{\textbi{k}}}$ can be used for prediction, and the combined prediction model composed of them can be expressed as
 \begin{equation}\begin{array}{*{20}{c}}\textbi{f} = {\textbi{l}_{\bf 1}}{\textbi{\,f}_{\bf 1}}, + \;{\textbi{l}_{\bf 2}}{\textbi{\,f}_{\textbi{2}} + \cdots {{\bf l}_{\textbi{n}}}{\textbi{\,f}_{\textbi{n}}}\;\;\;\;\;\left( {\mathop \sum \limits_{\textbi{i} = \textbi{n}}^{\textbi{i}=\textbi{1}} {\textbi{l}_{\textbi{i}}}={\bf 1}} \right)}\end{array}\end{equation}
3.0 ESTABLISHMENT OF CIVIL AIRCRAFT MARKET FORECASTING MODEL
At present, there are two methods for forecasting the major market demands of aircraft. One is the ‘top-down’ macro-prediction method, and the other is the ‘bottom-up’ micro-prediction method(Reference Wang37). The former starts from macro-proofreading and estimates the demand for future aircraft demand in general; thus, it can be used for long-term forecasting. The latter method makes predictions about the aircraft demand for each city, then combines all the routes and the aircraft demand for the newly opened routes to obtain the total aircraft demand, which is mainly used for medium- and short-term forecasts. The predictions to be made in this work are long-term predictions, so the macro-prediction method is adopted. The following is a description of the time series prediction model, the causal relationship analysis prediction model and the chain prediction model.
3.1 Time series prediction model
The application condition of the time series forecasting model is that there are historical data of the predicted variable. The more historical data, the better the forecasting effect. For China’s civil aircraft market forecasting model, it is the number of civil aircraft in the past years. This article obtains from the official website of the National Bureau of Statistics of China the number of civil aircraft owned by China from 1999 to 2014(38), so all time series forecasting models can be used to predict China’s future civil aircraft market. The following figure is modelled using the various modelling methods described in section 2, which uses the 1999–2014 data as a sample, predicting the 2015–2017 data. Finally, the predicted result is compared with the actual value.
In the process of establishing the grey prediction model GM(1,1), the time series X0 level ratio test results are ${\rm{\;}}{\lambda _i}{(t)_{max}}=1.3268,\;\;{\lambda _i}{(t)_{min}}=1.0348$, so
 ${\lambda _i}(t)$ are all valid. According to Equation (3), the matrix B is obtained and the parameters a, b are calculated according to Equation (7) to be −0.1205, 620.1089. The final prediction model is
 \begin{equation}\begin{array}{*{20}{c}}{\textbi{x}_{\bf 1}^{\bf (1)}\!\left( {\textbi{t}+{\bf 1}} \right) = \left( {\textbf{949} + \frac{{\bf 6201089}}{{\bf 0.1205}}} \right){\textbi{e}^{\bf 0.1205t}} - \frac{{\bf 6201089}}{{\bf 0.1205}}}\end{array}\end{equation}
 \begin{equation}\begin{array}{c}{\widehat{\textbi{x}}}^{\left({\bf 0}\right)}_{{\bf 1}}(\textbi{t})={\textbi{x}}^{({\bf 1})}_{{\bf 1}}(\textbi{t})-{\textbi{x}}^{({\bf 1})}_{{\bf 1}}(\textbi{t}-{\bf 1}) \end{array}\end{equation}
In the ARIMA modelling process, the original sequence  $x_1^{(0)}$ has an upward trend and is not stable. After the second-order differential processing, it reaches a stationary state. According to the autocorrelation function and the partial autocorrelation function image, the parameters p and q are determined to be 1, 1. Therefore, the model ARIMA (2, 1, 1) is established, and the predicted sequence is calculated according to Equation (10).
It can be seen from Fig. 3 that there is a linear trend in the series to be predicted, so a quadratic exponential smoothing model is established and the model is established according to Equation (13) as follows:
 \begin{equation}\begin{array}{*{20}{c}} \bar{\textbi{x}}_{\bf 1}^{\bf (0)}(\textbi{t})={\bf 4099.8}+{\bf 212.39}( {\textbi{t} - {\bf 16}})\;\;\;\;\;\left( {\textbi{t}={\bf 17},\,{\bf 18},\,{\bf 19}} \right)\end{array}\end{equation}
Trend chart of the number of China’s civil aircraft over the years(38).

In the establishment of multiple regression prediction models, after the posterior error detection, the quadratic regression model is selected. The prediction model calculated by the least squares method is
 \begin{equation}\begin{array}{c}{\mathop \textbi{x}\nolimits_{\bf 1}^{\bf (0)}(\textbi{t})={\bf 1088.8} - {\bf 83.49}\textbi{t}+{\bf 17.86}{\textbi{t}^{\bf 2}}}\end{array}\end{equation}
The combined forecasting is divided into two types: constant weight and variable weight. The reasonable variable weight method can improve the prediction accuracy(Reference Yang, Li, Song and Chen39). The longer the predictive period of the time series prediction model is, the larger the prediction error will be. Based on this characteristic, this work proposes a new variable weight coefficient calculation method.
For the mth prediction period, the weighted average error of the last m sample data and the prediction data is used to determine the weight coefficient. In the following example, the year 2016 predictive value is the second forecast period, so the weight for this year is determined by the weighted average error between the predictive and true values for years 2014 and 2013. When the predictive period m is larger than the sample data capacity n, m is determined by the average error of all sample data.
 \begin{equation}\begin{array}{c}{\textbi{e}}^{{\bf 2}}_{\textbi{i}}=\textbi{a}{(\textbi{x}(\textbi{k})-\widehat{\textbi{x}}(\textbi{k}))}^{{\bf 2}}+\sum^{\textbi{j}=\textbi{m}-{\bf 1}}_{\textbi{j}={\bf 1}}{{\textbi{a}({\bf 1}-\textbi{a})}^{\textbi{j}}{(\textbi{x}\left(\textbi{k}-\textbi{j}\right)-\widehat{\textbi{x}}\left(\textbi{k}-\textbi{j}\right))}^{{\bf 2}}} \end{array}\end{equation}
where  $e_i^2$ represents the weighted average error of the ith model, a is the value of the adjustment coefficient between [0.5, 1], k is the sample size, x is the actual value and is the predictive value.
 \begin{equation}\begin{array}{*{20}{c}}{\textbi{e}^{\bf 2}} = \mathop \sum \nolimits_{\textbi{i}={\bf 1}}^{\textbi{i} = \textbi{n}} \textbi{l}_{\textbi{i}}\textbi{e}_{\textbi{i}}^{\bf 2}\;\;\;\;\;\;\;\;\;\mathop \sum \nolimits_{\textbi{i}={\bf 1}}^{\textbi{i} = \textbi{n}} {\textbi{l}_{\textbi{i}}={\bf 1}\;\;\;\;\;}\end{array}\end{equation}
where,  ${l_i}$ is the weight coefficient of the ith prediction model. To minimise the error squared
 ${e^2}$ of the combined prediction model, the problem needs to be solved by mathematical optimisation method. If the constraint condition of a non-negative coefficient is added and the linear optimisation method is used according to Equation (35), then the optimal solution is that the model coefficient with the smallest weighted error is 1 and the other model coefficients are 0. In this way, the combined forecasting model is transformed into a single forecasting model, which loses the value of the combined forecasting model. Therefore, the problem is transformed into a non-linear problem, which is solved by the Lagrange multiplier method with reference to the weighted method of reciprocal square error in the combination forecasting model(Reference Wu, Zhang, Guo and Wang40,Reference Zhang41) . According to the method of Lagrange multiplier, the weight coefficient of each single model is solved, and the solution process is as follows:
Lagrange function:
 \begin{equation}f{\rm =}\sum\nolimits^m_{i{\rm =1}}{\sqrt{l_i}}\left|e_i\right|{\rm +}\lambda {\rm (1-}\sum\nolimits^m_{i{\rm =1}}{l_i}{\rm )} (l_i>0,\forall i\in [1,n])\end{equation}
Take the derivation of  ${l_i}$ and
 $\;\;\lambda $ to make them equal to zero, respectively:
 \begin{equation}{l_1} = \frac{{4{\lambda ^2}}}{{e_1^2}},{l_2} = \frac{{4{\lambda ^2}}}{{e_2^2}}, \ldots \ldots {l_m} = \frac{{4{\lambda ^2}}}{{e_m^2}},{\rm{\;\;\;}}\mathop \sum \nolimits_{i=1}^m {l_i}=1\end{equation}
After the simultaneous equations, we get:
 \begin{equation}{l_2} = \frac{{{l_1}e_1^2}}{{e_2^2}},{l_3} = \frac{{{l_1}e_1^2}}{{e_3^2}}, \ldots \ldots {l_m} = \frac{{{l_1}e_1^2}}{{e_m^2}}\end{equation}
 \begin{equation}{l_1}\left( {1 + \frac{{e_1^2}}{{e_2^2}} + \frac{{e_1^2}}{{e_3^2}} + \ldots + \frac{{e_1^2}}{{e_m^2}}} \right)=1\end{equation}
 \begin{equation}{l_1} = \frac{1}{{e_1^2{\rm{*}}\mathop \sum \nolimits_{i=1}^m \left( {\frac{1}{{e_i^2}}} \right)}}\end{equation}
Weight coefficient of each single prediction model

Calculation results of each time series prediction model

Generalizing Equation (40), we obtain:
 \begin{equation}{l_i} = \frac{1}{{e_i^2*\mathop \sum \nolimits_{j=1}^m \left( {\frac{1}{{e_j^2}}} \right)}}\end{equation}
where  $e_i^2$ is calculated by Equation (34) and m is the number of the single prediction model.
According to the above method, the weight coefficient of the combination forecast calculated is shown in Table 3:
The prediction results of China’s civil aircraft market by using various time series prediction models are shown in Figure 4–8 and Table 4. The Root Mean Square Error (RMSE) of training data and prediction accuracy of test data are used to compare the five prediction models. The RMSE of training data and prediction absolute error of test data are used to compare the five prediction models. The RMSE of the training data can reflect the fit of the actual data of the model. The prediction absolute error of the test data can reflect the accuracy of the model’s prediction.
GM(1,1) model prediction data compared with real data.

ARIMA prediction data compared with real data.

Exponential smoothing model prediction data compared with real data.

Multiple regression model prediction data compared with real data.

Combined model prediction data compared with real data.

It can be seen from Fig. 9 that, in terms of the RMSE of the training data, the variable-weight combined prediction model is better than other models, while the multiple regression prediction model is the worst. From the 2015–2017 test prediction results (Fig. 10), the average error of the combined prediction is still the smallest, indicating that the model does not have overfitting. In contrast, other models have disadvantages in terms of fit or prediction accuracy. In addition, it is not difficult to see that as the forecasting time increases, the forecasting error will increase, which is unavoidable by all forecasting methods. This is because as the forecasting time increases, the fluctuations of uncertain factors will be superimposed, resulting in increased model errors. Therefore, the predictive stability of the model is also a manifestation of the quality of the model, which will be compared and analysed with other predictive models in section 3.4.
Comparison of the RMSE of each time series forecasting model.

Absolute error comparison chart for each time series prediction model.

In general, the five forecasting models are effective for short-term forecasting. Among them, the variable weight combination forecasting method is obviously better than other single forecasting models. Although the predictive period of this example is only three periods, even with the increase of the predictive period, the error growth trend of the combined prediction model proposed in this work is also better than that of other single prediction models. In addition, interested readers can calculate for themselves. The data in this case are all collected from the official website of the National Bureau of Statistics. Because of the limited layout, this paper will not give the prediction results of other prediction periods for each single prediction model (in section 3.2, the causal analysis prediction model).
The combined prediction model in this study is obtained by the weighted combination of four single prediction models. To analyse the sensitivity of the prediction error to the four weight coefficients of the model, the sensitivity analysis of the model is carried out below. This analysis adopts the above calculation case and takes the average of the relative errors of the forecast for the three years 2015–2017 as the target variable of Equation (42) to calculate the sensitivity. Then, we calculate the change range of the model prediction error when the four weight coefficients change range of −10%, −5%, 5% and 10%. The calculation results are presented in Table 5.
 \begin{equation}\begin{array}{c}\boldsymbol\triangle \textbi{E}=\frac{{\bf 1}}{{\bf 3}}\left(\left|\frac{{\widetilde{\textbi{e}}}_{{\bf 2015}}-{\textbi{e}}_{{\bf 2015}}}{{\textbi{e}}_{{\bf 2015}}}\right|+\left|\frac{{\widetilde{\textbi{e}}}_{{\bf 2016}}-{\textbi{e}}_{{\bf 2016}}}{{\textbi{e}}_{{\bf 2016}}}\right|+\left|\frac{{\widetilde{\textbi{e}}}_{{\bf 2017}}-{\textbi{e}}_{{\bf 2017}}}{{\textbi{e}}_{{\bf 2017}}}\right|\right) \end{array}\end{equation}
where e represents the relative error of the prediction result before the parameter change, and represents the relative error of the prediction result after the parameter change.
Sensitivity of the four weight coefficients of the model to prediction errors

It can be seen from Table 5 that, when the four weights in the combined forecasting model change in the negative interval, the change in the forecast error is not very large, but when it changes in the positive interval, the change in the forecast error is relatively large. This is because the prediction error of the model is a positive error, and the larger the weight coefficient, the farther away the predicted value will be from the true value, making the error change larger, whereas a smaller weight coefficient may make the predicted value closer to the true value, making the error change smaller. In addition, the sensitivity values of the four parameters are not very different, indicating that the four parameters have the same level of contribution to the calculation results of the model.
3.2 Causality analysis predictive model
The causality analysis predictive model generally finds the data related to the target data, subsequently establishing a quantitative relationship among them. Therefore, the application premise of the causal prediction model is to have the historical data of the predicted variable, the historical data of the relevant variable and its data at the forecast time point. However, for market forecasts, the relevant variable data is also unknown at the forecast time point. We used the time series prediction model to predict the value of the relevant variable at the forecast time point, which is substituted into the causal relationship predictive model established using historical data to calculate the future value of the target predictor variable.
When looking for relevant factors, it is necessary to consider the correlation among the data and whether there is correlation within the data. To avoid the high correlation between the influencing factors, the aircraft demand market is just related to the regional economy, population and passenger cargo turnover. The following table shows the correlation coefficients between various relevant data and aircraft ownership. The historical data of all variables come from the official website of the National Bureau of Statistics of China(38).
Civil aircrafts can be divided into commercial aircrafts and general aviation aircrafts. Therefore, according to the correlation coefficients presented in Table 6, the civil aviation passenger turnover data directly related to the number of commercial aircraft are selected, and the civil aviation cargo turnover data directly related to the number of general aircraft are selected. Year-end total population data and economically related GDP data are selected. The causal analysis prediction model modelling method described above is used. The model will be modelled based on data from the years 1999–2014, and subsequently the data from the years 2015–2017 can be predicted. Finally, the prediction results are compared with the actual values.
Correlation coefficients between various factors and the number of civil aircraft

Weight coefficient of each single prediction model

Results of each causal analysis prediction model

In the grey prediction model GM(1,4), the target sequence level ratio test results are the same as the GM(1,1) model test results. The parameters a, b 1, b 2, b 3 and b 4 calculated according to Equation (7) are respectively 0.3640, 0.0052, 0.0156, −0.9079 and −18.2817, so the final prediction model is
 \begin{equation}\begin{array}{*{20}{c}}{\textbi{u}\left( {\textbi{t}+{\bf 1}} \right) = \frac{{\bf 0.0052}}{{\bf 0.3640}}\textbi{x}_{\bf 2}^{\bf (1)}\left( {\textbi{t}+{\bf 1}} \right) - \frac{{\bf 0.0156}}{{\bf 0.3640}}\textbi{x}_{\bf 2}^{\bf (1)}\left( {\textbi{t}+{\bf 1}} \right) + \frac{{\bf 0.9079}}{{\bf 0.3640}}\textbi{x}_{\bf 3}^{\bf (1)}\left( {\textbi{t}+{\bf 1}} \right) + \frac{{\bf 18.2817}}{{\bf 0.3640}}\textbi{x}_{\bf 4}^{\bf (1)}\left( {\textbi{t}+{\bf 1}} \right)}\end{array}\end{equation}
 \begin{equation}\begin{array}{*{20}{c}}{\textbi{x}_{\bf 1}^{\bf (1)}\left( {\textbi{t}+{\bf 1}} \right) = \left( {{\bf 949} + \textbi{u}\left( {\textbi{t}+{\bf 1}} \right)} \right){\textbi{e}^{\bf 0.1205t}} - \textbi{u}\left( {\textbi{t}+{\bf 1}} \right)}\end{array}\end{equation}
 \begin{equation}\begin{array}{c}{\widehat{\textbi{x}}}^{\left({\bf 0}\right)}_{{\bf 1}}(\textbi{t})={\textbi{x}}^{({\bf 1})}_{{\bf 1}}(\textbi{t})-{\textbi{x}}^{({\bf 1})}_{{\bf 1}}\left(\textbi{t}-{\bf 1}\right) \end{array}\end{equation}
When the BP neural network prediction model is established, the sigmoid function is used as the activation function. The input layer number is 3, the output layer number is 1 and the hidden layer number is 3. The initial weight is randomly generated, and then the model can be built up.
According to the above work, the partial least squares model is established as
 \begin{equation}\begin{array}{c}\widehat{\textbi{y}}\left(\textbi{i}\right)={\bf 18596}.{\bf 69}-{\bf 0}.{\bf 1445}{\textbi{x}}_{{\bf 1}}+{\bf 0}.{\bf 0038}{\textbi{x}}_{{\bf 2}}+{\bf 0}.{\bf 3984}{\textbi{x}}_{{\bf 3}}-{{\bf 0}.{\bf 0367}\textbi{x}}_{{\bf 4}} \end{array}\end{equation}
It can be modelled by general regression equations, resulting in
 \begin{equation}\begin{array}{c}\widehat{\textbi{y}}\left(\textbi{i}\right)={\bf 10944}.{\bf 64}-{\bf 0}.{\bf 0821}{\textbi{x}}_{{\bf 1}}+{\bf 0}.{\bf 0096}{\textbi{x}}_{{\bf 2}}+{\bf 0}.{\bf 0242}{\textbi{x}}_{{\bf 3}}-{{\bf 12}.{\bf 09}\textbi{x}}_{{\bf 4}} \end{array}\end{equation}
According to the calculation of Equations (34–41), the weight coefficient of the combination forecast calculated is shown in Table 7.
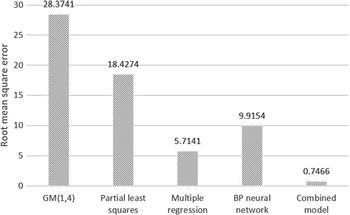
The prediction results of China’s civil aircraft market by using various causal analysis prediction models are shown in Figure 11–15 and Table 8. It can be seen from Fig. 16 that the five causal analysis prediction models have relatively large differences in the fit of the training data. The combined model has the best fit, while the grey model has the worst. In general, the level of fit is equivalent to that of the time series forecasting model. In terms of the absolute error of prediction of test data, (as shown in Figure 17) multiple regression and combined prediction models are better than the other models. Therefore, after considering the two indicators, the combined forecasting model is the best choice.
GM(1,4) model prediction data and real data comparison chart.

Partial least squares model prediction data and real data comparison chart.

Multiple regression model prediction data and real data comparison chart.

BP neural network model prediction data and real data comparison chart.

Combined model prediction data and real data comparison chart.

Comparison of the RMSE of each causal analysis prediction model.

Absolute error comparison chart for each causal analysis prediction model.

It can be concluded from the prediction results that the short-term prediction effect of each causal analysis prediction model is better, although there is no significant advantage in the prediction error and curve fitting degree compared with that of the time series prediction model, but with the prediction period increasing, the advantage of this causality analysis prediction model is gradually revealed, which is proved below. In addition, the variable weight combination prediction model adopted in this work has a greater advantage in prediction error and curve fitting, compared with each single prediction model.
To analyse the sensitivity of the prediction error to the four weight coefficients of the model, the sensitivity analysis of the model is carried out below. This analysis adopts the above calculation case and takes the average of the relative errors of the forecast for the three years 2015–2017 as the target variable Equation (42) to calculate the sensitivity. Then, we calculate the change range of the model prediction error when the four weight coefficients change range of −10%, −5%, 5% and 10%. The calculation results are presented in Table 9.
Sensitivity of the four weight coefficients of the model to prediction errors

It can be seen from Table 9 that when the fluctuation of the values of the four weighting coefficients becomes larger, the fluctuation of the prediction error will also become larger, indicating that the value of the weighting coefficient is close to the optimal value. In addition, under the same coefficient fluctuation level, the error caused by the fluctuation of coefficients  ${l_2}$,
 ${l_4}$ is obviously greater than
 ${l_1}$,
 ${l_3}$, indicating that the prediction results are more sensitive to the values of coefficients
 ${l_2}$,
 ${l_4}$. This is because the prediction results of models 2 and 4 are closer to the true value, so they have a larger weight, which makes their sensitivity higher.
3.3 Chain prediction model
In the causal analysis prediction model, although only part of the highly correlated data is selected from the population economy and the passenger turnover, respectively, there is a strong correlation between them. For example, the correlation coefficient between the total population and the civil aviation passenger turnover reaches 0.95, which means that there is incomplete multiple collinearity between related factors. That will result in large variance of the prediction results and standard error. The sign of the regression coefficient is also contrary to the economic significance. Finally, it will be difficult to assess the contribution of each relevant data to the target data.
Because of the above problems, this work proposes a new predictive model, the chain predictive model, which only selects the most relevant correlation variables to establish a relationship with the target variables, thus naturally avoiding the problem of multicollinearity. At this time, the model uses the data of other factors to predict the data of the strongest relevant factor, and the data of the relevant variables are predicted with the causal relationship prediction model, while the data at the end is predicted by the time series prediction model. According to this idea, the following China’s civil aircraft market demand chain prediction model is designed.
The model is still modelled on the basis of the data from the years 1999–2014, and then the data of years 2015–2017 is predicted. As shown in Fig. 18, the time series forecasting method is used to predict the value of the year-end population and GDP in years 2015–2017. Using causal analysis to establish the corresponding relationship among population and total passenger turnover, GDP and civil aviation passenger turnover, we can calculate the predicted value of civil aviation passenger turnover. Finally, the causal analysis method is used to establish the relationship between civil aviation passenger turnover and the number of civil aircrafts, and then the predicted number of civil aircrafts in years 2015–2017 is calculated. The results are shown in Table 10 and Figure 19.
Calculation data for chain predictive model

Schematic diagram of China’s civil aircraft market demand chain forecasting model.

Chain predictive model prediction data and real data comparison chart.

It can be seen from the Comparison chart of prediction error (Figure 20) that the chained prediction model proposed in this work has a good predictive effect on short-term predictions, and has great advantages compared with each single time series prediction model and the causal prediction model. Even compared with the prediction effects of the two combined prediction models, the prediction error and curve fitting degree of the chain prediction model is not inferior, and it is slightly better in terms of prediction error stability.
Comparison of prediction error between two combined prediction models and chain prediction models.

3.4 Analysis of prediction effects of three models
This section uses a variety of models to model the years 1999–2014 sample data, predict the years 2015–2017 civil aircraft market and make a simple comparison of the forecast results. It has been concluded that the time series combined prediction model, the causal analysis combined prediction model and the chain prediction model are superior to the other models. Therefore, this work will analyse the prediction effects of these three prediction models through prediction error, error growth trend and prediction curve fitting degree.
The prediction error is different from the fitting error, which is the numerical difference between the true value and the predictive value, and the data of the prediction period do not contribute to the establishment of the model. The performance of the model is judged by the maximum relative error and the average relative error. In general, the prediction error tends to increase as the the length of the prediction period increases. This is due to the increasing of length of the prediction period and uncertain factors, which affects the prediction accuracy. Therefore, this work uses the forecasting error growth trend as a criterion for model evaluation. The curve fitting degree reflects the similarity between the data curve calculated by the model and the real curve. This performance is judged by the coefficient of determination R 2 and the square sum of dispersion SSE.
 \begin{equation} \begin{array}{c}\textbi{SSE}=\sum^{\textbi{i}=\textbi{n}}_{\textbi{i}={\bf 1}}{{\left(\textbi{x}(\textbi{i})-\widehat{\textbi{x}}(\textbi{i})\right)}^{{\bf 2}}} \end{array}\end{equation}
 \begin{equation} \begin{array}{c}{\textbi{R}}^{{\bf 2}}={\bf 1}-\dfrac{\sum^{\textbi{i}=\textbi{n}}_{\textbi{i}={\bf 1}}{{\left(\textbi{x}(\textbi{i})-\widehat{\textbi{x}}(\textbi{i})\right)}^{{\bf 2}}}}{\sum^{\textbi{i}=\textbi{n}}_{\textbi{i}={\bf 1}}{{\left(\textbi{x}(\textbi{i})-\overline{\textbi{x}}\right)}^{{\bf 2}}}} \end{array}\end{equation}
where x represents the actual value,  $\hat{x} $ represents the predicted value and
 $\bar{x} $ represents the actual average value.
Time series combination prediction model data results

Causal analysis combined prediction model data results

Chain predictive model predicts data results

Predictive value of the number of civil aircraft in service in years 2018–2037

Because of the limited data available, in the comparison of prediction effects below, as the forecast period increases, the data used for modelling will be reduced. For example, if you want to get the predictive effect of five prediction periods, you need to use years 1999–2012 historical data modelling to predict 2013–2017 data. Therefore, this work uses one to eight prediction periods to compare the performance of the model. The comparison results are shown in Table 11–13
It can be seen from the Figure 21 and 22 that with the increase of the forecast period and the decrease of the sample data, the three models show different degrees of error increase trend. The chain prediction model has the slowest growth rate, closely followed by the causal analysis combined prediction model. The time series combined predictive model is the fastest. In terms of prediction error and curve fitting degree, the three models have a good prediction effect in the short term, while the chain prediction model is better than the other two models in medium- and long-term prediction.
Comparison of three models’ 2017 absolute prediction error.

Three models maximum prediction relative error trend comparison chart.

Combining all the above analyses of the three types of forecasting models, in terms of modelling complexity, the time series forecasting method is the simplest, followed by the causal analysis forecasting method, and the chain forecasting model is the most complicated. In addition, combined forecasting models are more complex than single forecasting models. In terms of short-term forecast accuracy, causal analysis forecasting and chain forecasting methods have certain advantages, but they are not obvious. In terms of medium- and long-term forecast accuracy, chain forecasting models and combined forecasting models are better than other models. Therefore, we suggest the choice of the forecasting method to be the single time series forecasting method (ARIMA optimal) for short-term forecasting (1–5 years), and the combined variable weight combination model of time series forecasting can also be considered when the forecasting accuracy is high. For a mid-term forecast (5–10 years), one should adopt the causal analysis forecasting model (multiple regression optimal), and the variable weight combination model of causal analysis forecasting can also be considered when the forecasting accuracy is high. For long-term forecasting (more than 10 years), the chain forecasting model proposed in this article should be adopted.
4.0 ANALYSIS OF CIVIL AIRCRAFT MARKET FORECAST
In the previous section, we built various models with sample data and simulated predictions. Through the comparison and analysis of predicted values and real values, we finally concluded that the time series combined forecasting model, causal analysis combined forecasting model and chain forecasting model have a high degree of credibility for the Chinese civil aircraft market prediction. This section will use these three models to model the historical data from years 1999–2017 and forecast China’s civil aircraft market in years 2018–2037.
Since the three models have good performance in the short-term prediction effect, while in the medium and long-term prediction, the chain prediction model is obviously better than the other two models, the final prediction result will be the variable weight combination of the prediction results of the three models. The initial weighting coefficient of the chain prediction model is 0.4, and the others are both 0.3. With the increase of the forecast period, the weight coefficient  ${\alpha _1}$of the time series combined model decreases by 0.03 year by year until it reaches 0. The causal analysis combined model prediction weight coefficient
 ${\alpha _2}$. decreases by 0.02 gradually until 0, and the chain prediction model weight efficient is
 ${{\rm{\alpha }}_3}=1 - {\alpha _1} - {\alpha _2}$. The final prediction results are shown in Table 14 and Figure 23
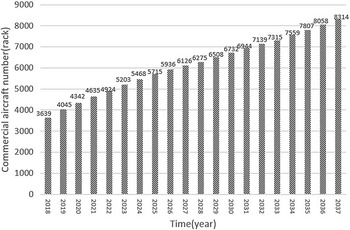
Forecasted number of commercial aircrafts in service in years 2018–2037.

According to historical data, the number of commercial aircraft in China accounts for about 60% of the total number of civilian aircraft. Considering that the service time of commercial aircraft is generally 30,000h or 20 years, the increase in the number of civil aircrafts each year includes the amount of increased demand and the number of supplementary decommissioned aircraft. After a simple transformation of the forecast results of civil aircraft demand, the number of commercial aircraft that China needs to supplement each year can be obtained, as shown in Figure 24.
Supplementary number of commercial aircrafts in years 2018–2037.

According to the 2018–2037 China Civil Aviation Market Outlook released by Boeing in Beijing(42), China will need 7,690 aircrafts in the next 20 years. According to China Commercial Aircraft Corporation’s China Commercial Aircraft Corporation Market Forecast Annual Report (2018–2037)(43), in 2037, China’s fleet will reach 9,965. According to China Aviation Industry’s 2018–2037 Civil Aircraft China Market Forecast Annual Report(44), by the end of 2037, the passenger aircraft fleet of China’s civil aviation transportation industry will reach 7,286.
By comparison, the prediction results of the prediction model of this work are very close to the prediction results of the annual reports issued by several companies, which confirms the proposed prediction model has a certain degree of credibility. In addition, it can be seen from the results that China’s civil aircraft market has a good prospect. Not only does it have a large demand for commercial aircrafts but also a large demand for general transportation aircrafts, which is an opportunity and a challenge for Chinese aircraft design and manufacturing companies.
The market forecasting model established in this work is not only effective for predicting the demand of China’s civil aircraft market, but is also applicable to market demand forecasting of other products, which will have certain guidance and reference value for market demand forecasting in other industries.
5.0 Conclusion
In this paper, we introduce a variety of market demand forecasting models, as well as propose a new combination forecasting model and chain forecasting model. Then, we use the single forecasting model, variable weight combination forecasting model and chain forecasting model to simulate and predict China’s civil aircraft market. Furthermore, by comparing and analysing the prediction results, three prediction models with better prediction effects are obtained. Finally, we use these three models to predict the demand of China’s civil aircraft market in the next 20 years. During this process, the following conclusions can be drawn:
(1) Variable weight combination forecasting model of time series and variable weight combination forecasting model of causality analysis have better prediction effect on prediction error and curve fitting degree, compared with any single prediction model.
-
(2) The prediction model considering the influence of other factors has better stability in error propagation than does the time series prediction model.
-
(3) The chain prediction model can achieve the prediction accuracy of the two variable weight combination prediction models in short-term prediction.
-
(4) The prediction of the chain prediction model in the medium and long term is far better in terms of accuracy and curve fit, compared with the other prediction models introduced in this paper.