Introduction
Several modelling studies have suggested that changes in the Earth’s climate will be felt first in the Arctic, and to a greater extent than elsewhere (e.g. Stouffer and others, 1989; Walsh, 1991; Cattle and Crossley, 1995). Spitsbergen (77–80° N, 10–22° E), in particular, is located at the northern extremity of the strong meridional transfer of heat linked to the warm-water North Atlantic Drift and to the relatively warm northward-tracking atmospheric depressions. The potential sensitivity of Spitsbergen to climate change is demonstrated by a rise of 4–5°C in mean annual temperature linked to the termination of the Little Ice Age cool period early in the 20th century (e.g. Steffensen, 1982; Dowdeswell, 1995). The potential importance of glaciers and small ice caps in general to greenhouse-induced warming and global sea-level rise has been discussed by several authors (e.g. Meier, 1984, 1990; Oerlemans and Fortuin, 1992), but the sensitivity of glaciers in the high Arctic to climate change has seldom been modelled (cf. Oerlemans and Fortuin, 1992).
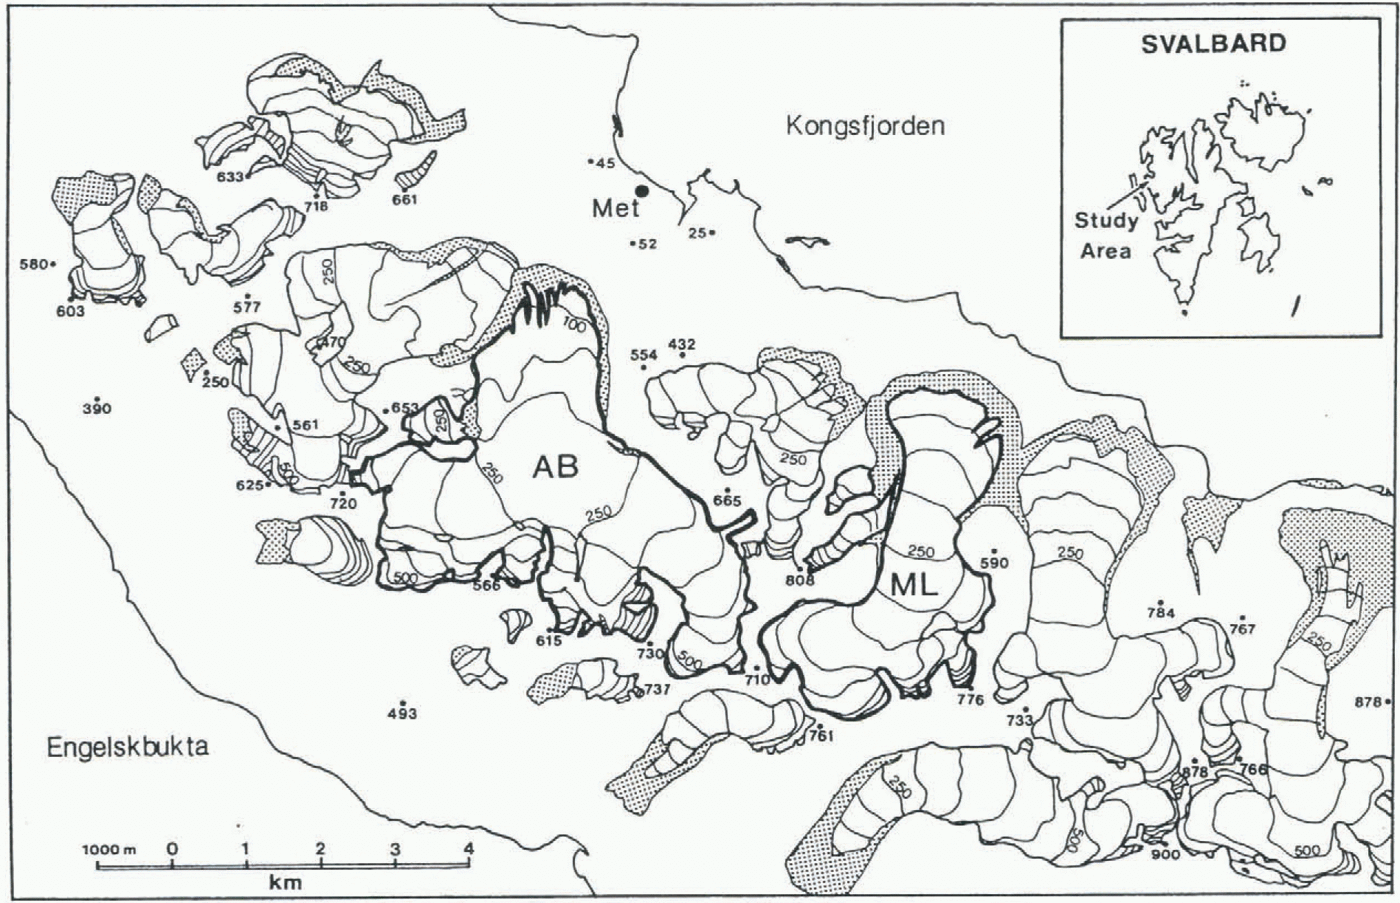
The aim of this paper is to model the mass balance of two Spitsbergen glaciers using an energy-balance approach in which the components of the surface energy balance are calculated (e.g. Oerlemans, 1988, 1991, 1992). The glaciers, Austre Brøggerbreen and Midre Lovénbreen in the Kongsfjorden area of northwest Spitsbergen (Fig. 1), are very suitable for such a study because systematic mass-balance observations have been made annually for more than 20 years and they are within 5–6 km of the meteorological station at Ny-Ålesund (Hagen and Liestøl, 1990). Mass-balance modelling is undertaken for three situations: (1) present-day climate (1980–89); (2) various predictions of greenhouse-induced global warming; and (3) the cooler climate of the Little Ice Age. Model results using modern meteorological data as input are first compared with observed mass-balance records for the two Spitsbergen glaciers. The model is then used to test the sensitivity of the glaciers to future and past changes in climate.
Study Area
The modelled glaciers
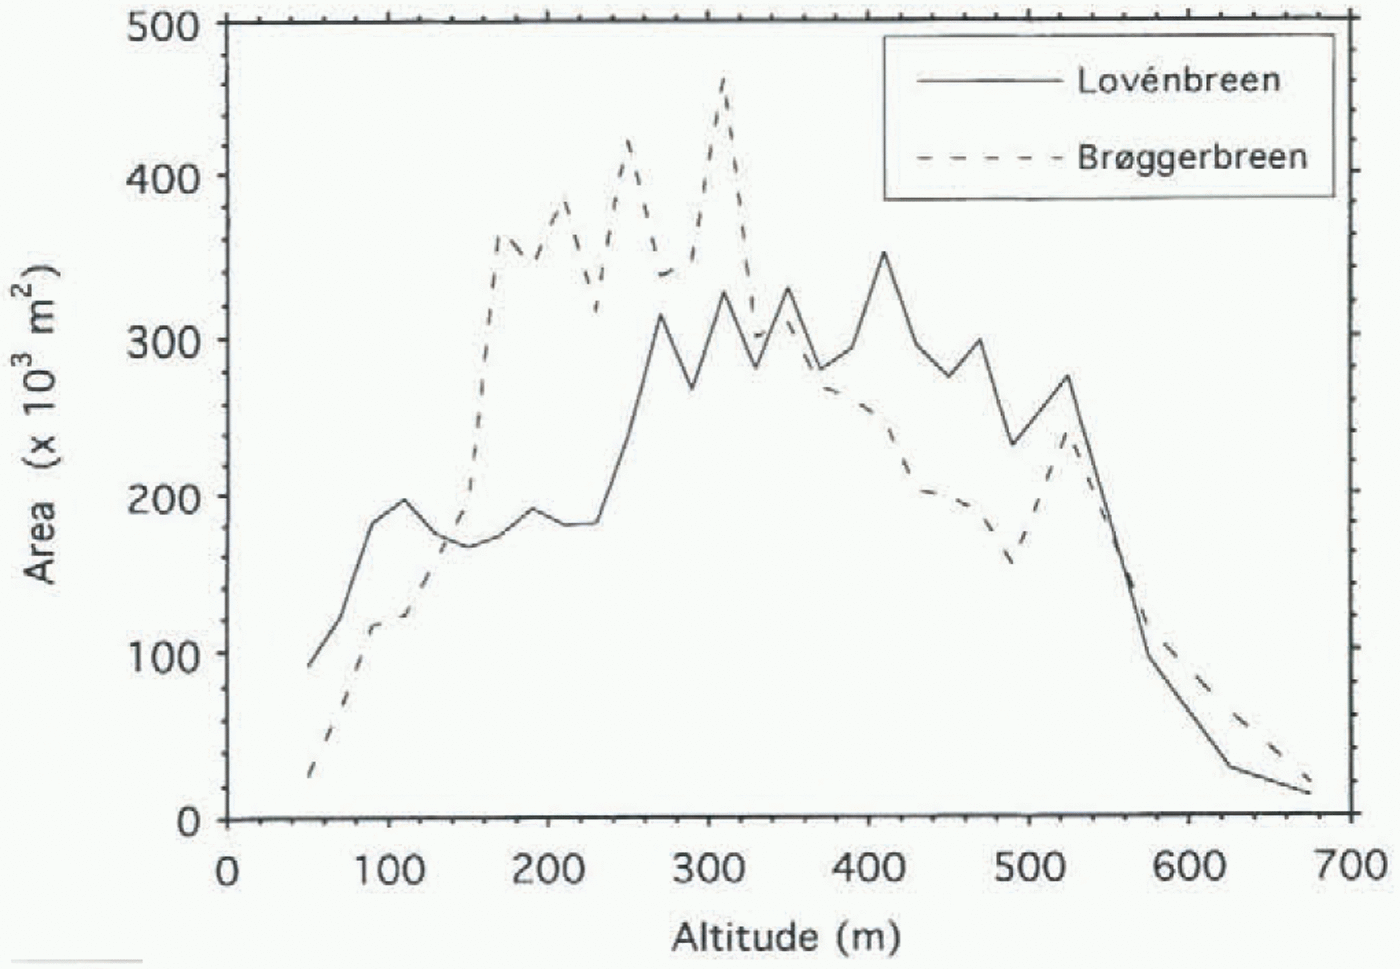
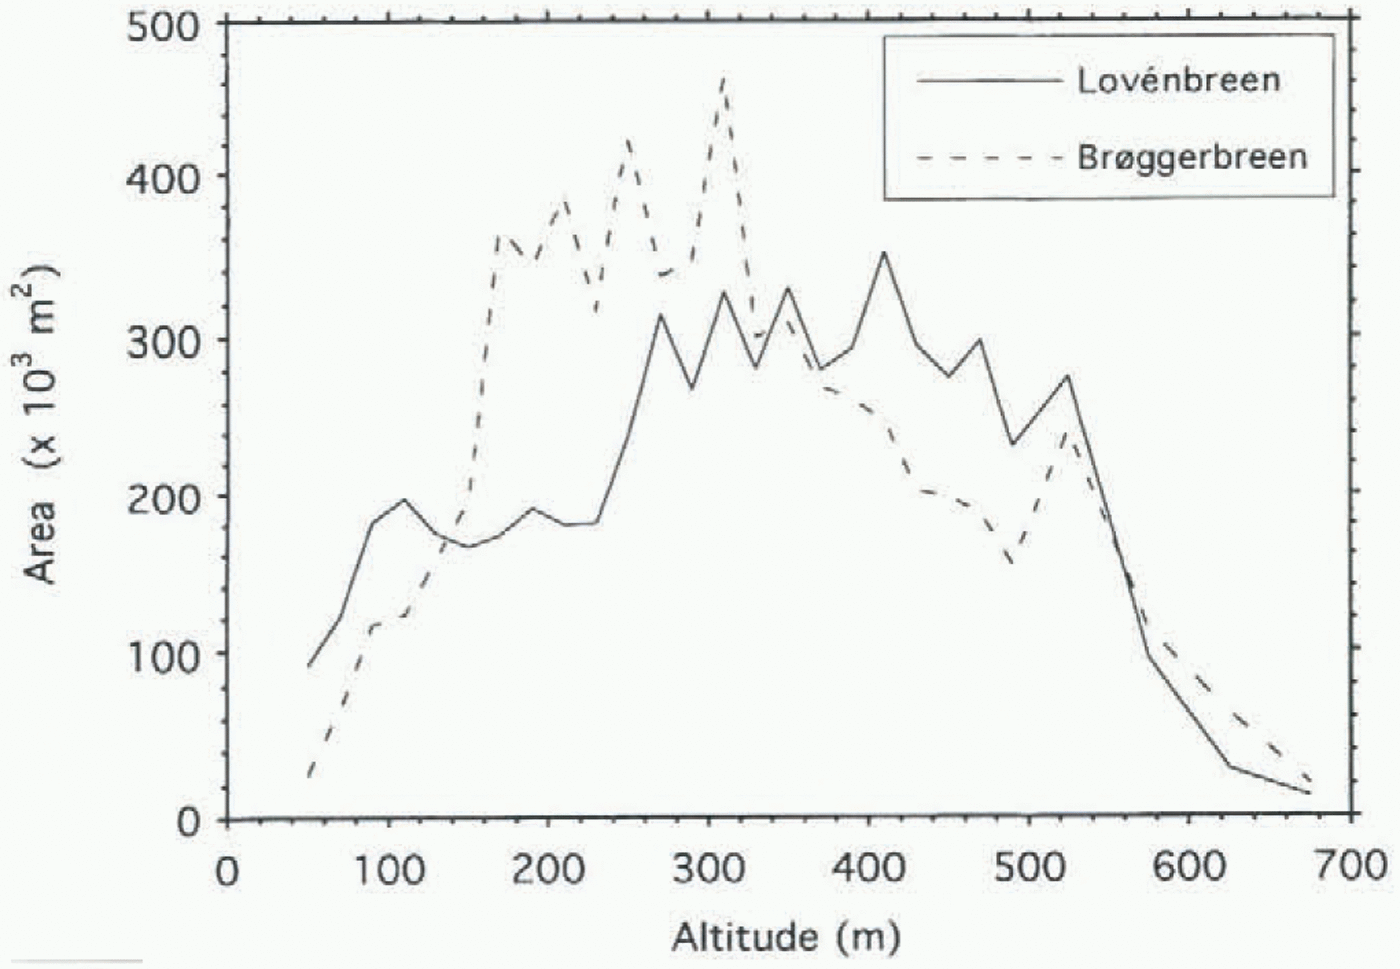
Austre Brøggerbreen and Midre Lovénbreen are small glaciers with areas of approximately 6 km2, located 3–5 km apart on the Brøggerhalvøya peninsula in northwest Spitsbergen (Fig. 1). A large body of glaciological information is available on these glaciers, including surface morphology, ice thickness measured by radio-echo sounding, and studies of their hydrological and thermal characteristics (e.g. Dowdeswell and others, 1984a, b; Liestøl, 1990; Hagen and Sætrang, 1991). Both glaciers span an altitudinal range between close to 0 and 700 m a.s.l., although neither actually reaches the adjacent fjord. The hypsometry of the two glaciers is somewhat different, Lovénbreen having a larger area at relatively higher elevations (Fig. 2).
Of particular significance for the present study is the long time series of mass-balance data that is available for
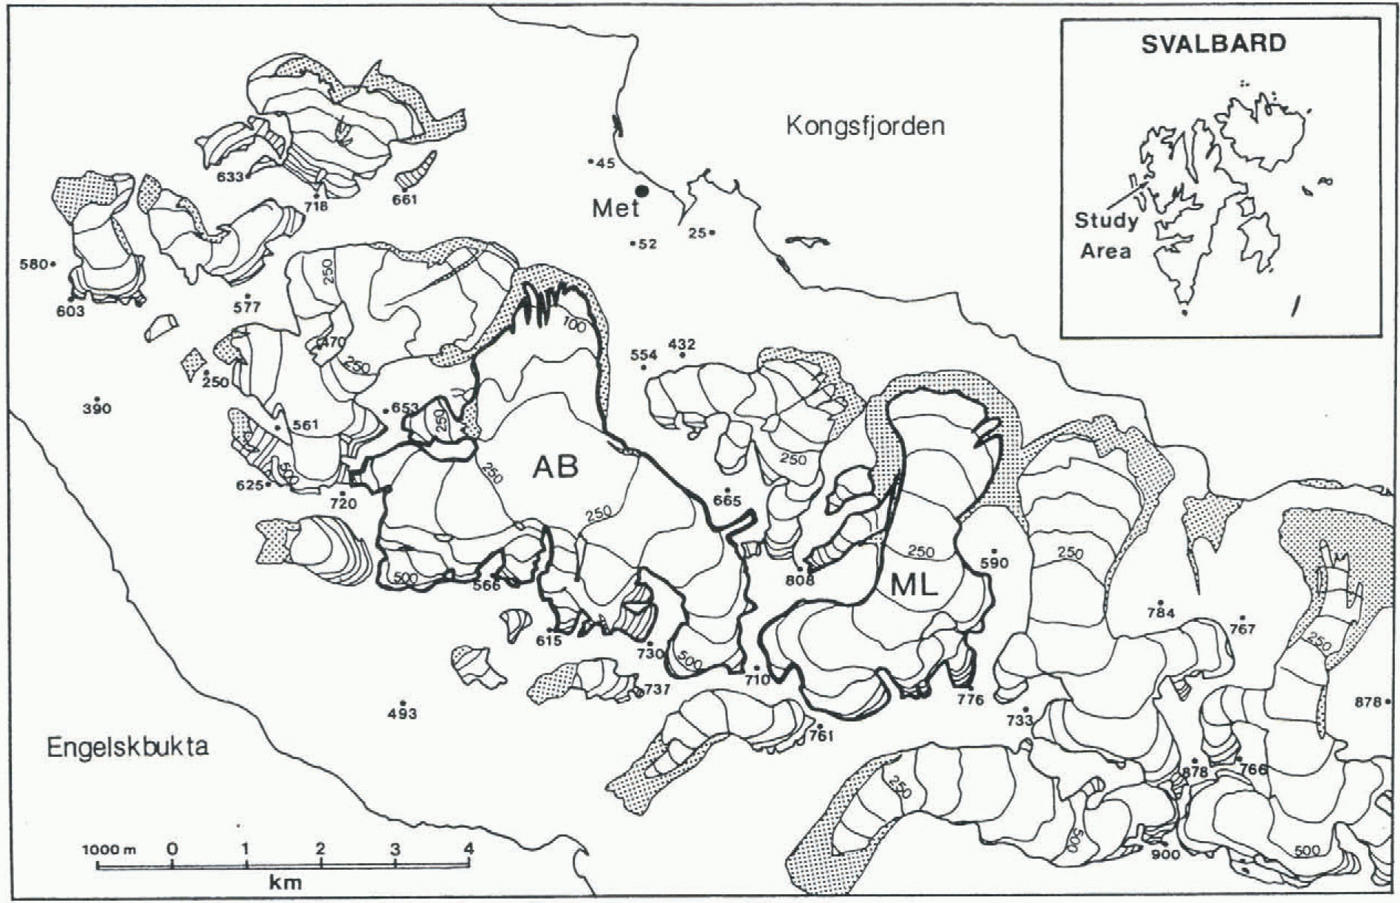
The Kongsfjorden area of northwest Spitsbergen showing the locations of Austre Brøggerbreen (AB) and Midre Lovénbreen (ML) and the weather station (Met.) at Ny-Ålesund. Glacier surface contours (50 m intervals) and spot heights are in metres. Shaded areas are moraine systems. The location of the study area within the Svalbard archipelago is inset.
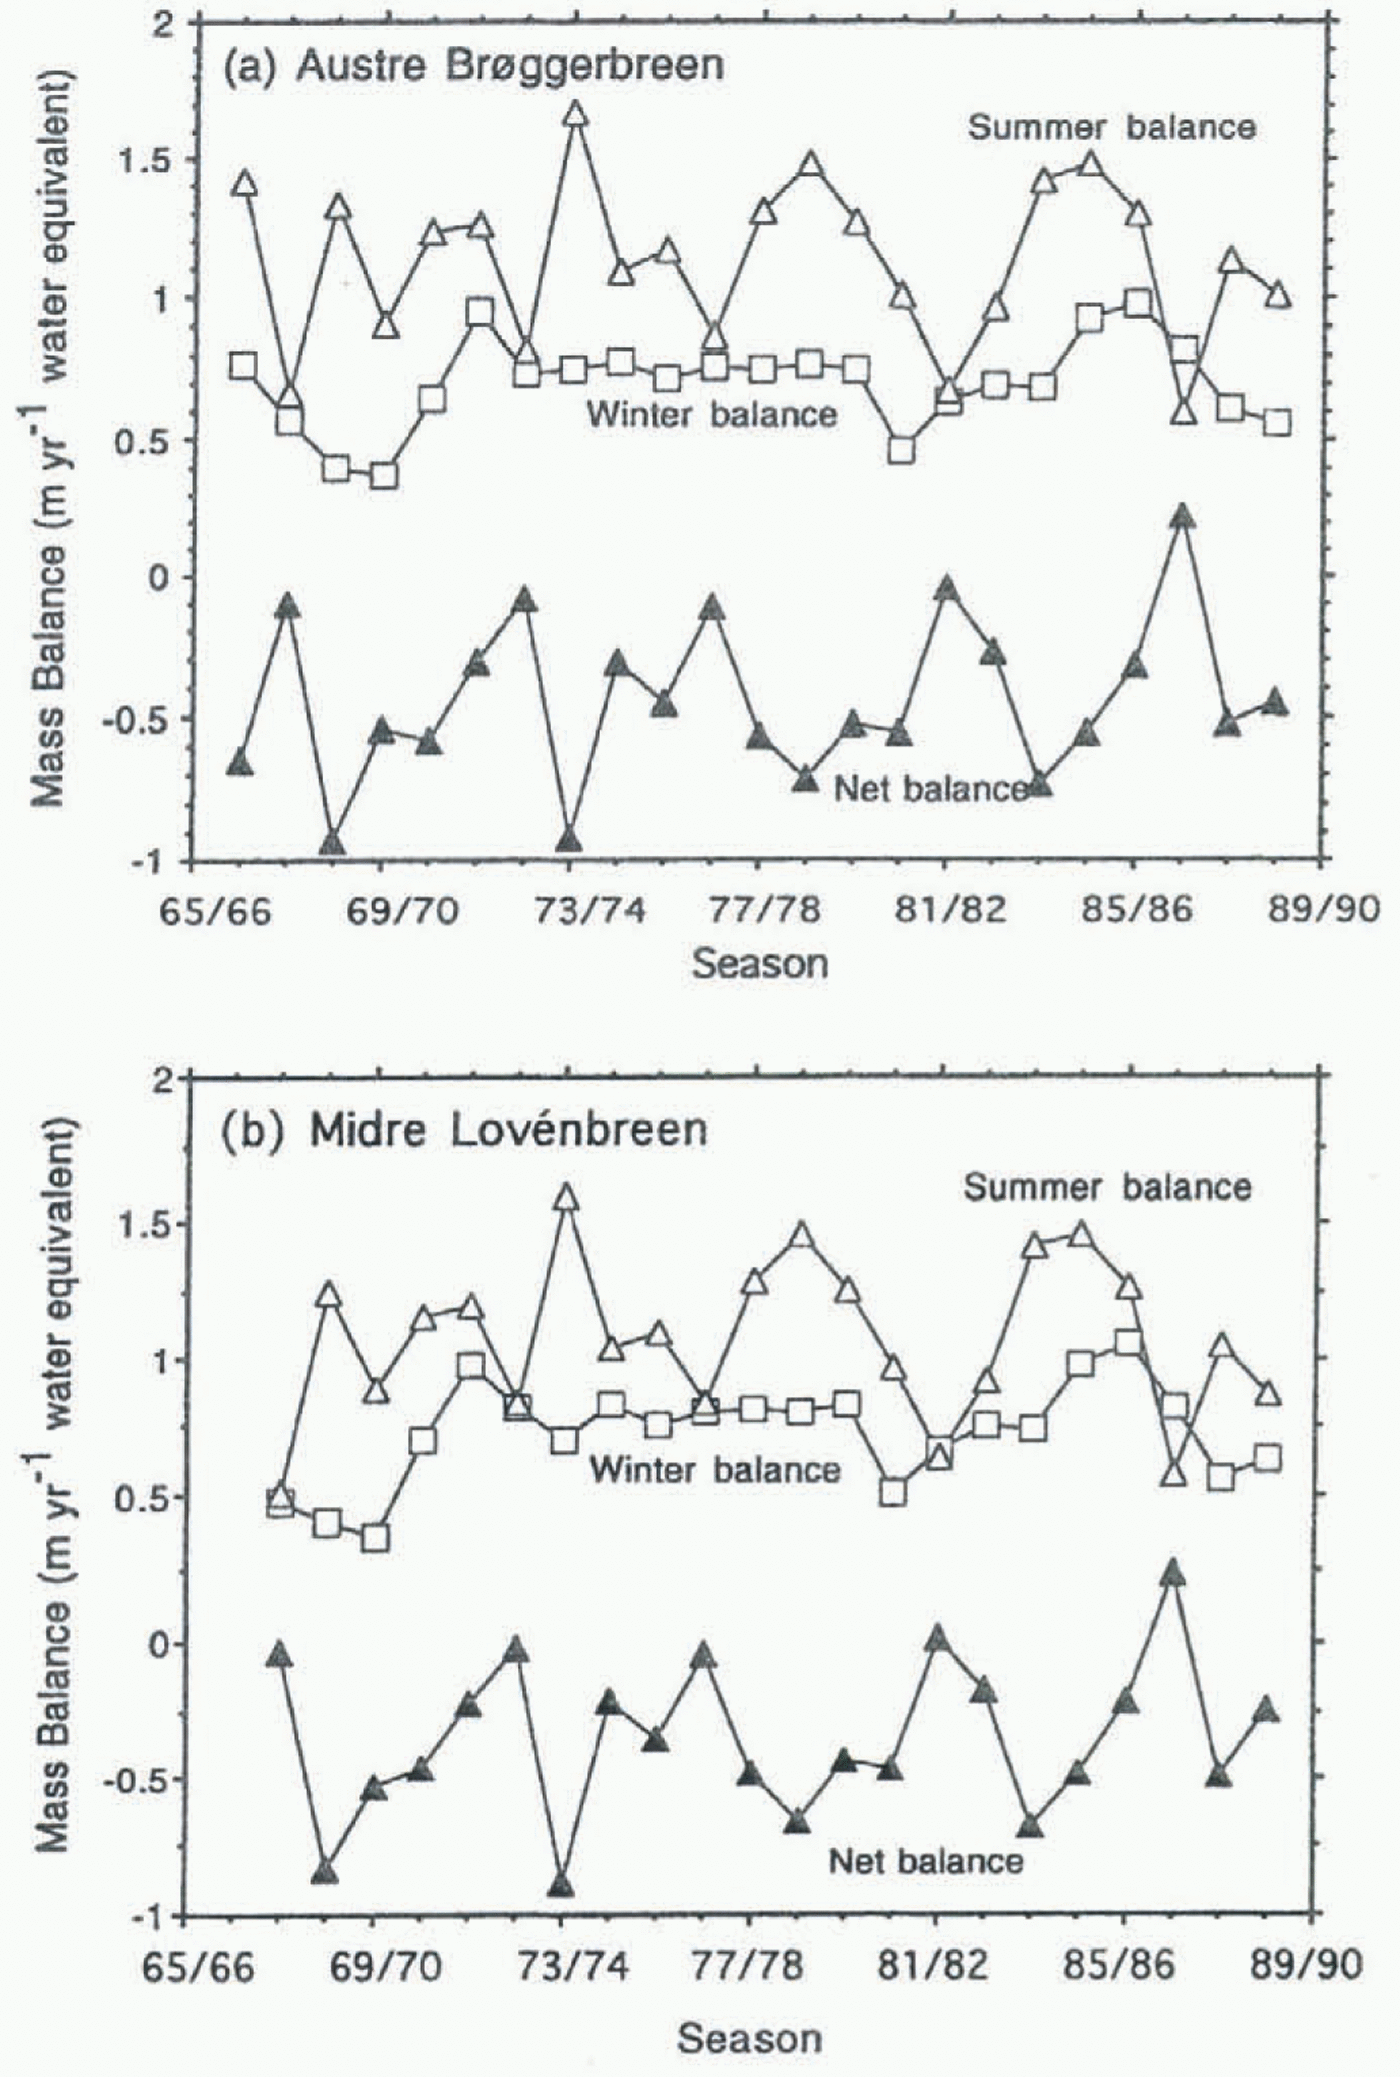
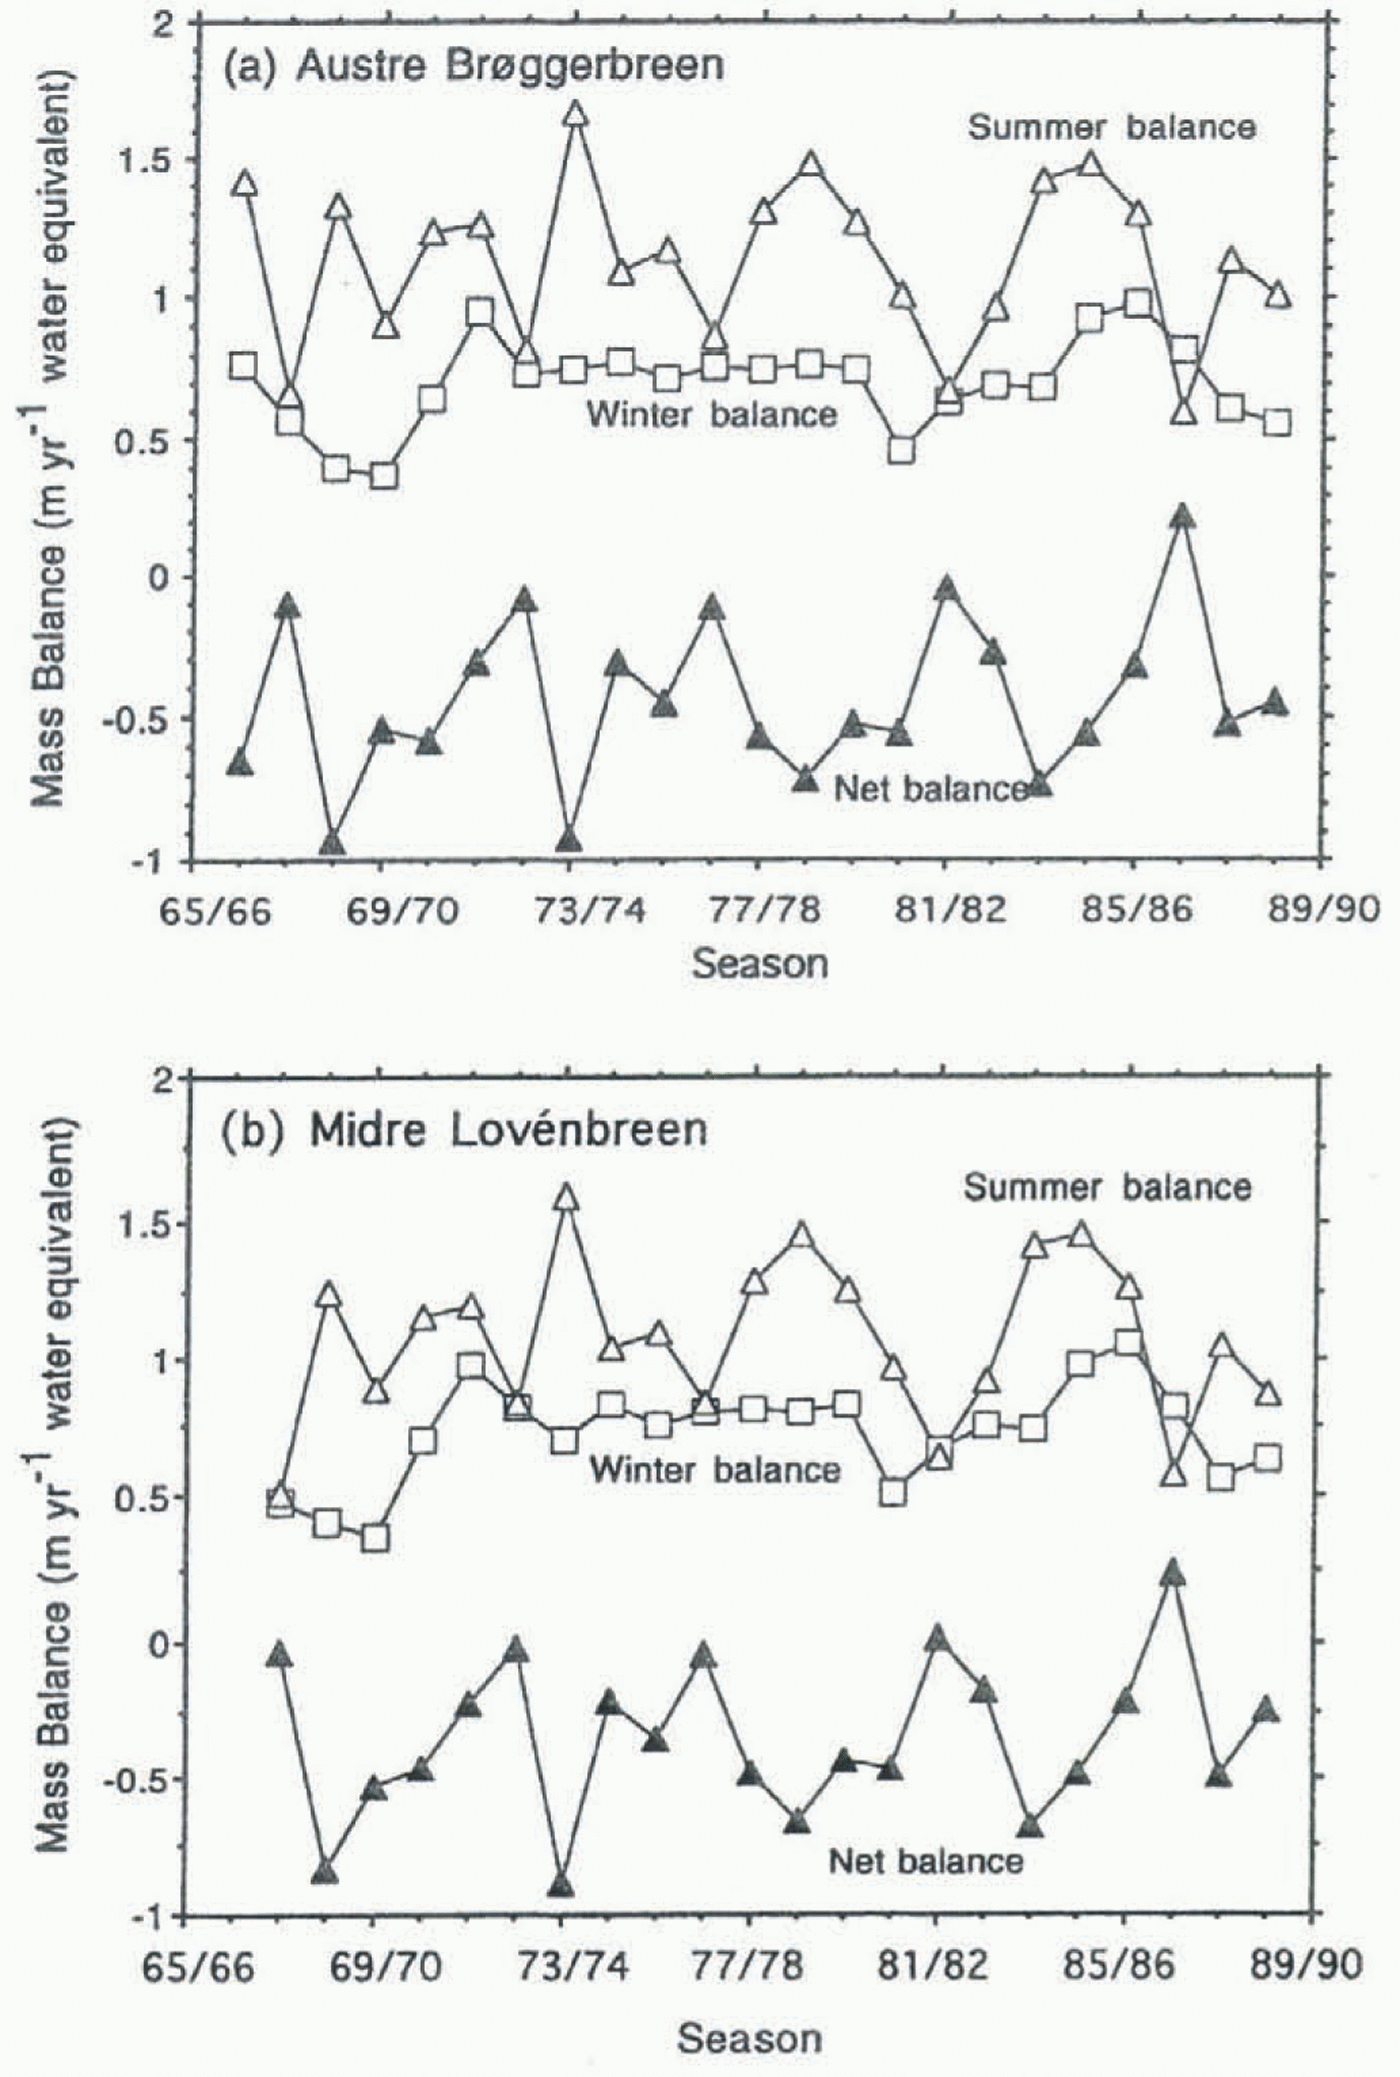
the two glaciers (Hagen and Liestøl, 1990; Lefauconnier and Hagen, 1990). Both glaciers have experienced consistently negative balances since measurements began in 1966–67 for Brøggerbreen and in the following year for Lovénbreen (Fig. 3). Brøggerbreen has experienced only one positive balance season (1986–87) and Lovénbreen two (1981–82 and 1986–87). Each follows a similar pattern of interannual variation in net balance, but Lovénbreen, probably because more of its area is at a higher altitude (Fig. 2), experiences the less negative balance of the two. There has been a trend towards less negative mass balances over the period of observations (Lefauconnier and Hagen, 1990). It should be noted that superimposed ice plays a significant role in the mass balance of the two glaciers, making up 10–30% of the total.
Hypsometric curves of variation of area with altitude for Austre Brøggerbreen and Midre Lovénbreen (data from Norsk Polarinstitutt, 1979).
Climate
Meteorological data have been measured continuously in the Kongsfjorden area since 1969, with irregular measurements since 1950 (Steffensen, 1982; Hanssen-Bauer and others, 1990). The mean annual temperature at Ny-Ålesund is –6°C, with annual precipitation of 0.2–0.3 m year–1 w.e. Mean monthly temperatures above zero occur from June to September, with an August value of 4.1°C at Ny-Ålesund (Fig. 1).
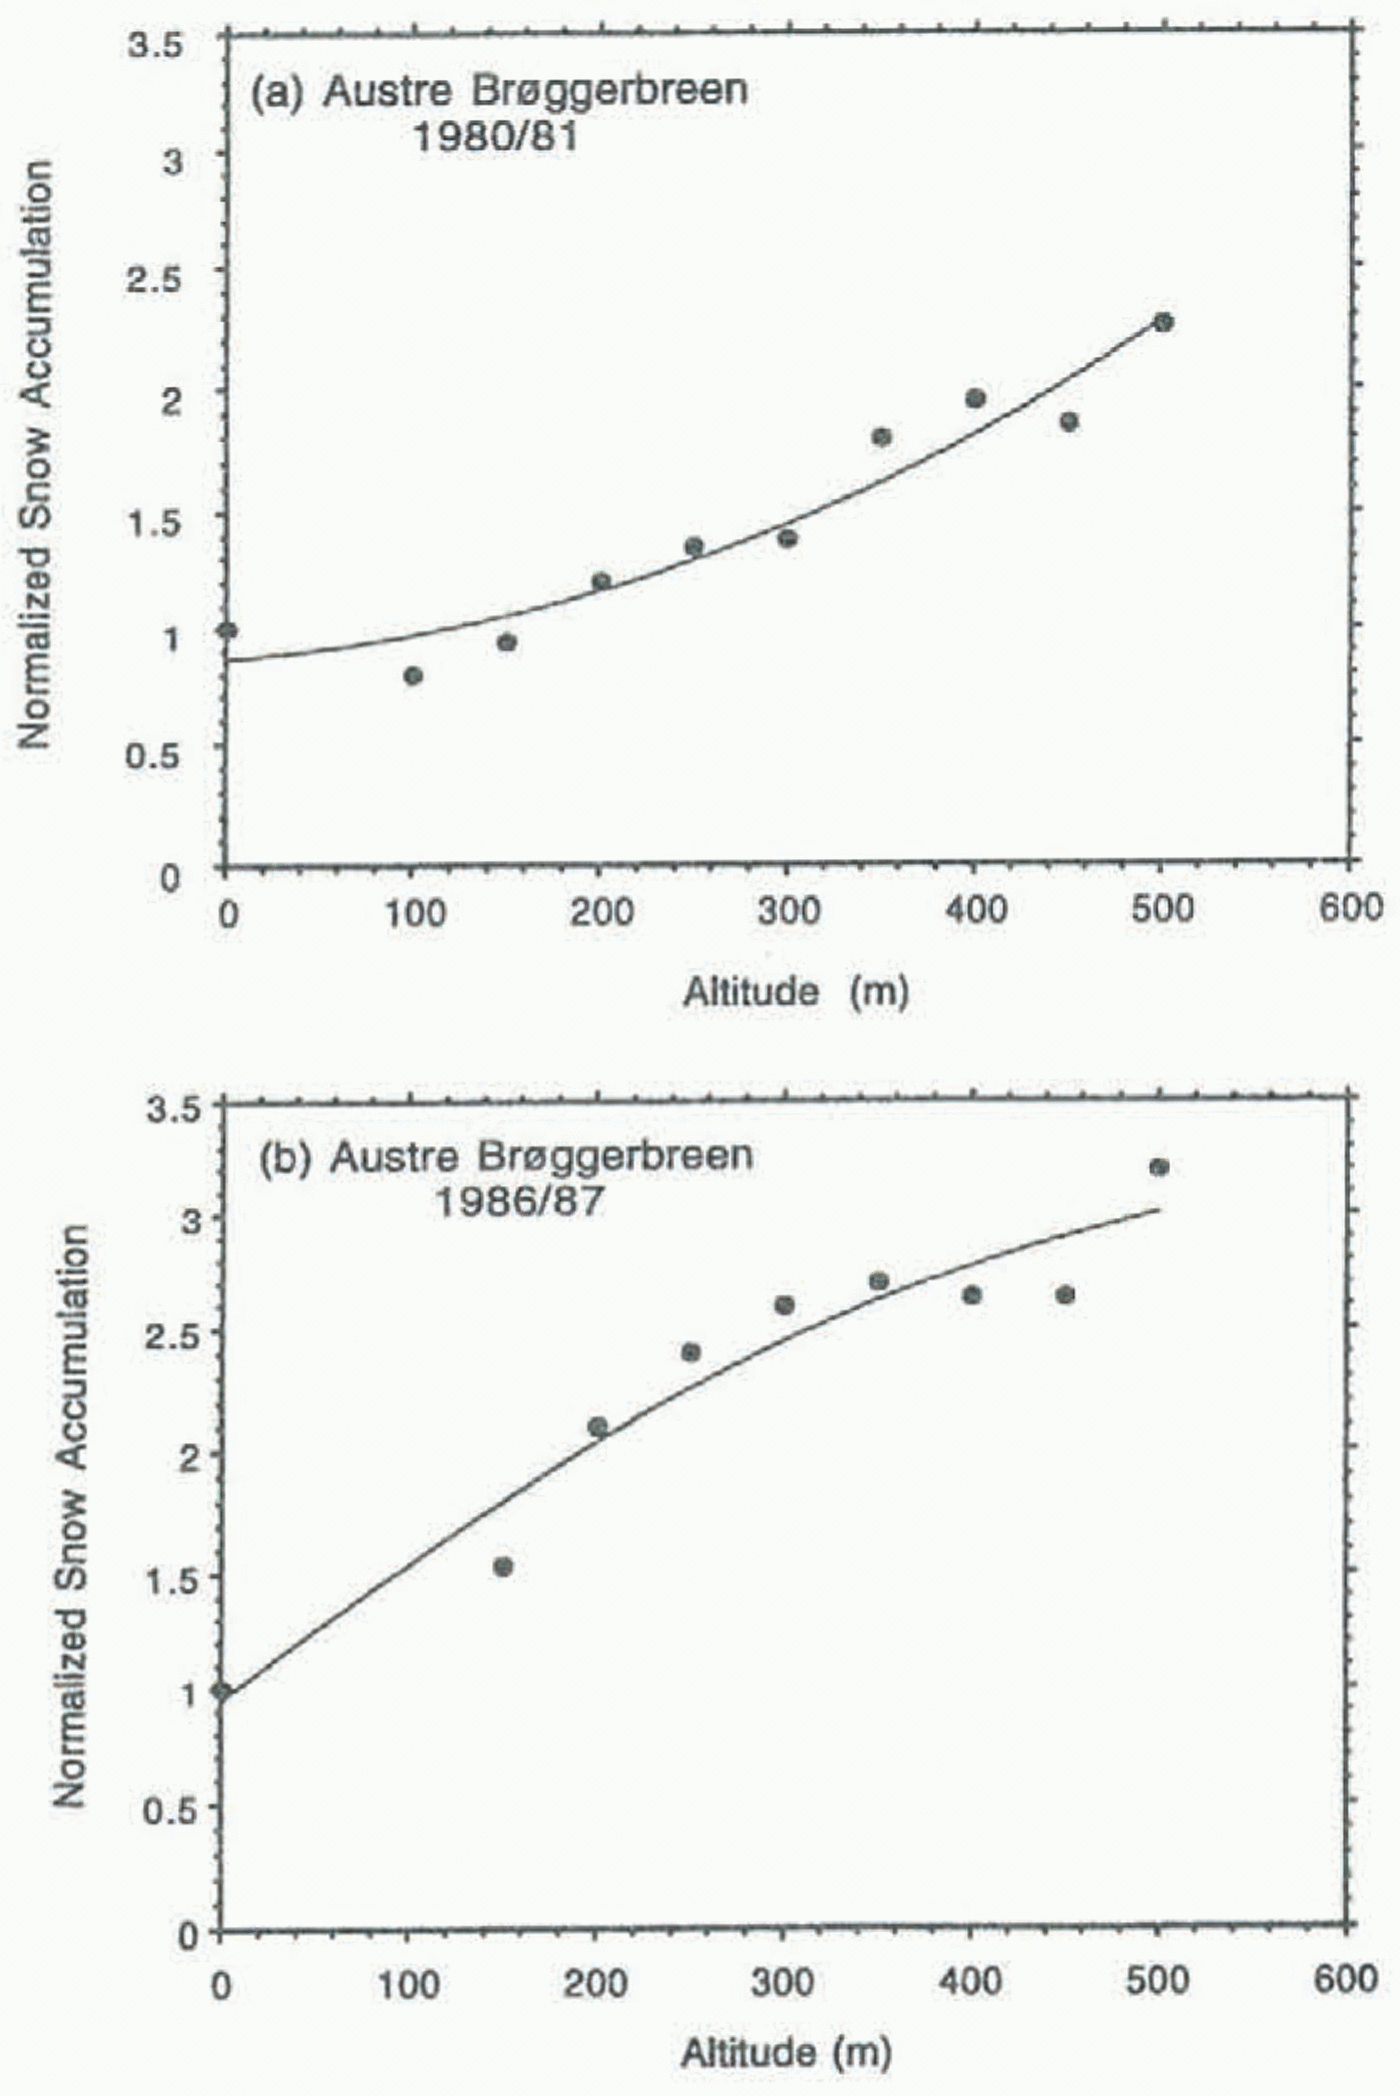
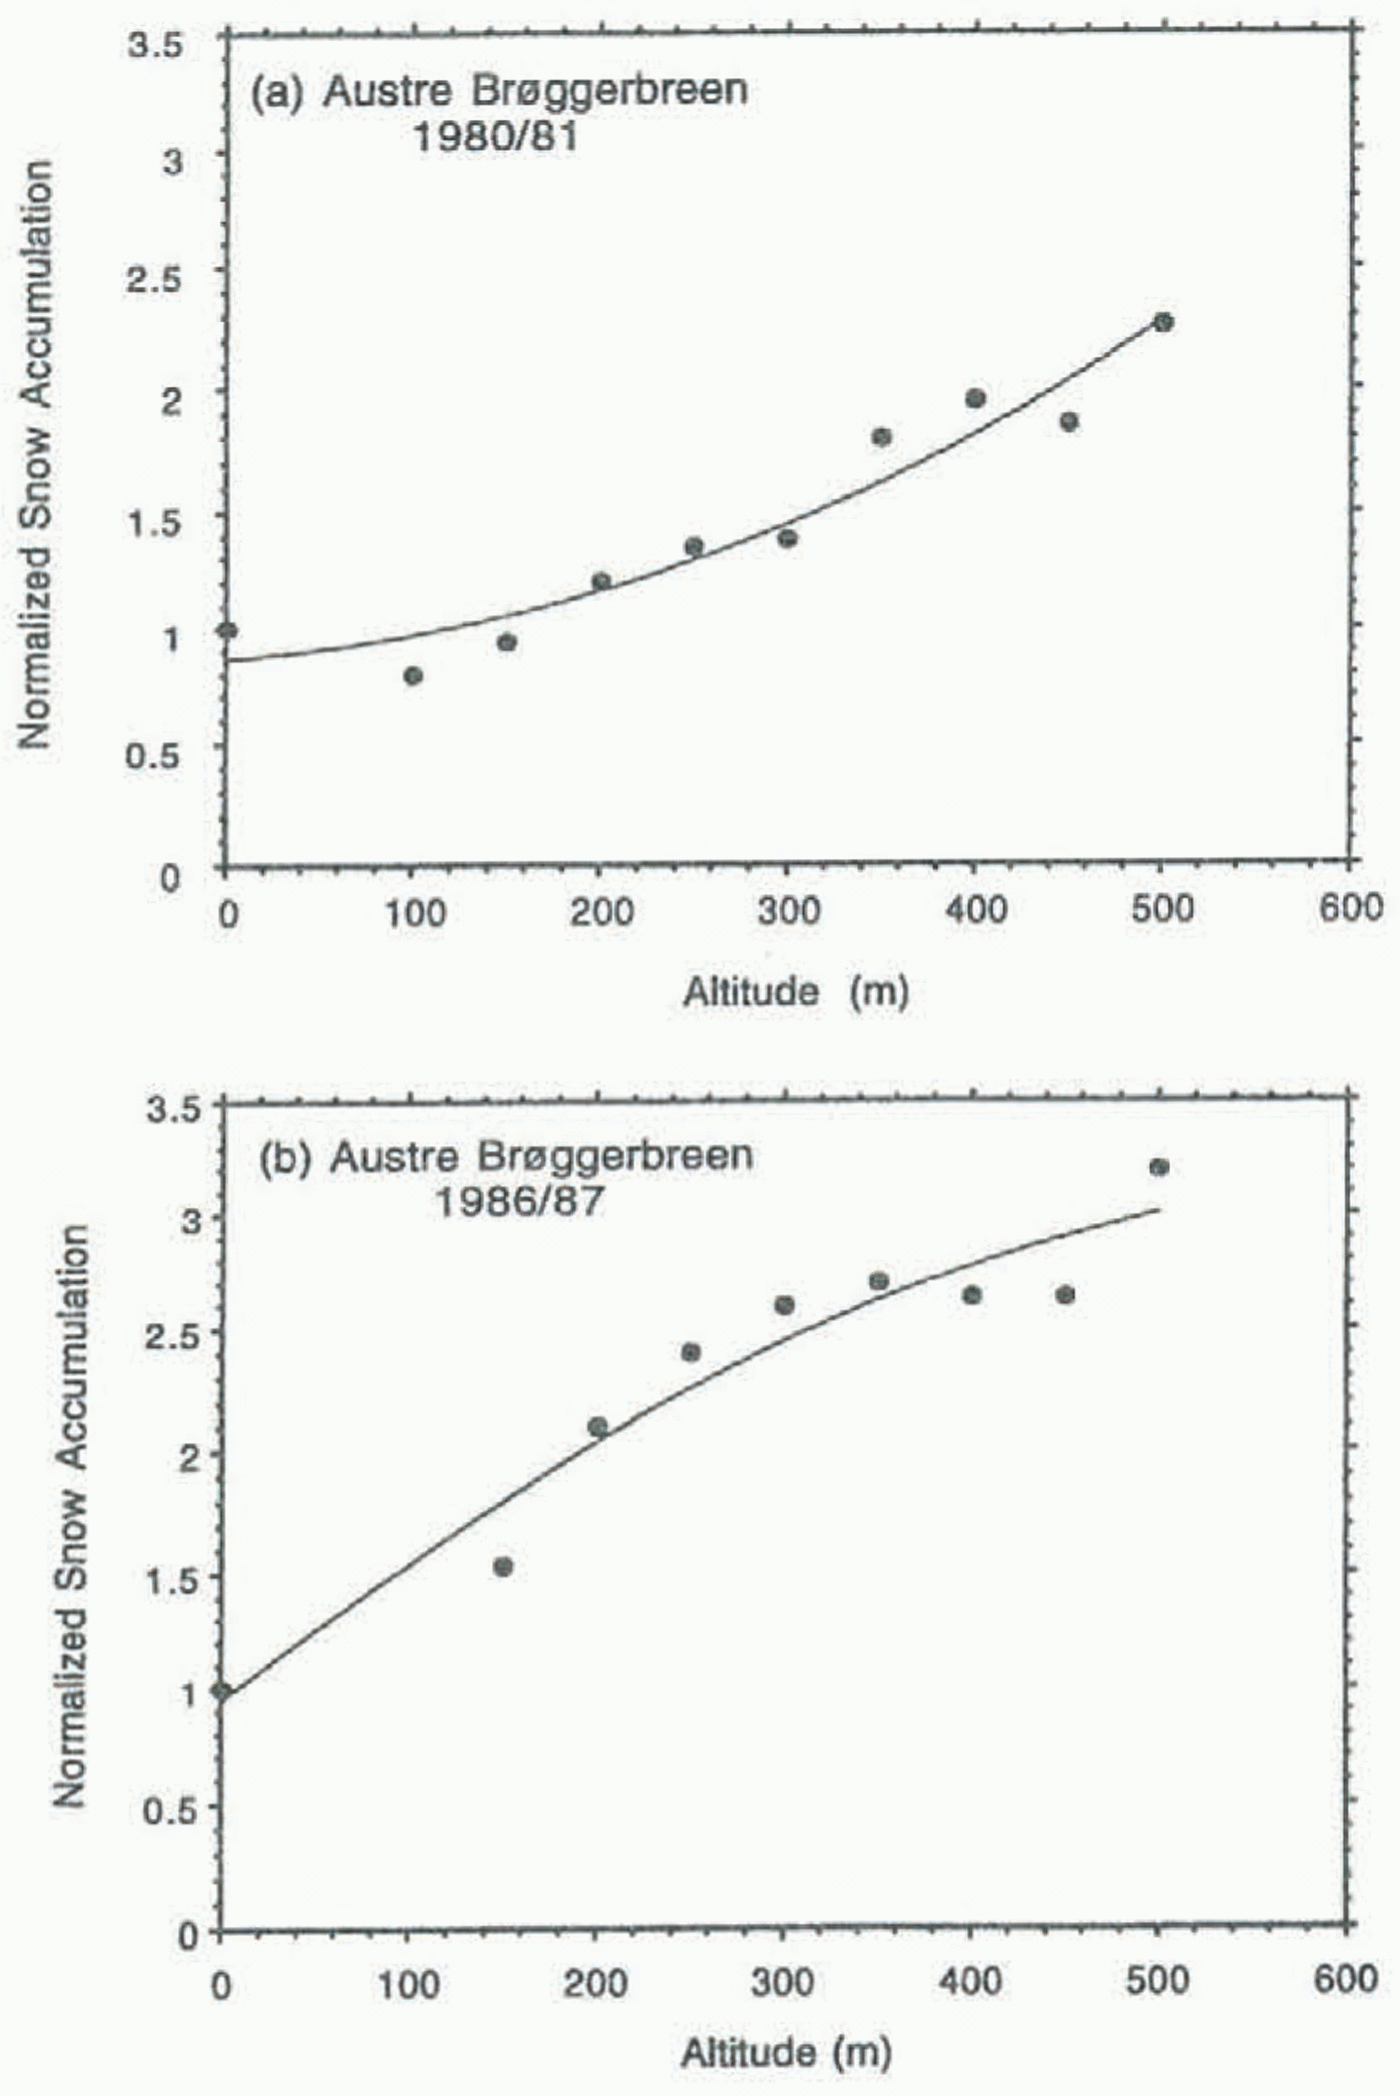
The ratio of precipitation between sea level (the Ny-Ålesund weather station) and the highest regions of the glaciers (approximately 700 m) is of the order of 1:3 (Liestøl, 1990). Hagen and Liesløl (1990) found that there is a relatively poor correlation (0.63) between winter precipitation (September–June) measured at Ny-Ålesund and snow accumulation over the whole glacier, because much of the accumulation over the glacier is associated with winds and snowdrifts. The variation of precipitation with altitude is accommodated by fitting a second-order polynomial to the observed values of snowfall with altitude (Liestøl, 1982, 1983, 1986; Hagen and Liestøl, 1987; Hagen, 1988). Examples are shown in Figure 4 for Austre Brøggerbreen in seasons 1980–81 and 1986–87, values being normalised with respect to data from Ny-Ålesund. Correlations of 0.95–0.99 between the fitted curve and the normalised data were obtained using this method.
Energy-Balance Modelling Of Glacier Mass Balances
The model
The energy-balance model is similar to that used in Oerlemans (1988, 1991, 1992). This model calculates the components
The winter, summer and net mass balances over the period (a) 1965–66 to 1989–90 for Austre Broggerbreen and (b) 1966–67 to 1989–90 for Midre lovénbreen (from Liesløl, 1990; personal communication from J. O. Hagen).
of the surface energy balance. It takes meteorological data, the area distribution with altitude of the ice mass, and parameters defining the global radiation as input values. The model has also been applied to the calculation of mass balances for glaciers in the Austrian Alps and in southern Norway (Oerlemans and Hoogendoorn, 1989; Oerlemans, 1992), and to the Greenland ice sheet (Oerlemans, 1991). As the model has been described in detail in Oerlemans (1992), only a brief summary will be given here. The mass balance of a glacier surface may be expressed as:

where M is the annual mass balance, f is the fraction of meltwater that refreezes instead of running off, B is the energy balance of the surface, L is the latent heat of melting, and P is the rate of precipitation in solid form. The term f is calculated using the ice-firn temperature in spring, which we approximate as the mean annual temperature. Surface layers at this temperature are then warmed through refreezing and latent heat release in the model.
The energy exchange between the atmosphere and the glacier surface is found from:

where a is the surface albedo, Q is the short-wave radiation reaching the surface, I in and I out are the incoming and outgoing long-wave radiations, and Fs and Fl are the sensible
Variations in snowfall with altitude for Austre Brøggerbreen in the seasons (a) 1980–81 and (b) 1986–87 (data from Liestøl, 1982; Hagen, 1988). Curves are second-order polynomials fitted to the data points.
and latent heat fluxes. The energy budget is thus divided into several components: solar radiation, long-wave radiation, turbulent energy fluxes and the refreezing of melt-water. The latent heat flux term is set to zero because of insufficient evidence on humidity over the glacier.
The solar radiation reaching the top of the atmosphere is found using the method of Walraven (1978). This radiation is then attenuated by absorption and scattering. Cloudiness, solar zenith angle and surface elevation are accounted for. However, the geometry of the glacier surface is not. Surface albedo is generated internally and is dependent upon the presence of snow, distance to the equilibrium line and the accumulated melt during the ablation season.
The long-wave component of the energy equation is divided between the outgoing radiation from the glacier surface and that incoming from the atmosphere. Outgoing radiation is set to a value of 316 W m–2, that emitted by a black body at the melting point. The atmospheric long-wave radiation is in two parts: the contribution from a clear sky and that from clouds. The incoming radiation is calculated using the formulation of Kimball and others (1982). The radiation coming from clouds is transmitted in the 8–14 μm spectral band. Turbulent fluxes are proportional to the difference between the air and surface temperatures and humidity. The percolation and refreezing of meltwater is incorporated into Equation (1) of the model because, in Svalbard, superimposed ice contributes on the order of 10% to the annual accumulation (Hagen and Liestøl, 1990).
Nature of input meteorological data
There are three methods by which the required meteorological parameters may be applied to the model: (i) the use of
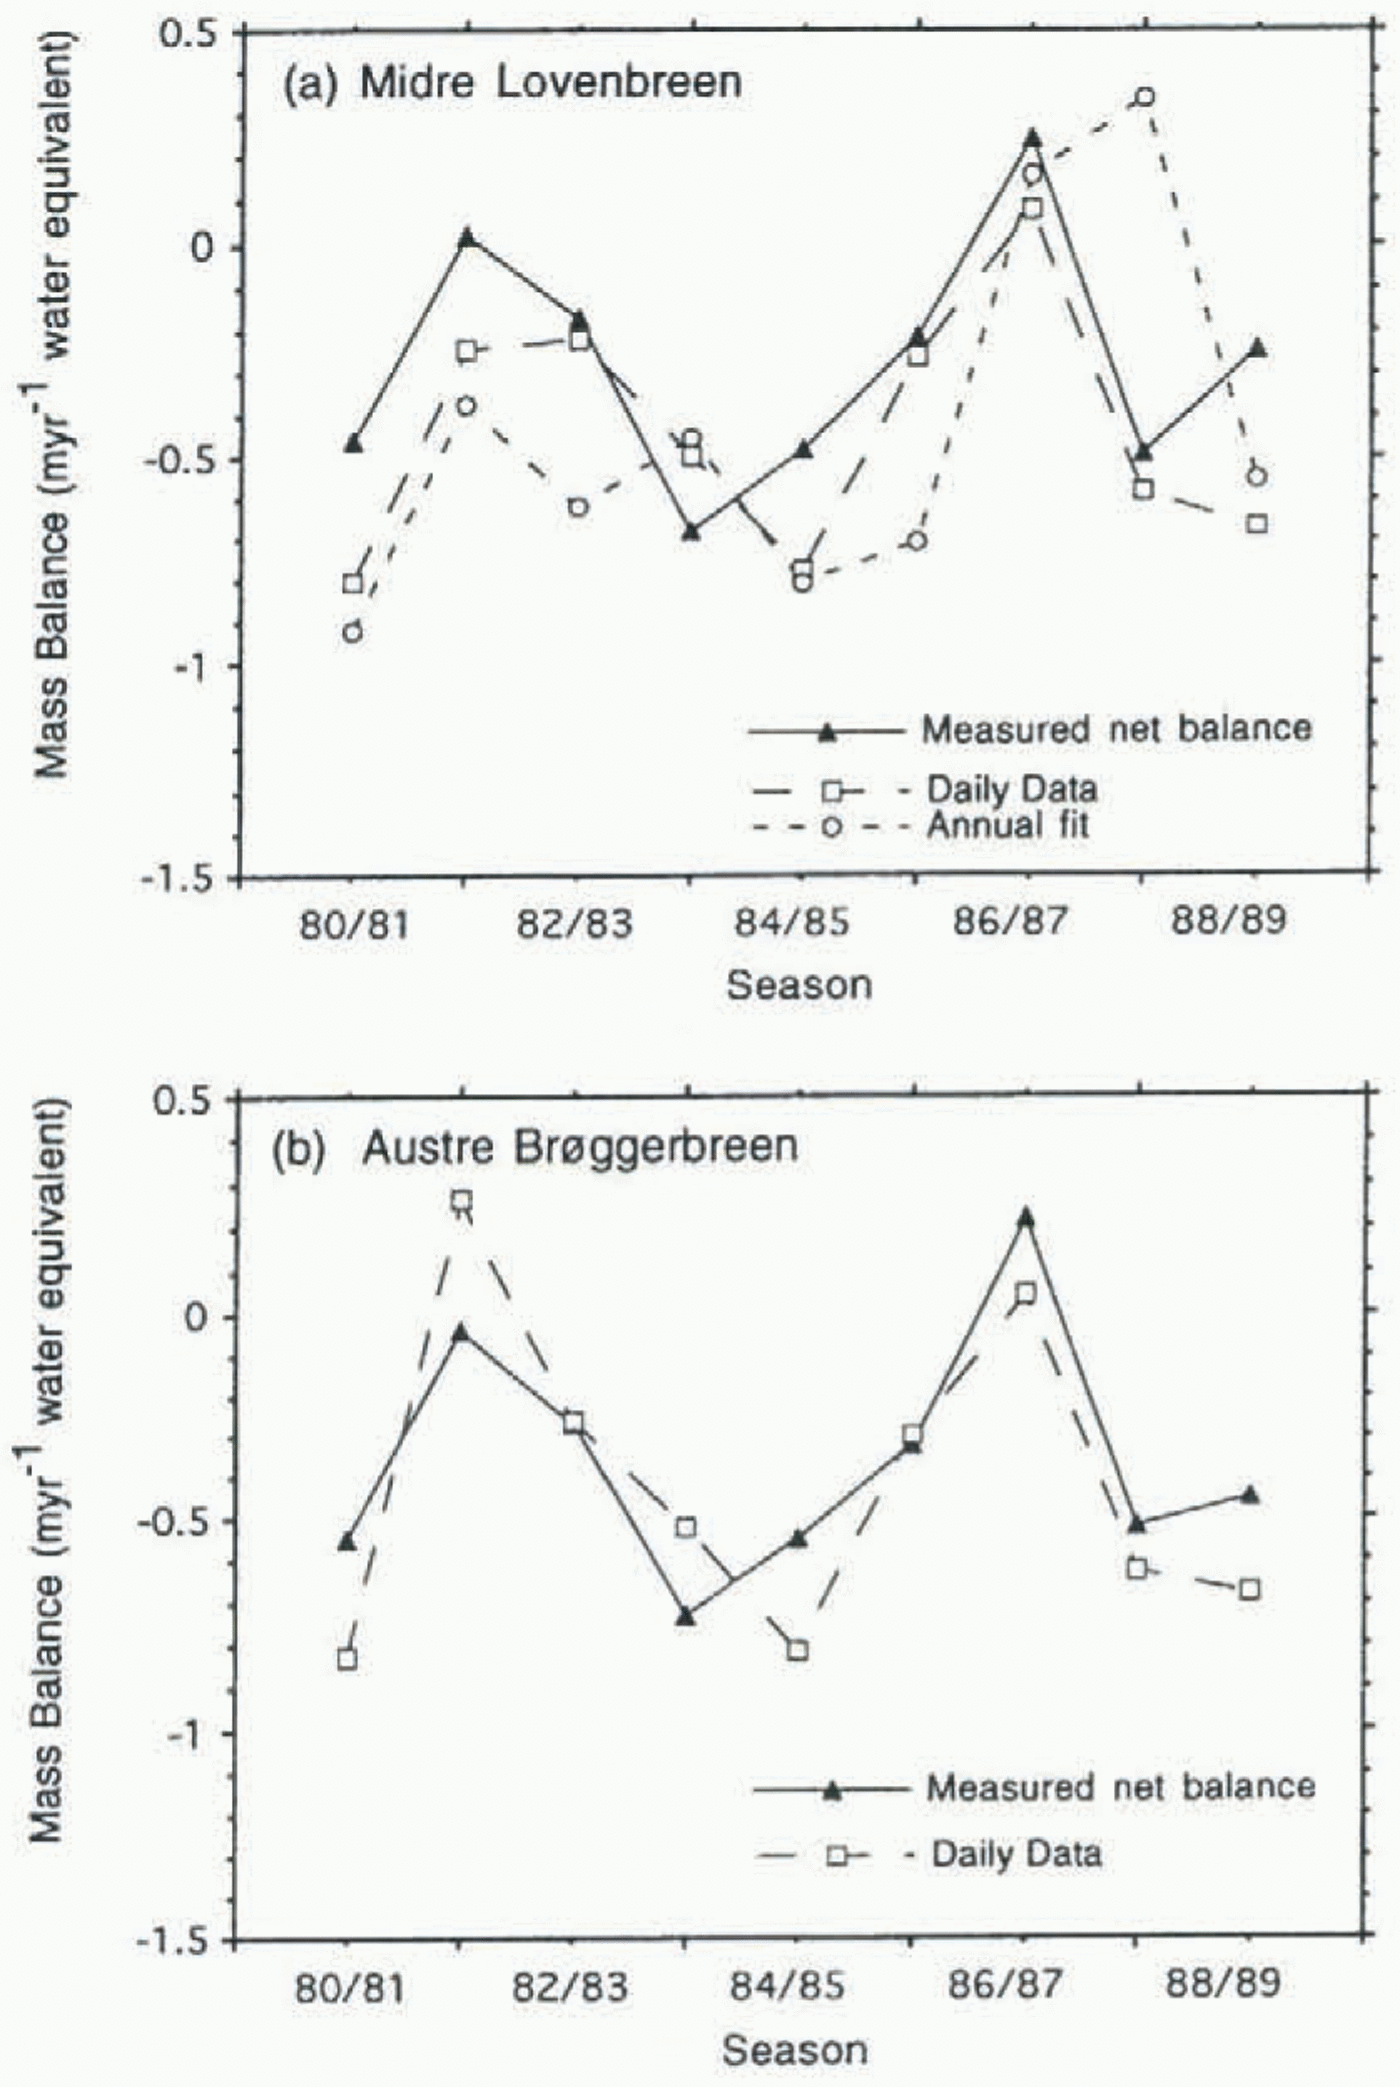
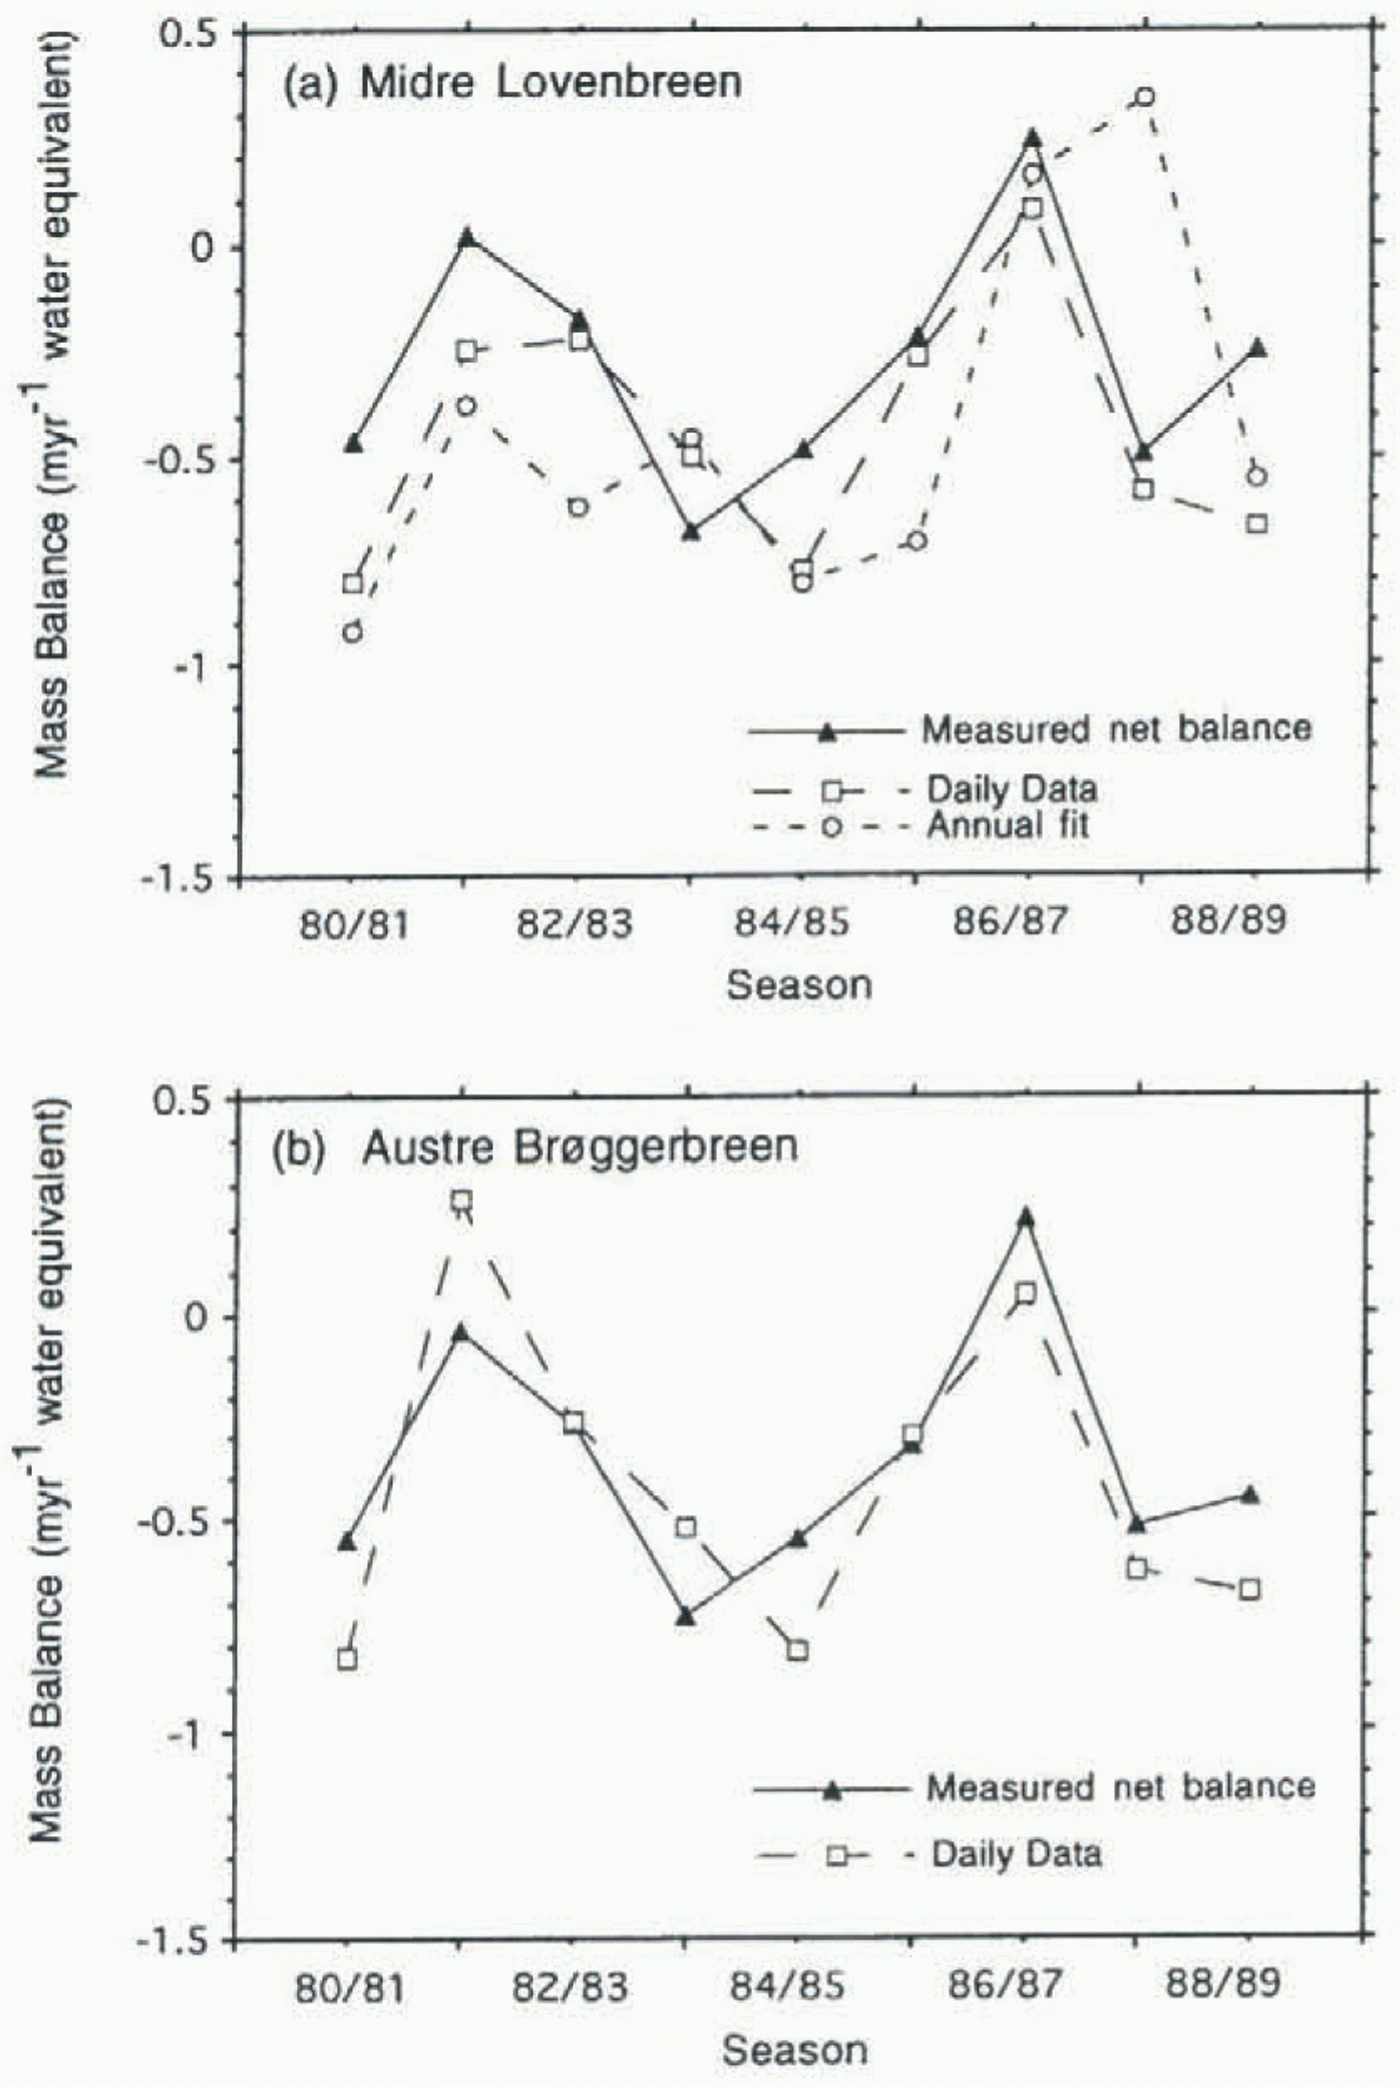
Measured and modelled mass-balance profiles for the period 1980–89: (a) Midre Lovénbreen; (b) Austre Brøggerbreen. The two modelled curves in (a) are obtained using daily meteorological parameters and the annual method of defining meteorological parameters. In (b) modelled results use the daily meteorological data from the Ny-Ålesund weather station.
long-term climate data (the global method); (ii) annual fils to measured data (annual method); (iii) daily inputs. The annual method has often been used (Oerlemans, 1991, 1992). This requires the annual temperature cycle to be expressed as a sinusoidal function. Precipitation is defined as constant throughout the year, with rain or snow every second day. Precipitation is assumed to fall as snow when the daily average temperature is below 2°C, and as rain above that value. All rainfall is assumed to rim off. Humidity and cloudiness are constant throughout the year, and set to the average annual value. The annual method is often adopted because daily meteorological data are either absent or only available from stations remote from the glaciers being modelled.
An alternative procedure is to use measured mean daily values for the meteorological parameters. We are able to take this approach because of the proximity of the Ny-Ålesund meteorological station to the glaciers being modelled (Fig. 1). We are therefore able to compare the results of energy-balance modelling using both annual fits to the meteorological data and observed daily values. In addition, we can compare both sets of mass-balance results, generated by energy-balance modelling, with the observed mass-balance data from the two glaciers.
Modelling Modern Glacier Mass Balance In Spitsbergen
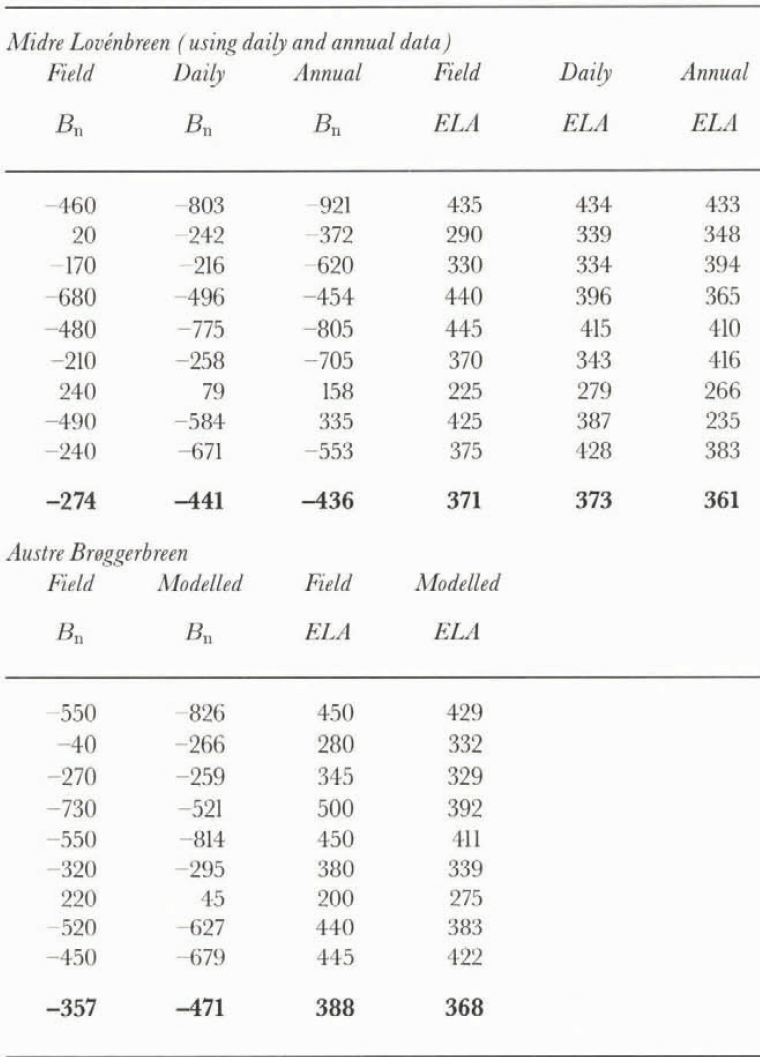
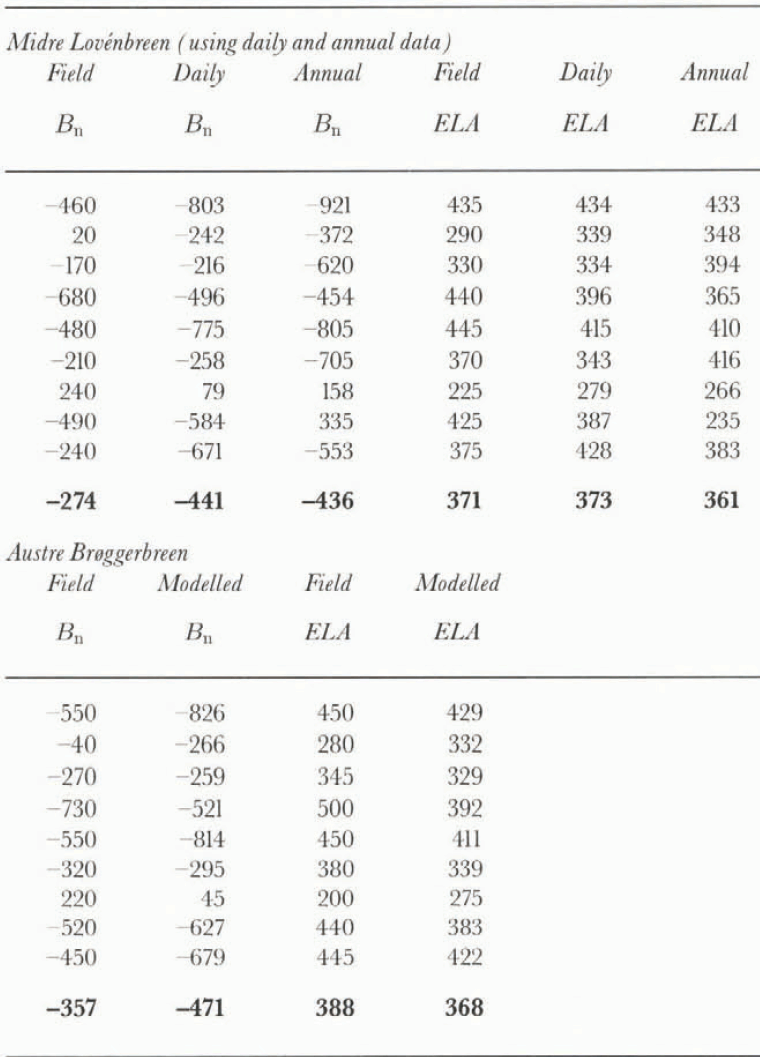
Results from modelling the net mass balances (Bn in mm year–1 w.e.) and EL
This section deals with modelling the mass balance of glaciers of interest for present-day climatic conditions. Before this was done, a standard or reference climate was produced. This reference was found by determining the daily average values of the meteorological parameters for the period 1980–89. The altitudinal variations in precipitation for each glacier were found from the average precipitation with altitude for the years when these data were available (1980–81, 1981–82, 1983–84 and 1985–86).
Next, the mass-balance model was tuned, such that it gave the average mass balance for the decade 1980–89 using the reference climate. Two models were produced, one for each glacier. It was these models which were used to calculate the annual mass balance. Several sets of comparisons can be made. First, the results of energy-balance modelling of mass balance simulate the observed mass balance of the two glaciers with reasonable accuracy (Fig. 5). Mean observed net mass balance for the period 1980–89 is –0.36 m for Brøggerbreen and –0.27 m for Lovénbreen. Calculated values are –0.47 and –0.44 m, respectively. The pattern of the observed net mass-balance curves over the nine balance years is also reproduced (Fig. 5). For equilibrium-line altitude (ELA), field measurements record mean elevations of 388 m for Brøggerbreen and 371 m for Lovénbreen. The corresponding calculations yield means of 368 and 373 m, respectively (table 1). Calculated ELAs for individual years deviate from field observations by a mean of 48 m for Austre Brøggerbreen and 37 m for Midre Lovénbreen (table 1).
Secondly, the calculations of mass balance using daily averages simulate the observed data more closely than do
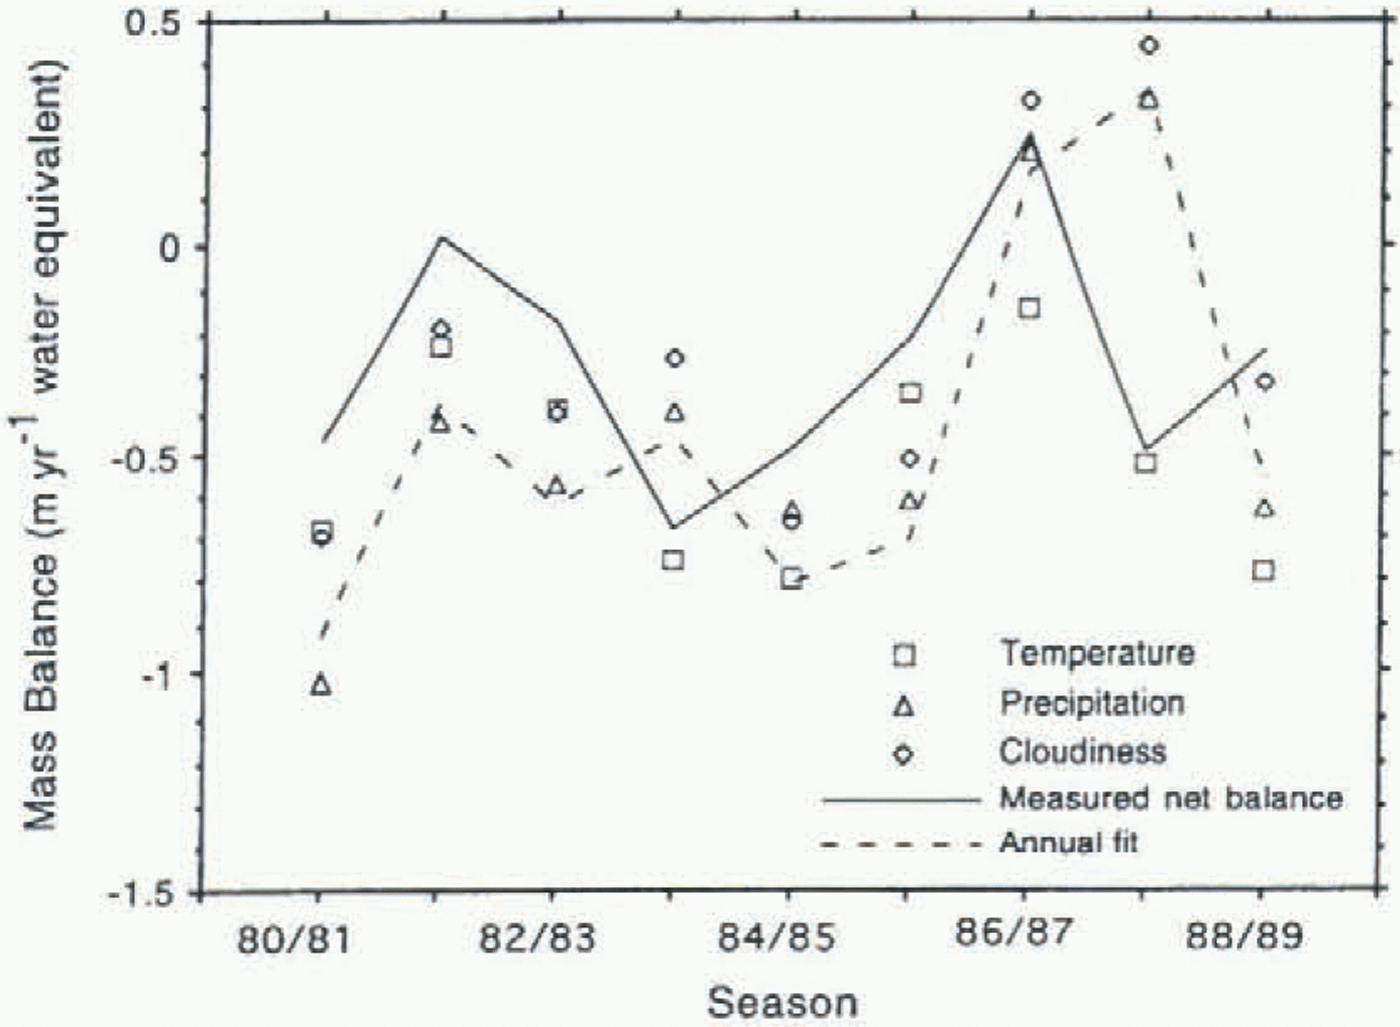
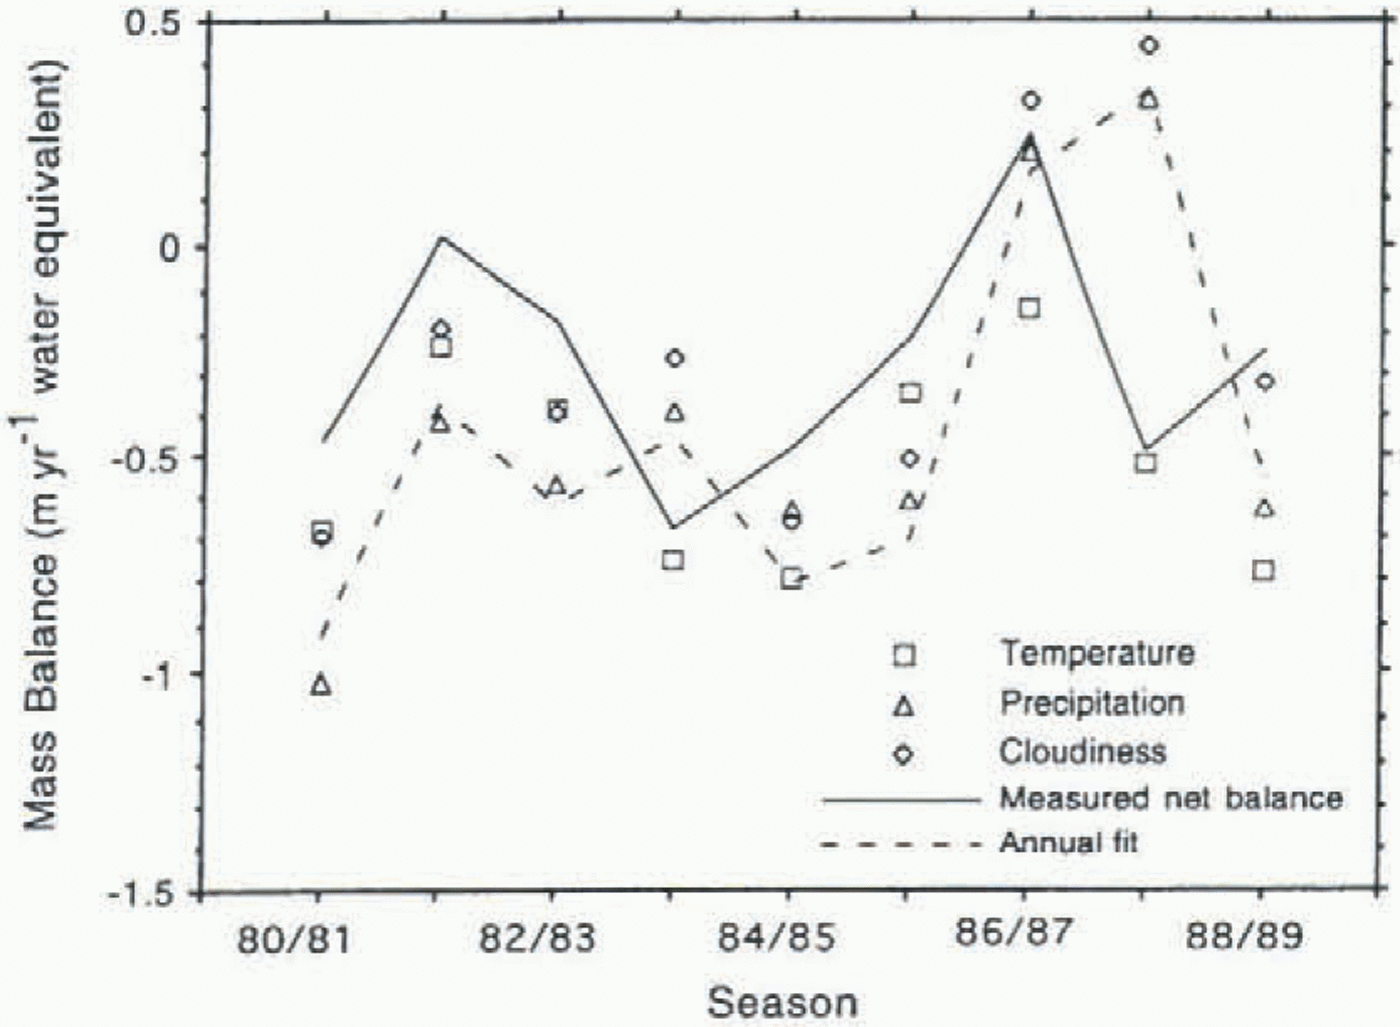
Modelled mass-balance profiles for Midre Lovénbreen over the period 1980–89. The effect of introducing measured daily meteorological data from Ny-Ǻlesund for each parameter in turn is shown. This can be compared with the observed mass-balance data and those calculated using solely annual fit data.
those using longer-term averages (Fig. 5a; Table 1). A comparison of average ELA and net mass balance for Lovénbreen over the 9 year period demonstrates this (table 1). For example, ELAs calculated using input data from the annual method deviate by a mean of 10 m from measured values, as compared with less than half this value for daily meteorological data.
A series of model runs was also undertaken using daily meteorological data for each individual parameter in turn, and using sinusoidal functions for the remainder (Fig. 6). Comparison of these calculations with observed mass balance for Midre Lovénbreen shows that the inclusion of daily temperature, as opposed to the sinusoidal function through the year, yielded the most significant shift in predicted mass-balance values towards those measured in the field (Fig. 6). Changes introduced through including detailed data on precipitation and cloudiness were less marked, but daily cloudiness data were the most significant of the two. This implies that detailed meteorological data, on temperature in particular, should be used in this form of modelling in preference to annual fits to measured data, where the former are available. This is of course not possible when past or future climates are being modelled.
Modelling The Sensitivity Of Spitsbergen Glaciers To Climate Change
Sensitivity to future warming
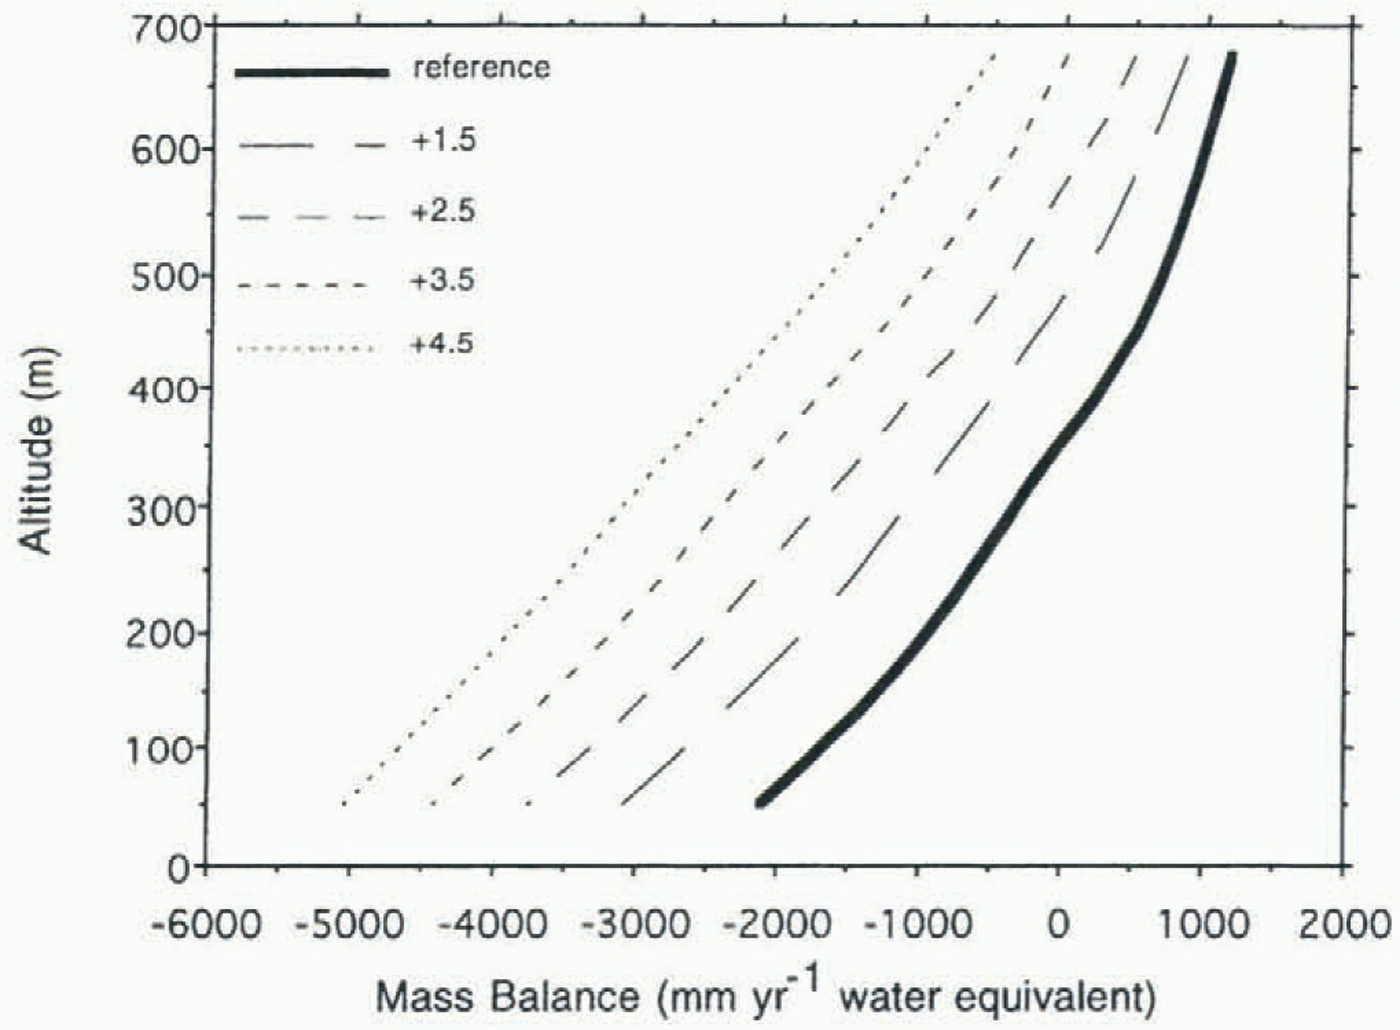
Modelling of climatic warming was carried out in two parts. The first series of tests applied global average values in response to a doubling of the CO2 concentration, as predicted by various modelling efforts. Koster (1991) states that the global mean rise in temperature will be 1.5–4.5°C, with an average of 2.5°C. These values were each applied to the reference climate, and provided a test of the sensitivity of the glacier system to a wide range of warming scenarios. The results are presented in Figure 7. For a rise of 1.5°C, there is a calculated increase in the deficit in net balance of 0.77 m year–1 (from –0.27 m year–1 to –1.05 m year–1) and an increase of 112 m in ELA (from 371 m to 483 m). In the most extreme case, of a warming of 4.5°C, the net mass balance will decrease by approximately 2.7 m year–1 relative to to-day,
Modelled mass balance with altitude on Midre Lovénbreen determined from the use of modern reference climate data, and for increases in annual mean temperature of 1.5°, 2.5°, 3.5° and 4.5° C.
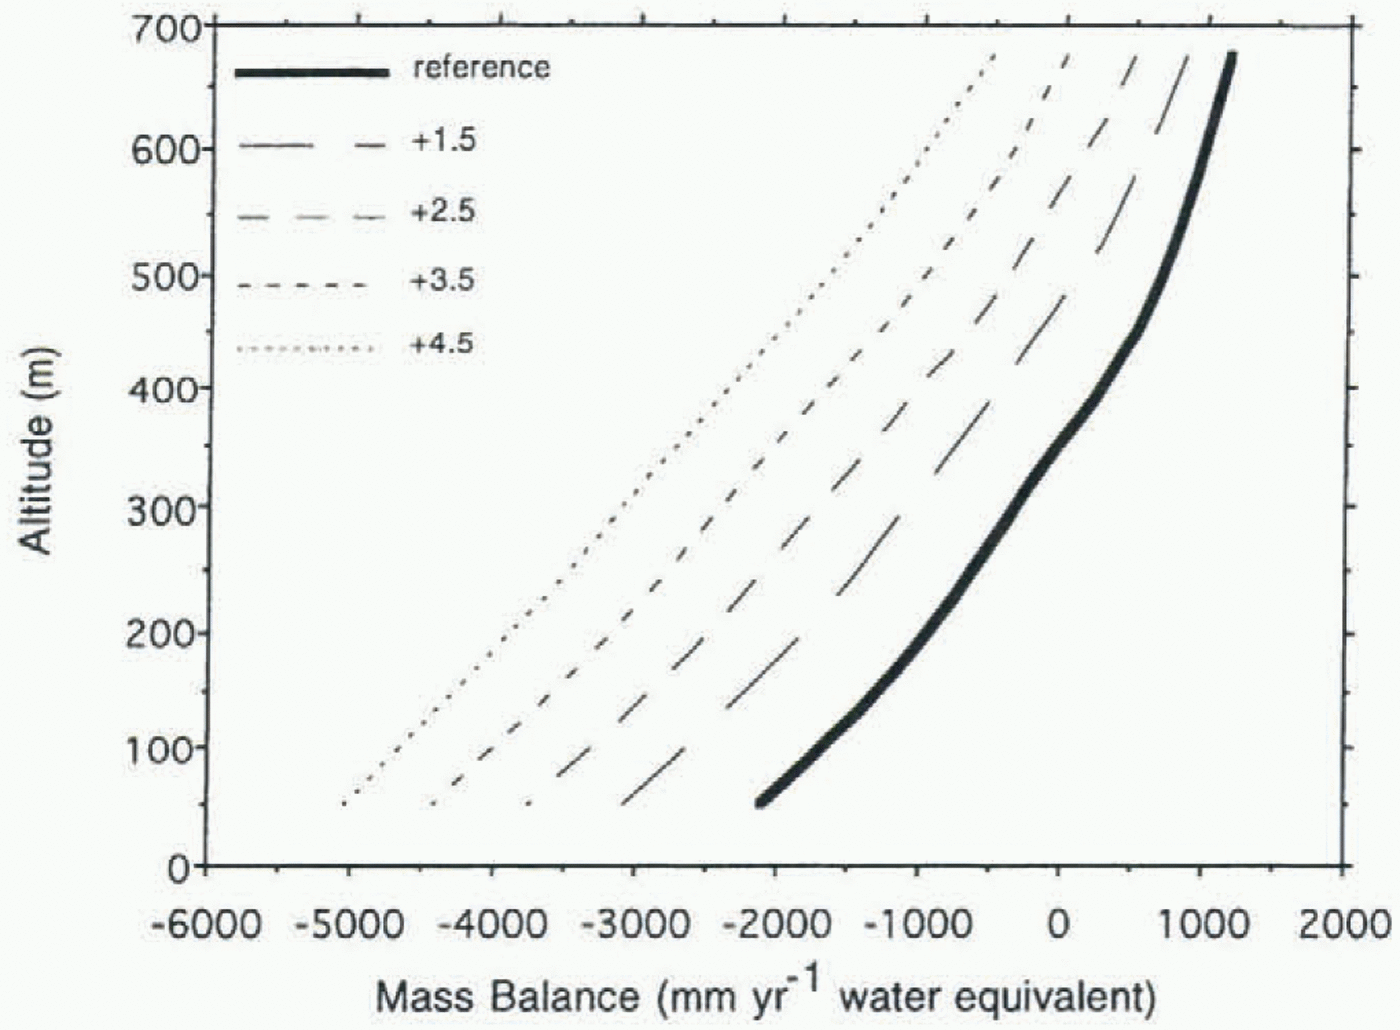
and the equilibrium line will rise to an elevation of over 700 m. This is greater than the highest elevations in the accumulation area of Lovénbreen and would therefore result eventually in the complete wastage of the glacier. In summary, changes on the order of –0.61 m year–1 °C–1 in net mass balance and 90 m °C–1 in ELA are predicted from energy-balance modelling of valley glaciers in northwest Spitsbergen.
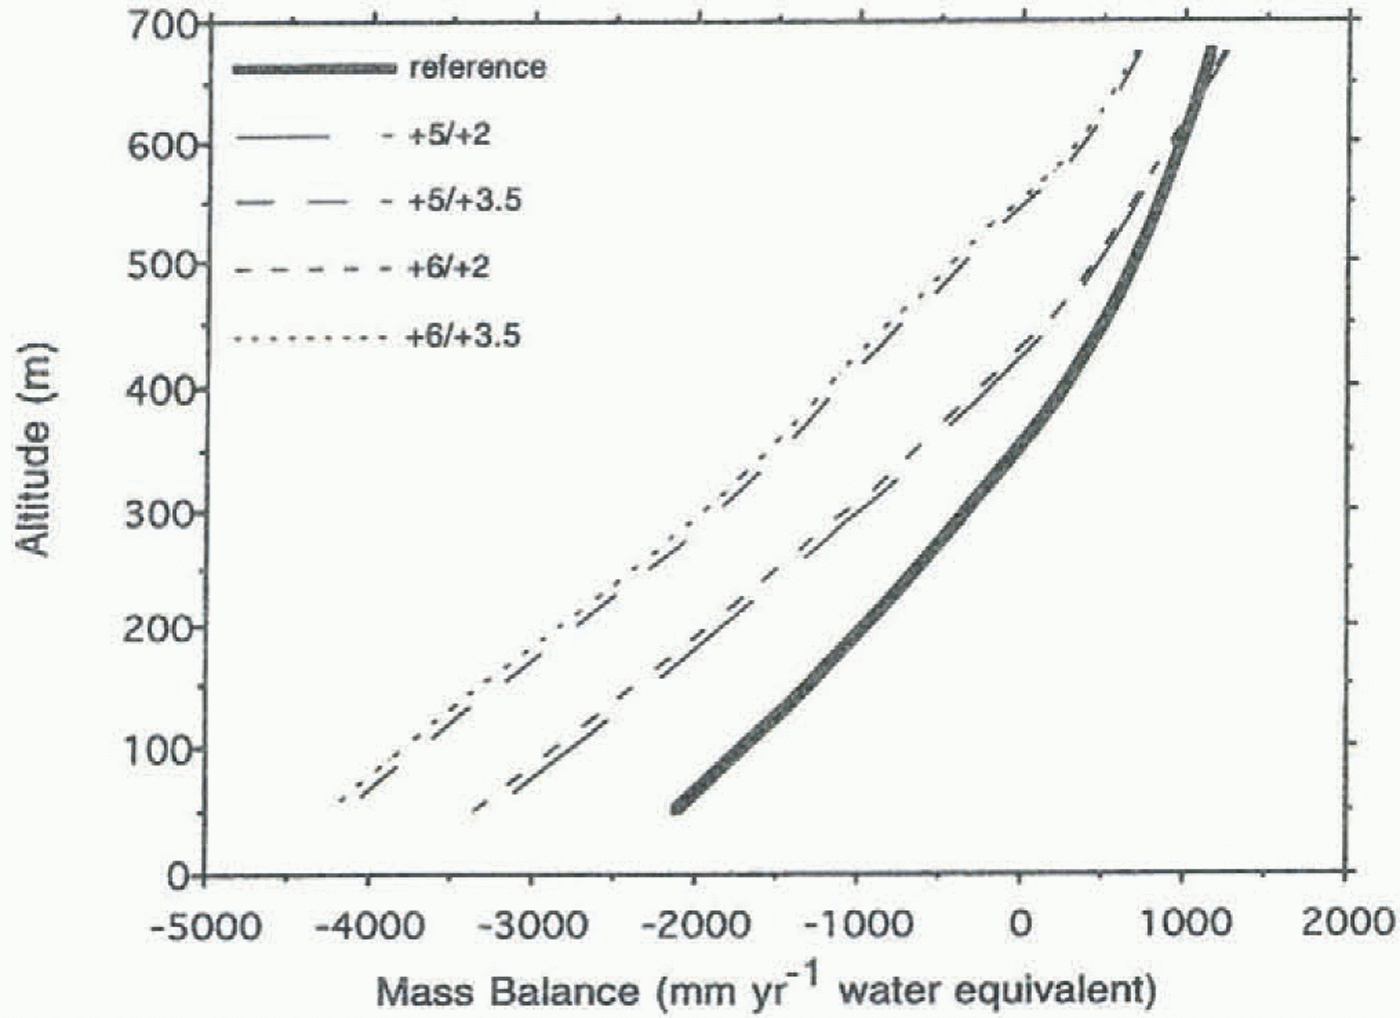
A second series of tests utilises values of climate change determined specifically for the Fennoscandian region, which are predicted to occur for a doubling in the atmospheric concentration of CO2. They incorporate changes to both summer and winter temperatures, and to precipitation, in response to warming (Koster, 1991). Winter temperatures of +5° to 6°C and summer temperatures of +2° to 3.5°C are used, combined with precipitation increases of 10–50%. These changes were applied to the reference climate by use of a sinusoidal curve defined by the change in summer and winter temperature.
Examples of the results of modelling using these values for future climate changes are shown in Figure 8. In general, rises in summer temperature had an important effect on mass balance, whereas increases in winter temperature were of little significance. This is because the temperature is significantly below the melting point through most of the winter period, and raising it does not necessarily result in melting. When an increase of 2°C in summer temperature was applied, the increase in ablation was offset above about 600 m in elevation by an increase in precipitation by 50%, regardless of the change in winter temperature (Fig. 8). For this scenario, the equilibrium line rose by about 53 m. However, when the summer temperature was increased by 3.5°C, increased melting could not be offset anywhere on the glacier by even a 50% increase in precipitation, and the equilibrium line climbed 175 m relative to the modern reference climate (Fig. 8). When precipitation was either held at the reference climate value or increased by 10%, the ELA for a 3.5°C rise in summer temperature was found to be close to or above the highest points on the glacier, again resulting in the total wastage of the ice mass. Thus, depending on the relationship between temperature and precipitation, a warming of 3.5–4.5°C would be likely to
Modelled mass-balance profiles for Midre Lovénbreen over the decade 1980–89 compared with the modern reference climate. Different values represent (from left to right, separated by a slash) increase in winter temperature and increase in summer temperature, together with a 50% increase in annual precipitation in each case.
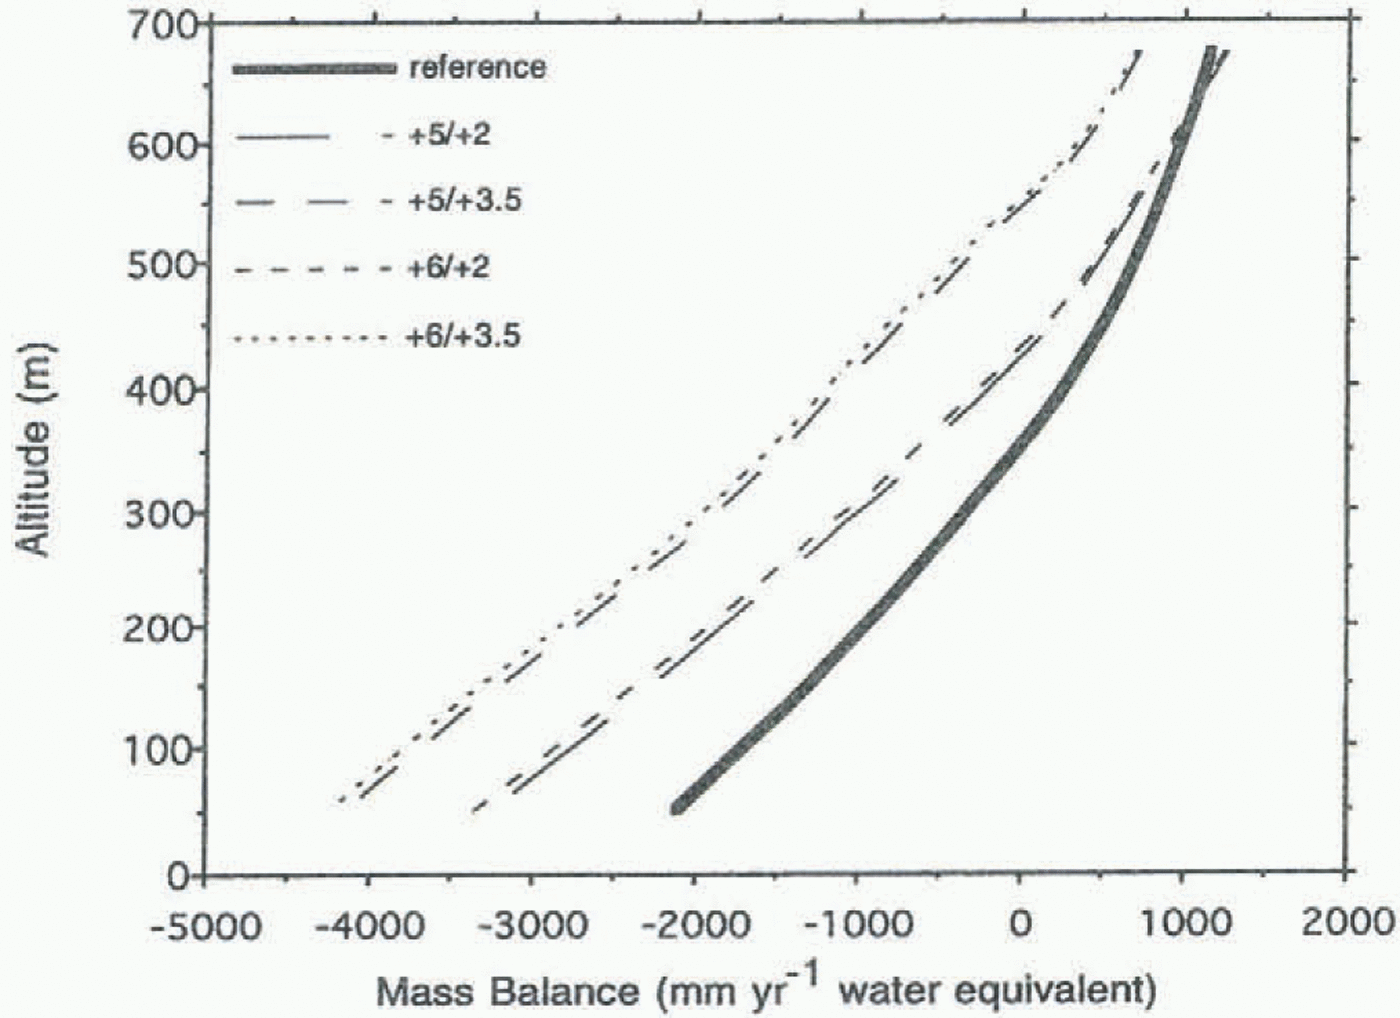
lead to the complete melting of Midre Lovénbreen, and of glaciers of similar hypsometry in Spitsbergen, if sustained through time (figs 7 and 8). In fact, because of the feedback between mass balance and ice surface elevation, glacier wastage is likely to take place at lower values of climate warming. The temperatures we present therefore indicate the maximum necessary for complete glacier wastage.
Past climate change: the Little Ice Age
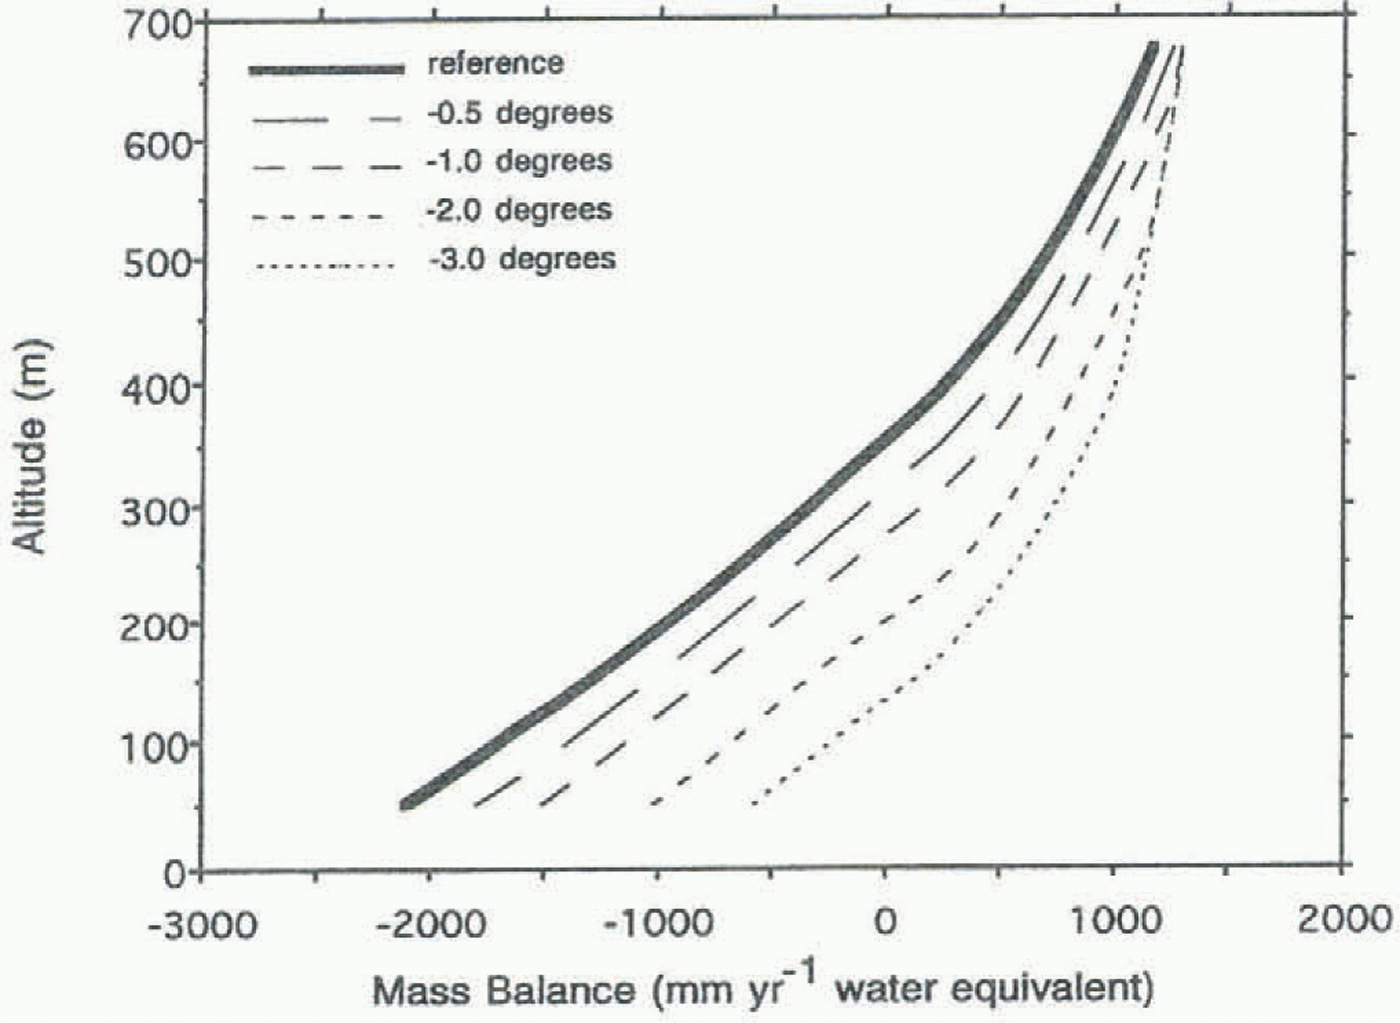
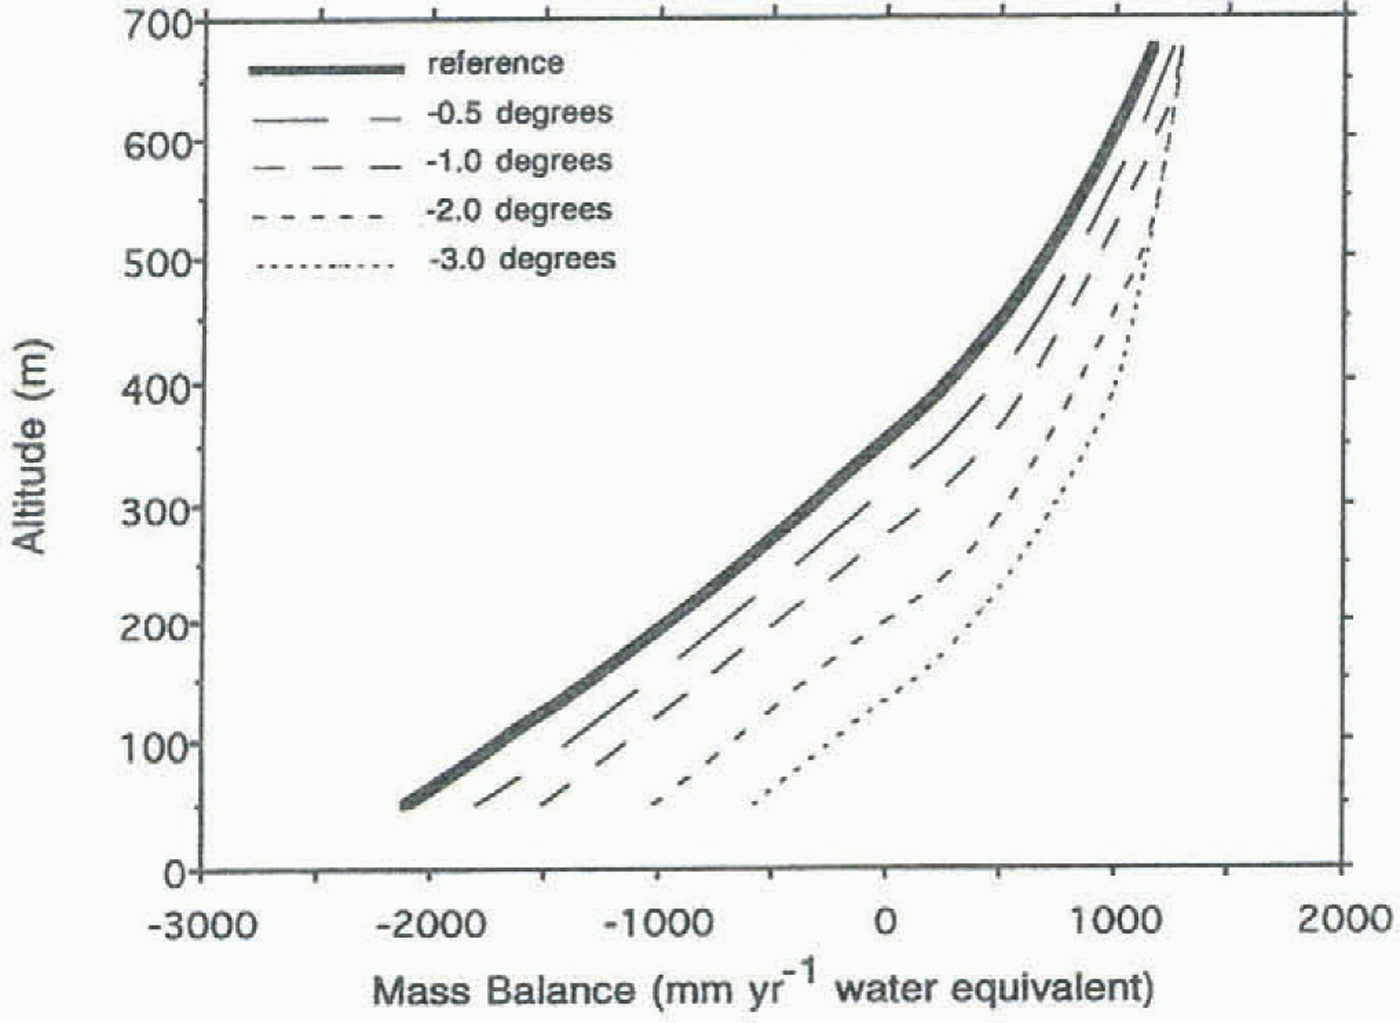
Simões (1990) determined from ice-core data that the increase in temperature for the 20th-century average as compared with the previous three centuries was 1.5–2.2°C over the Svalbard archipelago, of which Spitsbergen is the largest island. These three centuries cover the most intense part of the climatic cooling associated with the Little Ice Age in Spitsbergen (e.g. Dowdeswell and others, 1990; Fujii and others, 1990; Simões, 1990). The modelling carried out to determine the mass balance under these cooler conditions involved an envelope of mean temperatures 0.5–3°C lower than today. Modelling was again restricted to Austre Lovénbreen, and results were compared with calculated mass balance for the modern reference climate (Fig. 9). In general, modelling predicts that cooling would result in an increase in net mass balance of approximately 0.30 m year–1 °C–1 and a decrease in ELA of approximately 77 m °C–1 (Fig. 9).
Model calculations suggest that a decrease in the mean annual temperature of approximately 0.6°C or an increase of 23% in annual precipitation would result in a zero mass balance for Midre Lovénbreen (i.e. the glacier would be in equilibrium with the imposed climate). Using statistical correlations between meteorological and mass-balance data, Hagen and Liestøl (1990) found that a decrease in the average summer temperature of 1°C and a 50% increase in winter precipitation would result in a zero mass balance for Brøggerbreen and Lovénbreen.
Discussion
The sensitivity of ice masses to climatic change has also been modelled using an energy-balance approach for
Modelled mass balance with altitude on Midre Lovénbreen for past climate, using an envelope of cooler temperatures. Calculations using the modern reference climate are shown for comparison.
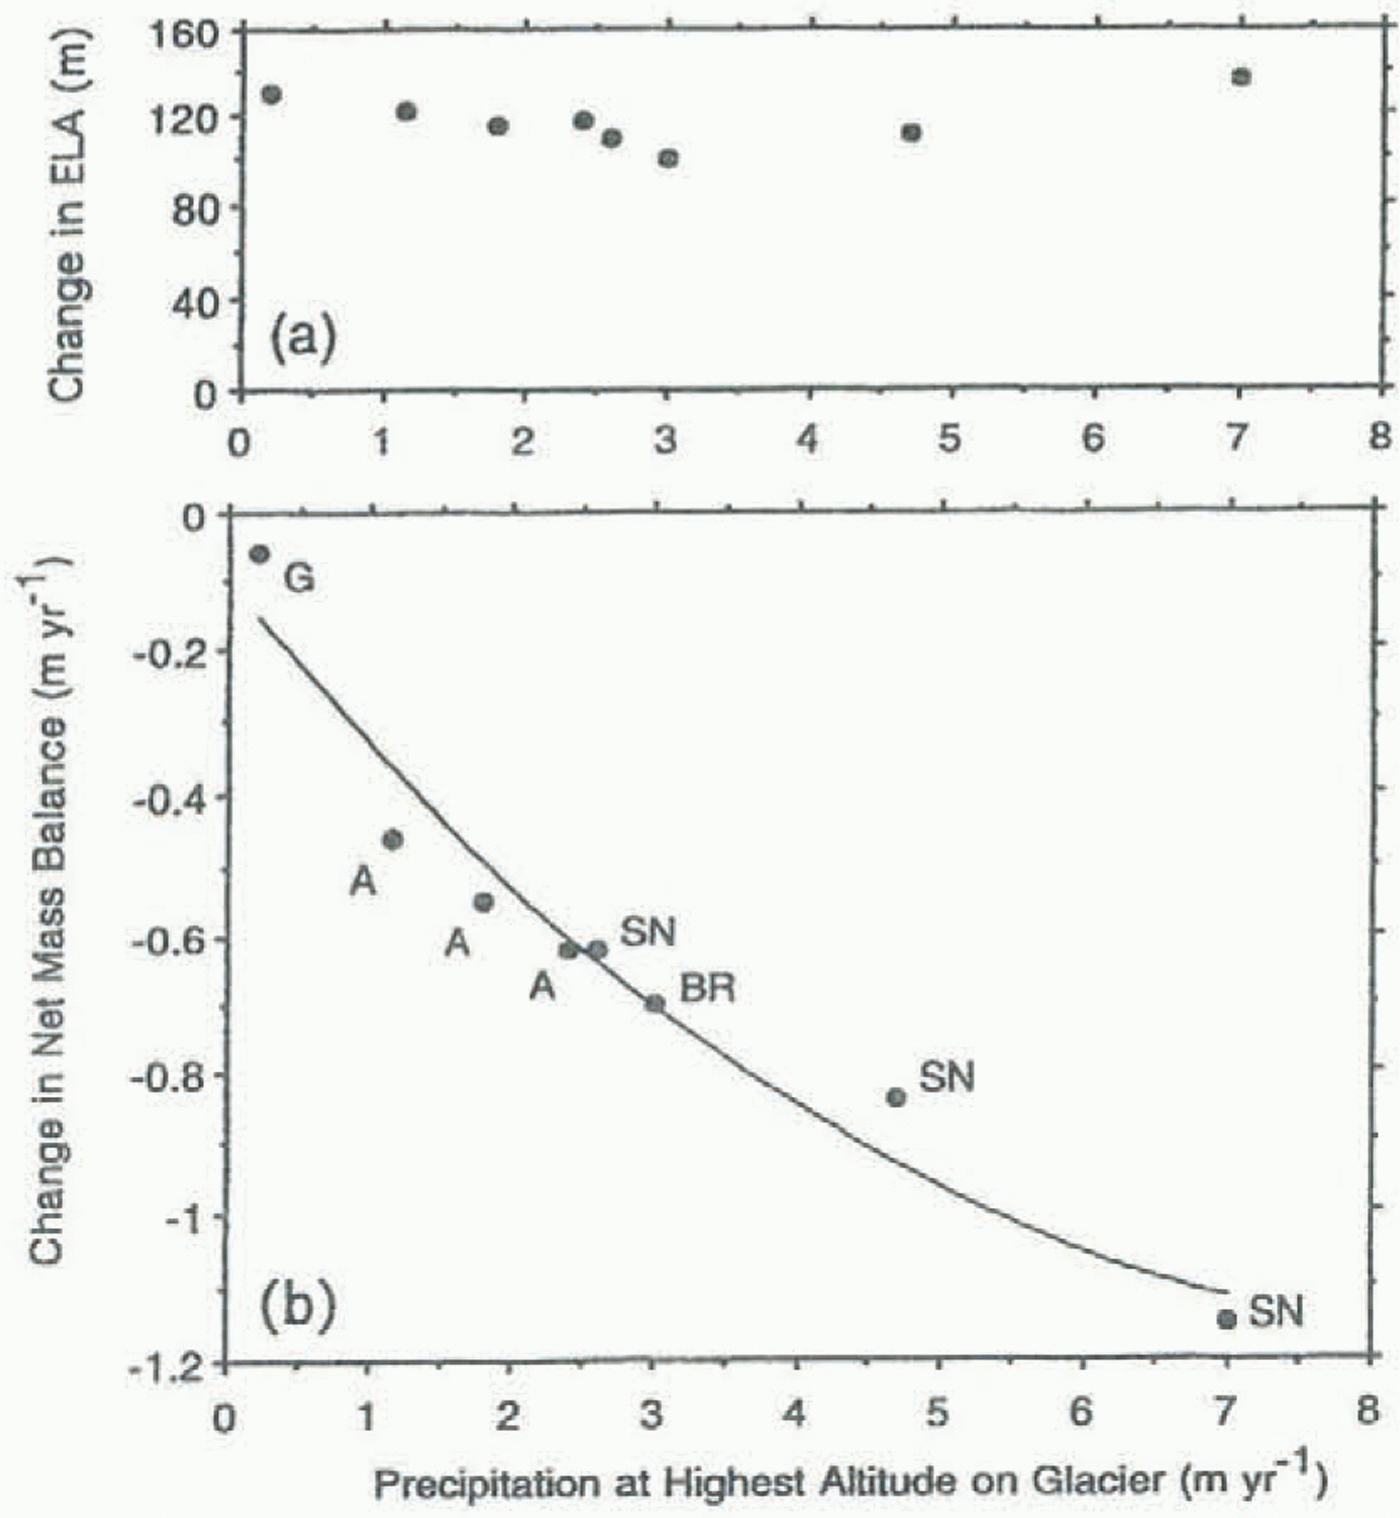
glaciers in southern Norway and the Alps, and for the Greenland ice sheet (Oerlemans, 1991, 1992). Changes in the net mass balance and ELA of glaciers in these areas for a 1°C warming are plotted in Figure 10, along with our results from Austre Brøggerbreen in northwest Spitsbergen. All values are plotted as a function of the annual precipitation in the highest part of the accumulation area. Oerlemans (1992) reports a clear relationship between annual precipitation and the predicted change in mass balance (Fig. 10b). However, he notes that there is no apparent link between precipitation and modelled change in ELA (Fig. 10a). The data for Austre Brøggerbreen, when plotted in Figure 10, are consistent with the trend in the relationship between mass balance and precipitation proposed by
Results of energy-balance modelling of glacier mass balance for a 1°C climatic warming, predicting changes in (a) ELA and (b) net mass balance linked to precipitation at the highest altitude on each glacier. Austre Brøggerbreen (BR) is compared with a part of the Greenland ice sheet (G), south Norwegian (SN) and Alpine glaciers (A) (data from Oerlemans, 1992).
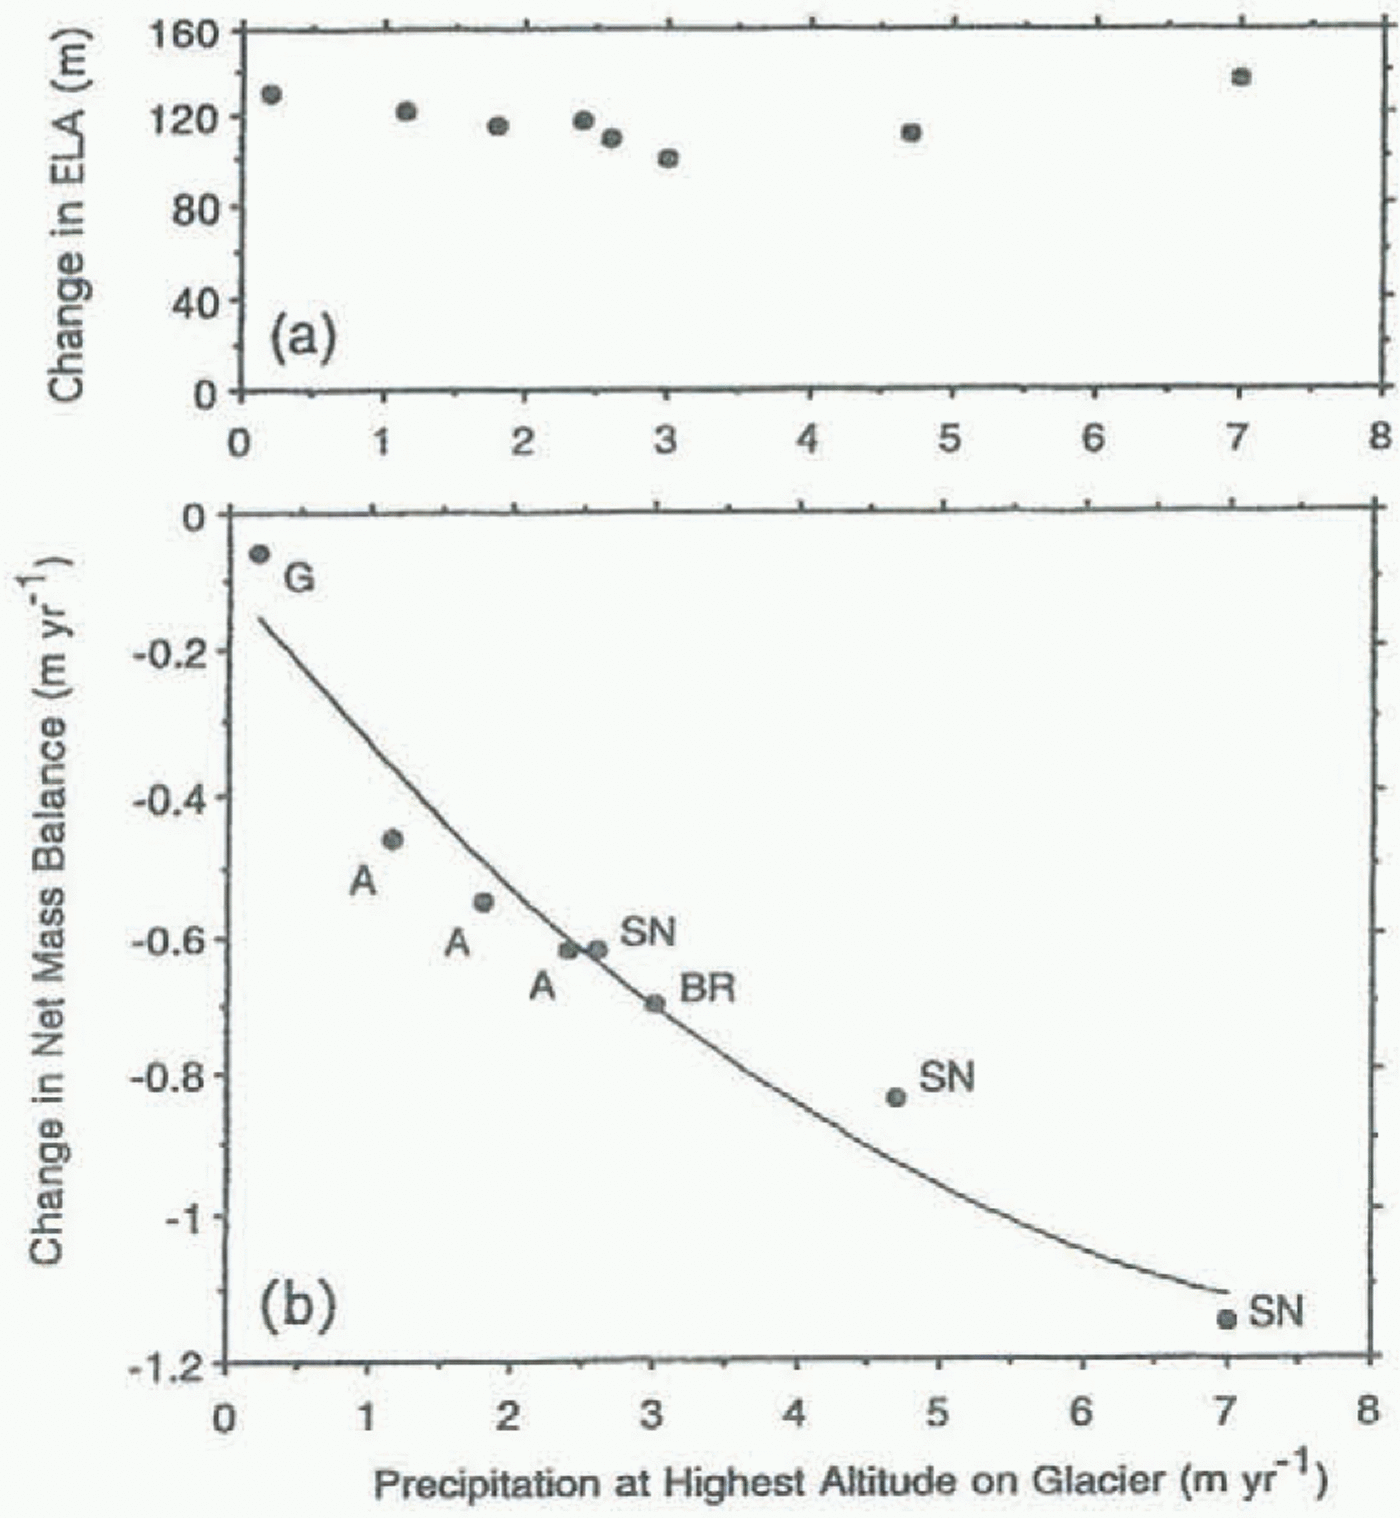
Oerlemans (1992). This supports the conclusion that maritime glaciers are more sensitive to change in temperature and precipitation.
The implication of figure 10b for Svalbard in general is that glacier sensitivity to climate change will vary across the archipelago with the prevailing gradient in precipitation. Precipitation is greatest along the west coast of Spitsbergen, and decreases eastwards and with increasing altitude. We might therefore expect Austre Brøggerbreen and Midre Lovénbreen to be among the glaciers most sensitive to climate change in the archipelago, because of their location close to the west coast (Fig. 1).
Summary And Conclusions
Spitsbergen, at the northern extremity of the strong poleward transfer of heat through the Norwegian Sea, is likely to be particularly sensitive to climate change. Historical records of temperature change in Spitsbergen show that it has experienced a major increase in temperature during the early part of the 20th century (Steffensen, 1982; Hanssen-Bauer and others, 1990). We have used an energy-balance model (Oerlemans, 1991, 1992) both to calculate the modern mass balance of two Spitsbergen glaciers and to predict their response to imposed warming and cooling trends. These imposed changes are intended to simulate future greenhouse warming and past climatic cooling associated with the Little Ice Age of the last few centuries. The main findings are as follows:
(1) Net mass balance and ELAs on Austre Brøggerbreen and Midre Lovénbreen were first modelled for contemporary climatic conditions. Model calculations used daily meteorological data, derived from the nearby station at Ny-Ålesund and corrected for altitudinal effects. Comparisons between modelled and observed mass-balance data were made for the balance years 1981–89 (Fig. 5). Modelled net balance averaged over the period 1980–89 is –0.47 m w.e. for Brøggerbreen and –0.44 m for Lovénbreen (table 1). This compares with the mean values of –0.36 and –0.27 m, respectively. Calculated ELAs for the two glaciers vary from observed values by 48 and 37 m for Brøggerbreen and Lovénbreen, respectively (table 1).
(2) Model sensitivity to differing forms of input meteorological data was tested using (a) daily averages of temperature, precipitation and cloudiness, and (b) an annual method with simple functions to describe climate data and their variations through the year (cf. Oerlemans, 1992). It was found that a more satisfactory fit with observed mass-balance data was achieved using daily meteorological values to model modern climate (Fig. 6).
(3) Sensitivity tests on the response of northwest Spitsbergen glaciers to greenhouse warming included changes in annual temperature, and various combinations of summer and winter temperature and precipitation shifts (figs 7 and 8). Energy-balance modelling predicts a net balance change of –0.61 m year–1 per °C of temperature rise relative to the present, and a rise in equilibrium line of 90 m °C–1. When summer temperature is increased by 3.5°C, increased melting could not be offset anywhere on the glacier by even a 50% increase in precipitation.
(4) Modelling for an envelope of possible Little Ice Age conditions in Spitsbergen suggests that cooling would result in an increase in net balance of 0.30 m year–1 °C–1 and a decrease in ELA of 77 m °C–1 relative to today (Fig. 9). A 0.6°C cooling or a precipitation increase of 23% would result in zero net mass balance for Midre Lovénbreen.
Similar energy-balance studies of glacier sensitivity to future climate warming have been carried out for southern Norwegian, Alpine and Greenland ice masses (Oerlemans, 1991, 1992). The predicted net mass-balance values for a Spitsbergen glacier support the suggestion that glaciers with a maritime influence (i.e. higher accumulation) are the most sensitive to climate change. This in turn implies that there is likely to be a gradient towards decreasing sensitivity to climate change as accumulation decreases eastward and with altitude within Spitsbergen and the Svalbard archipelago in general.
Acknowledgements
This study is a contribution to EU EPOCH Grant CT91-0035 and EU Environment Grant EN5V-CT93-0299 to J.A.D. Support for joint meetings in Utrecht came from the B. B. Roberts Fund, University of Cambridge. We thank the Director of the Scott Polar Research Institute, University of Cambridge, for his support of the project.