Contemporary psychopathology theories of emotional disorders had focused on the study of vulnerability factors that may be involved in its phenomenology. One of the most studied factors is perceived control (Gallagher, Bentley, & Barlow, Reference Gallagher, Bentley and Barlow2014; Gallagher, Naragon-Gainey, & Brown, Reference Gallagher, Bentley and Barlow2014). The most common measures of perceived control are the Anxiety Control Questionnaire (ACQ; Rapee, Craske, Brown, & Barlow, Reference Rapee, Craske, Brown and Barlow1996) and the Anxiety Control Questionnaire-Revised (ACQ-R; Brown, White, Forsyth, & Barlow, Reference Brown, White, Forsyth and Barlow2004). The internal structure of these instruments has not been replicated in various studies. The possible clinical utility of perceived control has not yet been established. We will address both points with two Spanish samples. Prior to this, we will summarize the studies of perceived control and its measurement.
Perceived control as a general psychological vulnerability
Perceived control can be defined as a personal belief about one´s capacity to control one’s internal emotional reactions to threats or external events (Mardiyono, Songwathana, & Petpichetchian, Reference Mardiyono, Songwathana and Petpichetchian2011). Perceived control has been considered a generalized psychological vulnerability factor in the etiology and maintenance of emotional disorders (Barlow, Reference Barlow2002).
According to the triple vulnerability model, the etiology and maintenance of emotional disorders is due to three diatheses (Barlow, Reference Barlow2002). The first one, called general biological vulnerability, refers to the dimensions of temperament such as neuroticism (negative affect) or extraversion. High levels of neuroticism and low levels of extraversion are associated with emotional disorders (e.g., Barlow, Sauer-Zavala, Carl, Bullis, & Ellard, Reference Barlow, Sauer-Zavala, Carl, Bullis and Ellard2013; Osma, García-Palacios, Botella, & Barrada, Reference Osma, García-Palacios, Botella and Barrada2014; Watson & Nagaron-Gainey, Reference Watson and Naragon-Gainey2014). The second one, called general psychological vulnerability, is related to elevated sympathetic nervous system arousal and the sense of unpredictability and uncontrollability of life events and emotions. These general vulnerabilities include perceived control. Diminished perceived control interacts with personality dimensions and promotes the development of a neurotic temperament, increasing the risk of suffering emotional disorders (Barlow, Reference Barlow2002). Lastly, specific psychological vulnerability is developed as a function of early learning experiences (e.g., elevated levels of anxiety sensitivity in panic disorder). Other specific vulnerabilities that have been classified in this section are dysfunctional attitudes, thought-action fusion or intolerance of uncertainty (Brown & Naragon-Gainey, Reference Brown and Naragon-Gainey2013).
Perceived control has shown large negative associations with trait anxiety measures and with specific anxiety disorder measures (Gallagher, Bentley et al., Reference Gallagher, Bentley and Barlow2014; Osma, Barrada, García-Palacios, & Botella, Reference Osma López, Barrada González, García-Palacios and Botella Arbona2016). Gallagher, Bentley et al. (Reference Gallagher, Bentley and Barlow2014) also revealed the relevance of perceived control as an important transdiagnostic predictor of symptom severity across anxiety disorders. In addition, Gallagher, Naragon-Gainey et al. (Reference Gallagher, Bentley and Barlow2014) found that patients who initiated a course of cognitive-behavior therapy reported more adaptive perceived control.
Findings support that perceived control seems to be a key transdiagnostic predictor both of anxiety severity symptoms and of cognitive-behavior therapy outcomes. Such results underline the importance of assessing perceived control in the treatments for emotional disorders.
The assessment of perceived control
The assessment of perceived control has been carried out with different scales based on distinct theories (see Mardiyono et al., Reference Mardiyono, Songwathana and Petpichetchian2011). The Anxiety Control Questionnaire (ACQ; Rapee et al., Reference Rapee, Craske, Brown and Barlow1996) was developed taking into account Barlow´s theory of the etiology and maintenance of emotional disorders (Barlow, Reference Barlow2002). The authors of the original ACQ considered that the scales used till then did not assess specific aspects of perceived control, so they decided to develop a perceived control measurement that would assess emotional reactions and external threats for use in the assessment of anxiety disorders (Rapee et al., Reference Rapee, Craske, Brown and Barlow1996). The ACQ is a 30-item self-report questionnaire rated on a 6-point Likert scale ranging from 0 = totally disagree to 5 = totally agree, with 18 reverse-worded items. The ACQ scores showed a good reliability for the global scale (Cronbach’s alphas from .82 to .88) and adequate convergent and discriminant validity. The internal structure was studied through a principal component factor analysis with an orthogonal rotation, yielding a two-factor solution: The first factor was Perceived Control Over External Events (with items like “I am usually able to avoid threat quite easily”); the second factor was Perceived Control Over Internal Emotional Reactions (with items like “I can usually stop my anxiety from showing”). Responses from a clinical sample with anxiety disorders (n = 250, M age = 35.2 years) and a non-clinical sample (n = 236, M age = 19.7 years) were used. Despite the favorable psychometric properties of the scale, the authors recommended new analyses. Item wording and distribution of the items in factors, for this and the following models, can be seen in Table 1.
Item wording of the ACQ and ACQ-R and different proposed models of the internal structure of the instrument

Notes: P1 = Model proposed by Rapee et al. (Reference Rapee, Craske, Brown and Barlow1996); P2 = Model proposed by Brown et al. (Reference Brown, White, Forsyth and Barlow2004); P3 = Model proposed by Shujuan et al. (2009; only considering the substantive factor); P4 = Model proposed by Gerolimatos et al. (Reference Gerolimatos, Gould and Edelstein2012). *indicates a reverse worded items. Bold wordings correspond to items included in the ACQ-R.
a = Item number of the ACQ; b = Item number of the ACQ-R.
The structure of the ACQ was revaluated in a sample of 303 students (66% participants reported being 19 years of age or younger; Zebb & Moore, Reference Zebb and Moore1999). Analyzing the data with a principal component factor analysis, the authors considered that the model that best summarized the items was a three-factor solution: Control Over Threatening Internal and External Events (e.g., “I am able to control my level of anxiety”), Perceived Lack of Control Over Anxiety-Related Reactions (e.g., “My emotions seem to have life of their own”), and Perceived Lack of Control Over External Threatening Events (e.g., “There is little I can do to influence people’s judgments of me”). All the direct items loaded on the first component. The lack of agreement about the latent structure of the ACQ led the authors to recommend that researchers further explore the factor structure of the instrument.
In 2004, Brown et al. noted the problems with previous analyses of the ACQ’s internal structure and conducted a more comprehensive evaluation using exploratory factor analysis (EFA) and confirmatory factor analysis (CFA), with maximum-likelihood estimator. Their clinical sample consisted of 1,550 patients diagnosed with emotional disorders (M age = 33.2 years) and 360 non-clinical participants (M age = 18.7 years). The psychometric evaluation study produced the Anxiety Control Questionnaire-Revised (ACQ-R). This new scale contains 15 items, 11 of them reverse-keyed, with the same response scale as the ACQ. After evaluating models with different numbers of factors, Brown et al. chose the three-factor solution. The factors were (1) Perceived Control of Emotions, composed of 5 items that reflect the ability to effectively control one’s emotions (“I am able to control my level of anxiety”), (2) Perceived Control of Threats, composed of 6 items which refer to the belief that frightening events are out of one’s control (“There is little I can do to change frightening events”), and (3) Perceived Control of Stress composed of 4 items that refer the perception of difficulty to cope with one’s emotions in stressful situations (“When I am put under stress, I am likely to lose control”). The three factors presented correlations in the range of [.52, .54]. Brown et al. also tested a hierarchical model, but, as they noted, the structural component of the higher-order model was just-identified: The fit of a model with a higher-order factor is equivalent to the fit of a model with three correlated factors. The ACQ-R scores has shown good internal consistency and convergent validity (Brown et al., Reference Brown, White, Forsyth and Barlow2004; White, Brown, Somers, & Barlow, Reference White, Brown, Somers and Barlow2006) as well as adequate reliability for clinical and non-clinical samples (Brown et al., Reference Brown, White, Forsyth and Barlow2004).
Although the ACQ-R was presented in 2004, some authors have continued to evaluate the internal structure of the ACQ (Rapee et al., Reference Rapee, Craske, Brown and Barlow1996). Shujuan, Meihua, and Jianxin (Reference Shujuan, Meihua and Jianxin2009), analyzing data from 212 senior high school Chinese students (M age = 15.8 years) with CFA, concluded that the ACQ is organized in three factors: one substantive factor and two method factors associated with the positively and negatively worded items, respectively. Finally, in a more recent study, Gerolimatos, Gould, and Edelstein (Reference Gerolimatos, Gould and Edelstein2012) evaluated the internal structure of the ACQ in 135 older adults, M age = 72.7 years. Conducting an EFA (maximum likelihood extraction with equamax rotation –orthogonal– and parallel analysis as criterion to determine the number of factors to be retained), they extracted four factors: External Lack of Control, Internal Control, Internal Lack of Control, and Effective Coping.
Goals of the study
Results of the latent structure of the instruments assessing perceived control have shown some inconsistencies, with solutions ranging from one to four dimensions. As Brown et al. (Reference Brown, White, Forsyth and Barlow2004) stated, “the validity and utility of the three lower-order ACQ dimensions identified await future research” (p. 94). Perhaps due to this inconsistency, some authors recommend using the ACQ or ACQ-R total score as an indicator of the broader dimension of perceived control (Brown et al., Reference Brown, White, Forsyth and Barlow2004; Rapee et al., Reference Rapee, Craske, Brown and Barlow1996).
The main aim of this study was to validate the scores from the Spanish version of the ACQ-R using a non-clinical sample. For this purpose, we analyzed the internal structure of the ACQ-R scores to determine the number of factors needed to adequately explain the inter-item correlations. We also tried to offer additional insights about the appropriateness of using a single sum score for the ACQ-R or different scores for different dimensions. Given the inconsistencies in previous studies, we could not derive a clear hypothesis about the number of factors, but we expected that a general factor could appropriately summarize the inter-items correlations. In this study, we also assessed the relation of the ACQ-R scores and other variables tapping emotional disorders. We expected medium-high sized correlations with measures of negative affect, depression, and anxiety. The secondary aim was to present preliminary data about the clinical utility of the ACQ-R scores in the diagnosis of emotional disorders, specifically in a sample with panic disorder with or without agoraphobia. Given the key role of perceived control in the etiology and maintenance of emotional disorders (Barlow, Reference Barlow2002), we expected high mean differences between participants from college student sample and those with diagnosis of panic disorder with or without agoraphobia and, thus, high utility of the ACQ-R scores as a diagnostic criterion.
Method
Participants
The data was collected from a non-clinical and a clinical sample. The first sample comprised 382 college students from the (Universidad de Zaragoza) who completed the entire assessment protocol (n = 268), and from the (Universitat Jaume I) who completed only the ACQ-R and Anxiety Sensitivity Index (n = 114). This first sample had 70.9% of women, with a mean age of 21.6 years, SD = 4.48, range [18, 50]. The clinical group consisted of 52 patients from the Psychology Assistance Service of Universitat Jaume I de Castellón and from two private mental health centers in Castellón (Creos, centro de psicoterapia y formación and Centro clínico PREVI) diagnosed of panic disorder with (n = 44) or without agoraphobia (n = 8), 50% women, mean age = 32.1, SD = 10.4, range [18, 57]. Thirty-three participants (63.5%) were receiving pharmacological treatment in the assessment period with anxiolytics (28.8%), antidepressants (3.8%) or both (30.8%). The mean duration of their disorder was 5.0 years (SD = 5.0 years, range [4 months, 17 years].
Measures
The college student sample completed all the measures described below, except the clinical interview. For the clinical sample, we used a clinical diagnosis interview, and they only completed the ACQ-R.
Anxiety disorders interview schedule lifetime version for DSM-IV (ADIS-IV-L; Brown, Di Nardo, & Barlow, Reference Brown, Di Nardo and Barlow1994)
The ADIS-IV-L is a semi-structured interview designed to assess anxiety, mood, somatoform, and substance use disorders according to the criteria of The Diagnostic and Statistical Manual of Mental Disorders-4th edition (DSM-IV; American Psychiatric Association [APA], 1994). In this study, we used the anxiety disorder sections of the ADIS-IV-L translated into Spanish by Botella and Ballester (Reference Botella and Ballester1997).
Anxiety control questionnaire-revised (ACQ-R; Brown et al., Reference Brown, White, Forsyth and Barlow2004)
The characteristics of the ACQ-R have been previously described. The questionnaire was translated into Spanish by the first and third authors of this paper. After that, it was back-translated into English by a bilingual psychologist, obtaining a version almost identical to the original one.
Trait scale of the state-trait anxiety inventory (STAI; Spielberger, Gorsuch, & Lushene, Reference Spielberger, Gorsuch and Lushene1970)
The STAI-Trait has 20 items rated on a Likert-scale ranging from 0 = not at all to 3 = almost always. We used the Spanish version of Buela-Casal, Guillén-Riquelme, and Seisdedos (Reference Buela-Casal, Guillén-Riquelme and Seisdedos2011). Conbrach’s alphas for the students sample for this and the next measures are shown in Table 4.
Positive and negative affect schedule (PANAS; Watson, Clark, & Tellegen, Reference Watson, Clark and Tellegen1988)
The PANAS has 20 items measuring both positive and negative affect, with 10 items per subscale. Participants are asked to rate on a 5-point Likert scale, ranging from 1 = very slightly or not at all to 5 = extremely, their experience of different feelings and emotions, like “Enthusiastic” for positive affect or “Nervous” for negative affect. We used the Spanish version of Sandín et al. (Reference Sandín, Chorot, Lostao, Joiner, Santed and Valiente1999).
Anxiety sensitivity index (ASI; Peterson & Reiss, Reference Peterson and Reiss1992)
The ASI has 16 items, such as “It scares me when my heart beats rapidly”, with a response scale ranging from 0 = very little to 4 = very much. We used the Spanish version of Sandín, Valiente, Chorot, and Santed (Reference Sandín, Valiente, Chorot and Santed2005).
Beck depression inventory-II (BDI-II; Beck, Steer, & Brown, Reference Beck, Steer and Brown1996)
The BDI-II is a commonly used measure for the evaluation of depressive symptoms. Each item comprises four different sentences reflecting an increasing degree of depression. A score of 0 is given to the response indicative of the lowest level of depressive symptoms and 3 to the response indicative of the highest level. We used the Spanish version of Sanz, Perdigón, and Vázquez (Reference Sanz, Perdigón and Vázquez2003).
Procedure
Data from college students was obtained using a convenience sampling and through the collaboration of various professors working in the Human and Social Faculty (Universidad de Zaragoza) and in the Social and Human Faculty (Universidad Jaume I de Castellón). All college students were studying Psychology degree. The assessment process was conducted in the classes during college schedule and in group format. Participation was anonymous and students signed a consent form agreeing to participate in this study and to personal data protection. The clinical sample was obtained using a sequential method (all cases detected in a period of time [February to June 2010]) for people seeking treatment at the Psychology Assistance Service of Universitat Jaume I de Castellón (n = 24) and at two private mental health centers in Castellón (Creos, centro de psicoterapia y formación; n = 15 and Centro clínico PREVI; n = 13). They were diagnosed with panic disorder with and without agoraphobia (ADIS-IV-L; Brown et al., Reference Brown, Di Nardo and Barlow1994). The clinical sample was also informed of the study requirements and signed a consent form agreeing to participate voluntarily in this study. During data collection, all participants were either within the assessment process or waiting to start psychological treatment. Ethic committees from all the clinical centers approved this research.
Data analysis
First, we analyzed the internal structure of the ACQ-R for the college sample. We did not analyze the clinical participants separately because that sample size was rather small; we did not combine both samples because they were samples from two very different populations. Given the inconsistency in the number of factors to retain and the high presence of cross-loadings in the previous studies, we considered EFA as the best alternative. Two different models were tested. In the first one, we modeled inter-item correlations with a standard EFA approach with correlated factors. In the second model, an exploratory bi-factor analysis (EBFA; Jennrich & Bentler, Reference Jennrich and Bentler2011) was used. In EBFA, a general dimension is considered, which will explain what all the items have in common (in this case, perceived anxiety control), and several specific dimensions capturing the narrower factors after the general dimension is removed (Morin, Arens, & Marsh, Reference Morin, Arens and Marsh2016; Myers, Martin, Ntoumanis, Celimli, & Bartholomew, Reference Myers, Martin, Ntoumanis, Celimli and Bartholomew2014). The different factors are orthogonal. In this way, we will be able to establish the appropriateness of using a sum score of the ACQ-R items or scores from the different dimensions. A key phase in an EFA is to determine the number of factors to be extracted. Parallel analysis is one of the most accurate and recommended retention techniques available for this purpose (Garrido, Abad, & Ponsoda, Reference Garrido, Abad and Ponsoda2013). Rotation criteria were Geomin for the standard EFA and orthogonal Bi-Geomin for the EBFA. We chose an orthogonal rotation for the EBFA case as (Morin et al., Reference Morin, Arens and Marsh2016): (a) the orthogonality of the factors ensures interpretability of the results; (b) oblique and orthogonal exploratory factor models provide equivalent fit to the data (i.e., there is rotational indeterminacy); and (c) the statistical solution for oblique rotations in EBFA has not been properly provided (Jennrich & Bentler, Reference Jennrich and Bentler2012). The software used for the factor analysis was Mplus 7 (Muthén & Muthén, 1998–Reference Muthén and Muthén2012). Also, given the skewness and kurtosis of the item scores, robust maximum likelihood estimation was applied.
According to conventional cut-offs (e.g., Hu & Bentler, Reference Hu and Bentler1999), values greater than .90 and .95 for the comparative fit index (CFI) and Tucker-Lewis index (TLI) are considered to be indicative of an adequate and excellent fit to the data, respectively, whereas values smaller than .08 or .06 for the root mean square error of approximation (RMSEA) support acceptable and excellent model fit, respectively. To compare the EFA model (simpler model) with the EBFA model (more complex), we followed the guidelines offered by Morin et al. (Reference Morin, Arens and Marsh2016): Increments in the CFI ≥ .01 and improvements in the RMSEA and TLI (where the parsimonious model is considered) for the most complex model indicate that EBFA model should be preferred.
We computed Pearson correlations between the ACQ-R scores and the other measures for the results of the college sample. To compare the correlation coefficients, we used the statistic proposed by Meng, Rosenthal, and Rubin (Reference Meng, Rosenthal and Rubin1992), as implemented in the cocor R package (Diedenhofen & Musch, Reference Diedenhofen and Musch2015). To assess the diagnostic utility of the ACQ-R, we performed a ROC analysis to quantify the area under the curve where the ACQ-R scores were used to distinguish between clinical and non-clinical participants. To compute the area under the curve and the differences between curves (DeLong, DeLong, & Clarke-Pearson, Reference DeLong, DeLong and Clarke-Pearson1988), we used the pROCR package (Robin et al., Reference Robin, Turck, Hainard, Tiberti, Lisacek, Sanchez and Müller2011).
Results
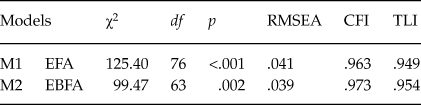
The parallel analysis indicated the appropriateness of retaining two factors. The first three eigenvalues of the sample correlation matrix were 4.98, 1.92, and 0.99; for the randomly generated datasets, they were 1.35, 1.27, and 1.21. Only the first two sample values were greater than the values of the random datasets. Hence, we performed an EFA, establishing the number of factors at two. As can be seen in Table 2, according to conventional cut-off values, this model provided a good fit.
Goodness of fit indices for the different models

Notes: EFA = Exploratory factor analysis; EBFA = Exploratory bi-factor analysis; df = Degrees of freedom; RMSEA = Root mean square error of approximation; TLI = Tucker-Lewis index; CFI = Comparative fit index.
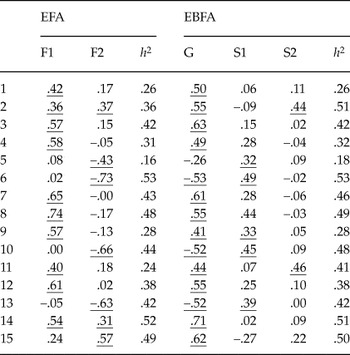
Item loadings are presented in Table 3. The solution is far from simple, in the sense that there are several items with relevant cross-loadings. The items representing threat control presented their highest loadings in Factor 1 (mean unsigned loading = .62, range [.57, .74]). The items representing emotion control presented their highest loadings in Factor 2 (M |λ| = .60, range [.43, .73]). The items tapping stress control loaded mainly on Factor 1 (M |λ| = .47, range [.36, .54]), but with some non-trivial loadings on Factor 2 (M |λ| = .25, range [.17, .37]). Given this pattern of loadings, we labeled Factor 1 as Threat and Stress Control and Factor 2 as Emotion Control. These two factors correlated .39. The item communalities ranged from .16 to .53, M = .38.
Item loadings of the different models

Notes: EFA = Exploratory factor analysis; EBFA = Exploratory bi-factor analysis; F1 = Factor 1, Stress and Threat Control; F2 = Factor 2, Emotion Control; G = General factor, General Anxiety Perception of Control; S1 = Specific factor 1; S2 = Specific factor 2; h 2 = Communalities; underlined values correspond to unsigned loadings equal or greater than .30.
When the inter-item correlations were modeled with an EBFA, the model fit improved slightly, ΔCFI = .010, ΔTLI = .005, ΔRMSEA = –.002. Thus, this model can be considered as the preferred model. More importantly, the EBFA model was easier to interpret than the EFA model. The general factor accounted for 70% of the common explained variance, while the specific factors offered an additional 22 and 8% of explained common variance. The loadings on the general factor ranged from .26 to .71, M |λ| = .53 and, with the exception of Item 5, were higher than the loadings on the specific factors. For the first specific factor, the maximum loading was .49; for the second specific factor, it was .46. The specific factors were harder to interpret. The inclusion of a new third factor, the general one, had little impact on the communalities when compared with the EFA solution, as they now ranged from .18 to .53, M = .41. Thus, the general factor appropriately summarizes the ACQ-R scores and can be labeled as General Anxiety Perception of Control.
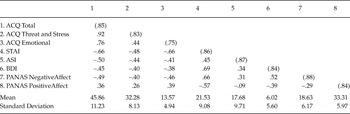
In the next step, we computed the correlations among the different measures and their Cronbach’s alphas. Those results are presented in Table 4. As could be expected, the ACQ-R scores (global and by dimensions) presented medium-sized negative correlations with measures related to anxiety, depression, and negative affect, and positive correlations with positive affect. We were interested in evaluating whether the specific scores (possibly derived from the ACQ-R) differed in the size of their correlations with the outcome variables: For the General Anxiety Perception of Control score M |r| = .49, for the Threat and Stress Control score M |r| = .39, and for the Emotion Control score M |r| = .46. When we compared the correlations of the outcome measures with Threat and Stress Control and with Emotion Control, the only statistically significant differences were found for STAI scores (z = 2.41, p = .016) and for Positive Affect (z = 2.57, p = .010). The rest of comparisons led to ps ≥ .165. When we compared the correlations of the outcome measures with General Anxiety Perception of Control and with Emotion Control, the only statistically significant differences were found for ASI scores (z = 2.81, p = .005) and for BDI scores (z = 2.28, p = .022). The rest of comparisons led to ps ≥ .356. Thus, the global ACQ-R score is equal to or even better than the scores from the two dimensions for the prediction of external variables. The Cronbach alphas for the entire battery of measures were satisfactory.
Correlations and Cronbach’s alphas

Notes: Values between brackets correspond to Cronbach’s alphas.
ACQ = Anxiety Control Questionnaire-Revised. ACQ Threat and Stress = Perceived Threat and Stress Control factor of the ACQ-R. ACQ Emotional = Perceived Emotional Control factor of the ACQ-R. STAI = State-Trait Anxiety Inventory. ASI = Anxiety Sensitivity Index. BDI = Beck Depression Inventory. PANAS = Positive and Negative Affect Scale.
Finally, to determine the clinical relevance of the perception of control, we compared the ACQ-R in the student sample and the clinical sample. For the General Anxiety Perception of Control [M students = 45.72, SD students = 11.44, M clinical = 33.65, SD clinical = 10.70, t 433 = 7.19, p < .001, Cohen’s d = 1.08], Threat and Stress Control [M students = 32.26, SD students = 8.11, M clinical = 25.33, SD clinical = 9.33, t 433 = 5.67, p < .001, Cohen’s d = 0.84], and Emotion Control scores [M students = 13.59, SD students = 4.92, M clinical = 8.31, SD clinical = 4.42, t 433 = 7.19, p < .001, Cohen’s d = 1.06], the non-clinical sample scored much higher than the clinical sample, with differences that can be considered high. The area under the curve for the General Anxiety Perception of Control scores was .786, for the Threat and Stress Control scores, it was .716, and for the Emotion Control score, it was .787. None of these areas presented a statistically significant difference, all ps > .169. A possible interpretation of these areas is that the ACQ-R scores are a fair-to-good tool to distinguish between panic disorder patients and non-clinical participants.
Discussion
Perceived control has emerged as an important construct in the contemporary models of psychopathology (Barlow, Reference Barlow2002) and has proved to be a relevant transdiagnostic predictor of symptom severity across the anxiety disorders (Gallagher, Bentley et al., Reference Gallagher, Bentley and Barlow2014). It has also been suggested as a predictor of treatment outcomes (Gallagher, Naragon-Gainey et al., Reference Gallagher, Bentley and Barlow2014). These facts have increased research and clinical interest in this construct and its assessment.
The ACQ, and more recently the ACQ-R, were developed to assess the construct of perceived control. Results from several studies analyzing the internal structure of these two measures have been inconsistent. In this regard, some authors recommended the need of new exploratory analyses (Brown et al., Reference Brown, White, Forsyth and Barlow2004). In order to clarify the discrepancies about the number of factors included in the perceived control construct and to validate the Spanish version of the ACQ-R, we translated it into Spanish and conducted an exploratory and exploratory bi-factor analysis.
Both the EFA and the EBFA showed adequate model fit. According to EFA results, the ACQ-R can be understood as a bidimensional questionnaire, with one factor measuring Stress and Threat Control and the other Emotion Control. In our sample, two previously separated factors, Stress Control and Threat Control, collapsed in a single one. The EBFA model showed a superior fit and, importantly, a clearer and more easily interpretable solution. Although the different items of the questionnaire can be conceptually and statistically split into several dimensions, all of them seem to be part of a general construct: General perceived anxiety control. Results showed that after subtracting the general source of variance, there is no relevant variance left in the two specific factors.
The presence of this general factor could explain some inconsistencies among previous results. This solution is coherent with the model proposed by Shujuan et al. (Reference Shujuan, Meihua and Jianxin2009) for the ACQ, where the authors established a single substantive factor. Furthermore, considering that 14 of the 15 items of the ACQ-R belonged to the first factor of the ACQ, a single general factor can also be considered in the results of Rapee et al. (Reference Rapee, Craske, Brown and Barlow1996).
Regarding the relationship with other clinical measures used in this study, the consideration of either two separate factors or a single general factor led to a very similar pattern of correlations, with slightly lower values for the Threat and Stress Control scores. The same can be said about the differences between the clinical and colleges samples.
This study presents several limitations. First, the results obtained through the college students sample cannot be generalized to general population. Second, the obtained results cannot be generalized to the results obtained with the original ACQ. In Table 1, we have shown the differences found so far regarding the internal structure in the two instruments. Third, although perceived control is considered a transdiagnostic construct for anxiety disorders (Gallagher, Bentley et al., Reference Gallagher, Bentley and Barlow2014), we cannot generalize the results of this study to other clinical populations. We cannot generalize these results as a possible value of the ACQ-R to diagnose panic disorder versus other specific scales (i.e., Panic Disorder Severity Scale; Houck, Spiegel, Shear, & Rucci, Reference Houck, Spiegel, Shear and Rucci2002) because we have not included any specific panic disorder scale in the current study. Finally, it is difficult to compare these results with those from previous studies for various reasons: the differences in the sizes and characteristics of the selected samples (e.g., language, age), the use of the ACQ-R instead of the ACQ, or the inclusion of a clinical sample.
Despite those limitations, the results of this study help to clarify the internal structure of the ACQ-R. Further, given that the results of this study inform about the possible validity of using a global score for perceived anxiety control (Rapee et al., Reference Rapee, Craske, Brown and Barlow1996; Shujuan et al., Reference Shujuan, Meihua and Jianxin2009), they reinforce the appropriateness of using a global score for this questionnaire in clinical and research settings. Finally, these results also encourage other researchers to replicate these findings with other versions of the ACQ-R.
As a preliminary contribution, this research informs of the possible clinical utility of the ACQ-R scores. Using the global score (general factor) of perceived control, the results have shown a large area under the curve (.786), so this instrument could be used to discriminate between people with and without psychopathology (in this case, panic disorder). These outcomes are important from a clinical and research perspective because the potential improvement of ACQ-R scores following a psychological treatment have been considered indicative of clinical improvement (Gallagher, Naragon-Gainey et al., Reference Gallagher, Bentley and Barlow2014). In order to generalize these results and to improve the statistical validity of the ACQ-R scores, we encourage researchers to conduct new studies selecting larger control samples and clinical samples with different diagnoses.
Finally, for researchers and clinicians is important to have validated assessment instruments that allow them to continue studying the phenomenology of mental disorders and the efficacy of their treatment. In this sense, to have short validated instruments as the ACQ-R in Spanish can be a facilitator in some contexts where time and resources are scarce (i.e., public mental health settings).