


1. INTRODUCTION
The safety of maritime transportation has become increasingly important in recent decades due to heavy traffic in open coastal waters, continuously increasing traffic volumes and complicated shipping routes in some waters. According to Peng (Reference Peng2013), more than four million ships sail in Chinese coastal waters each year, and the quantity will reach around five million by the end of 2018. Meanwhile, many maritime activities have been carried out in the fields of fishing, marine engineering, offshore wind power engineering, oil and gas engineering, etc. The conflicting requirements between ship navigation and other activities has led to the risks to navigation significantly increasing. Studies on navigation safety status in open waters are helpful to understand the safety hazards while ships are navigating in certain water areas. They can also provide decision making support for the design of ship routing systems, the layout of search and rescue sites, the configuration of rescue forces and the administration of navigation safety.
In the past, limited by the position and scope of observed waters, it was difficult to collect effective data to evaluate navigation risk. The amount of data was small, and its reliability could not be guaranteed. Accordingly, earlier navigation risk evaluations were mainly on coastal ports and waterway areas, with few studies on open coastal sea areas. Traditional navigation risk evaluations mostly considered natural environments as major factors; less consideration was given to the traffic flow indices which can fully reflect the navigation risk of sea areas. With the extensive application of the Automatic Identification Systems (AIS), the research of traffic data provided by modern navigation instruments can make up for the shortcomings of traditional methods (Gunnar Aarsæther and Moan, Reference Gunnar Aarsæther and Moan2009). According to the Safety of Life at Sea Convention (SOLAS) (IMO, 2009: 256), “all ships of 300 tonnes gross tonnage and upwards engaged on international voyages and cargo ships of 500 tonnes gross tonnage and upwards not engaged on international voyages and passenger ships irrespective of size shall be fitted with an Automatic Identification System (AIS) no later than 1 July 2008”. The density, speed and track distribution of ships in a certain water area can be obtained by decoding and processing the received AIS information. Through mining, screening, and extraction of effective navigation risk evaluation indices from a large sample of AIS data, the detailed dynamic and static information provided by AIS is of great significance to the safety of ships and to their efficient operation in open coastal waters.
Many studies have been conducted on AIS data mining and its application in recent years. The experimental team led by Zheping Shao used dynamic and static tables in an AIS information database as the data source to realise data acquisition and data distribution visualisation of ships’ density, speed, track, encounter rate, etc. (Ji et al., Reference Ji, Shao, Pan and Tang2009; Pan et al., Reference Pan, Jiang and Shao2010; Tang et al., Reference Tang, Shao, Wu and Tang2012; Xiao et al., Reference Xiao, Zhao, Shao, Ji and Pan2014; Zhen et al., Reference Zhen, Shao, Pan and Zhao2014). Pan et al. (Reference Pan, Jiang and Shao2010) conducted a study on data mining algorithms and found ship encounter information from huge amounts of AIS data, including encountering space distribution, time distribution, ship scale and encountering situation. Tang et al. (Reference Tang, Shao, Wu and Tang2012) focused on an AIS-based distribution algorithm of ship traffic volume and density, constructed an AIS dynamic and static information database and achieved ship density visualisation on an Electronic Chart Display and Information System (ECDIS) by using database access technology. Using AIS data information from water areas near Portugal, Silveira et al. (Reference Silveira, Teixeira and Guedes2013) designed an algorithm and assessed the relative importance as well as the risk of different routes. They also proposed a new collision risk assessment method based on ship spacing, course and speed. Zhen et al. (Reference Zhen, Shao, Pan and Zhao2014) used AIS information as a data source and calculated the speed of ships in a Structured Query Language (SQL) database, using histograms and line charts to analyse the speed distribution of ships. Xiao et al. (Reference Xiao, Han, Gulijk and Ale2015) regulated the characteristics of traffic flow including the distribution of ship type, course, speed and density based on valid AIS data, taking a narrow channel in Rotterdam as an example to validate the study. Sang et al. (Reference Sang, Wall, Mao, Yan and Wang2015) analysed ship tracks in an inland waterway based on AIS data, simulated ship volume and used AIS information to restore ship track information. Felski and Jaskolski (Reference Felski and Jaskólski2015) further studied the effectiveness of AIS information through many statistics such as Course Over Ground (COG), Speed Over Ground (SOG) and integrity rate of AIS information. They obtained accurate, reliable and valuable navigation data provided by AIS, particularly the course and speed information.
In view of the large quantities of AIS information, convenient collection methods and the fact that through algorithm mining, a large amount of real objective traffic data can be provided, navigation risk assessment based on AIS observation has become a new trend (Tsou, Reference Tsou2010). However, earlier research mostly focused on several specific traffic factors. A complete evaluation system has not yet been established. Therefore, it is necessary to establish a scientific and practical navigation risk assessment system based on real AIS observation data.
2. ANALYSIS OF EVALUATION INDEX SYSTEM FACTORS
2.1. The Potentiality of Collision
The potentiality of collision is related to traffic density and management. Therefore, the factors that describe traffic situations in sea areas should be carefully considered in the evaluation index system.
2.1.1. Ship Traffic Volume
2.1.1.1. Average Traffic Volume
Average traffic volume refers to the average number of ships passing through a certain water area or channel in a fixed period, usually classified into annual, monthly and daily traffic volumes. The size of the ship traffic volume can directly reflect the traffic intensity in a certain water area: the greater the average traffic volume, the greater the number of vessels per unit time, the smaller the safe encounter zone and the higher the risk to safety of navigation (Wu and Zhu, Reference Wu and Zhu2004).
2.1.1.2. Peak Traffic Volume
Peak traffic volume or maximum traffic volume refers to the amount of traffic that corresponds to the maximum amount of traffic volume per unit time. Evaluating navigation safety only by the average traffic volume will cause a distorted reflection of traffic conditions and an inaccurate evaluation of navigation safety. Therefore, it is necessary to consider the impact on the navigation safety of traffic flow during peak hours.
2.1.2. Ship Density and its Distribution
2.1.2.1. Average Ship Density
Average ship density refers to the number of ships in a unit area at a specific moment. It can show the density and the degree of congestion of the traffic. Therefore, when the sea area and the average ship speed are fixed, the ship traffic congestion degree, the degree of danger, and the potentiality of the risk are proportional to the ship density. According to Wu and Zhu (Reference Wu and Zhu2004), the number of ship collision accidents is related to the square of ship density. Obviously, the greater the average ship density, the higher the risk to safe navigation.
2.1.2.2. Ship Density Distribution Dispersion
Ship density distribution essentially refers to the spatial distribution of ships in a certain water area. If the distribution of the chosen water area is reasonable, even if the ship density is large, the traffic could be smooth flowing, and few accidents will occur. Therefore, ship density distribution should also be considered in addition to the density. In this study, the ship density distribution dispersion is used to express the distribution of ship density in a certain sea area. When the sea area is divided into n parts, the ship density of each part is x 1, x 2, …, x n. If the average ship density of the area is  $\bar{x}$, then the dispersion can be expressed as:
 $$s^2={1 \over N-1}\sum\limits_{i-1}^n {(x_i -\bar {x})^2}$$
2.1.3. Ship Speed and its Distribution
2.1.3.1. Average Ship Speed
Average ship speed refers to the average speed of all the ships in a sea area or waterway. The faster the ship speed, the higher the probability of collision and other accidents. According to COLREG (2003) Rule 6, “every vessel shall at all times proceed at a safe speed”. Of course, a safer speed does not necessarily mean lower risk. However, considering that most accidents are collisions, when the average ship speed is too fast, the time left for officers to react and operate will be short, and the navigation risk will be increased accordingly (Zhang, Reference Zhang2008).
2.1.3.2. Ship Speed Distribution Dispersion
Ship speed distribution can predict the frequency of overtaking situations among ships in the same traffic flow model. In general, the frequency of ships overtaking on the same course is approximately proportional to the mean square deviation of the ship speed distribution. The range of speed distribution directly affects the probability of ship encounter and overtaking. The greater the deviation of speed distribution, the higher the probability of overtaking and the greater the corresponding navigation risk (Wu and Zhu, Reference Wu and Zhu2004). In this paper, ship speed distribution dispersion is used to express the ship speed distribution. In a specific sea area, the range of all the ship speeds is divided into n groups, the median ship speed of each group is x 1, x 2, …, x n, the frequency of different groups is f 1, f 2…fn, the average speed of all the ships is  $\bar{x}$ and the dispersion can be expressed as
 $$s^2={1 \over N-1}\sum\limits_{i-1}^n {f_i^\ast (x_i -\bar {x})^2}$$
2.1.4. Ship Spacing
2.1.4.1. Ship Instantaneous Spacing
In marine traffic engineering, neighbouring ships need to maintain a certain distance so as to prevent collision. Ship instantaneous spacing reflects the distance distribution among ships at a certain time. In a potential collision situation, officers tend to focus on one or more ships near their own ship, with less attention given to the ships further away. Therefore, only the nearest ship is considered when the ship instantaneous spacing is calculated. Each ship has a corresponding minimum safe distance. The ship instantaneous spacing is the average value of minimum safe distances of all the ships in that sea area. When the spacing between ships is small, the ship distribution is dense and the probability of encounter is great. Therefore, the smaller the ship instantaneous spacing, the lower the degree of navigation safety.
2.1.4.2. Average Ship Spacing
Average ship spacing is the average value of ship instantaneous spacing at different times. Ship instantaneous spacing reflects the distribution of ships in the sea area at a certain moment, while ship average spacing mainly reflects the ship distribution over a period. Therefore, it has stronger applicability and objectivity. The smaller the ship average spacing, the higher the risk to safety of navigation.
2.1.5. Ship Track
Ship track is the track record of a ship's navigation. Ship track distribution refers to the spatial distribution of all ship tracks in a certain area. If the ship density distribution is the spatial distribution of points, then the ship track distribution is the spatial distribution of lines.
2.1.5.1. Ship Track Overlap Rate
Generally speaking, there are two traffic flows in opposite directions in one sea area. When the ships of the two traffic flows follow the navigation regulations, the two opposite traffic flows form a good separation. But in fact, two opposite traffic flows usually have a certain degree of overlap. Ship track overlap is the situation where ship tracks overlap with each other in one sea area over a fixed period. Ship track overlap rate refers to the ratio of track traffic flow width of the overlapping part to the total traffic flow width in the sea area. In the overlapping area, the encounter conflict is obvious. Therefore, the higher the ship track overlap rate, the greater the probability the ships encounter, resulting in an increasing risk to navigation.
2.1.5.2. Number of Ship Track Intersection Areas
Ship track crossing, also called ship track intersection, refers to the intersection of ship tracks in a certain area. At the intersection of ship tracks, a number of ship traffic flows converge and the ship density increases significantly, resulting in an increase of the ship encounter rate. Generally, the risk of navigation in a certain water area is reflected by the number of track intersection areas. The more track intersection areas, the greater the risk to navigation.
2.1.6. Encounter Rate
Encounter rate refers to the number of ship encounters per unit time in a sea area or waterway. One encounter is counted when the Distance of Closest Point of Approach (DCPA) and the Time to Closest Point of Approach (TCPA) are smaller than certain numbers.
2.1.6.1. Encounter Rate Based on Distance of Safety Point of Approach (DSPA)
Considering the characteristics of AIS data, it is extremely difficult to precisely calculate the encounter rate based on DCPA. Therefore, in this paper, encounter rate based on Distance of Safety Point of Approach (DSPA) (Lei et al., Reference Lei, Wen, Xiao, Wang, Zhou and Wu2015) is adopted. Through data mining of AIS information, one encounter is counted when the spacing between two ships is smaller than the DSPA threshold (one nautical mile in this paper). Then the encounter rate is the total number of ship encounters based on DSPA per unit time. The higher the encounter rate, the greater the risk to navigation.
2.1.6.2. Encounter Rate Based on Altering Course Collision Avoidance
Through data mining of AIS information, one encounter is counted when the ship alters its course above a certain angle (5° in this paper) to avoid other ships and then returns to its original course. Then the encounter rate is the total number of ship encounters based on altering course collision avoidance per unit time. The higher the encounter rate, the greater the risk to navigation.
2.2. Potential Risks
Ship factors and maritime traffic accidents are the major factors of potential risks. Since the information of maritime traffic accidents cannot be acquired from AIS, only ship factors, that is, ship type and ship scale are analysed in this paper.
2.2.1. Ship Type
Ship type can reflect the degree of navigation risk in a sea area. Different ships have different structures, properties and cargo loading; the losses from different accidents are not the same either. Take the oil tanker as an example. An oil spill may bring immeasurable impact to the surrounding environment. Therefore, this paper uses the proportion of oil tankers, liquefied products ships and passenger ships in all types of ships in a certain sea area as a quantitative criterion of ship type. The higher the proportion, the higher the potential risk to navigation.
2.2.2. Ship Scale
Ship scale characterises ship size. The Length Overall (LOA), moulded breadth, Deadweight Tonnage (DWT) and Gross Tonnage (GT) of the ship are important indices in evaluating ship scale. Ship scale is an important factor affecting ship accidents. With the increase of ship scale, the draft, tonnage and width of the ship also increase. This leads to greater inertia, smaller power assigned to unit tonnage, reduced manoeuvrability, and then higher navigation risk. As Guan (Reference Guan1997) pointed out, the relationship between the ship's GT and the collision degree is as follows:
 $$\hbox{Risk degree of ship collision}=0{\cdot}0014\hbox{lg(}GT)+0{\cdot}0009$$
When the ship scale becomes larger, the losses caused by accidents also increase accordingly. So this paper selects the proportion of large ships (LOA ≥ 200 metres) in all scales of ships in a certain sea area as the quantitative criterion of ship scale. The higher the proportion, the higher the potential risk to navigation.
3. THE DECISION MODEL FOR NAVIGATION RISK IN SEA AREAS
3.1. Multi-objective and Multi-layer Fuzzy System
By analysing the factors of the evaluation index system, a comprehensive multi-objective and multi-layer fuzzy system is established by reference to Liu et al. (Reference Liu, Wu and Jia2005b). The configuration diagram of the system is shown in Figure 1.
Configuration diagram of multi-objective and multi-layer system
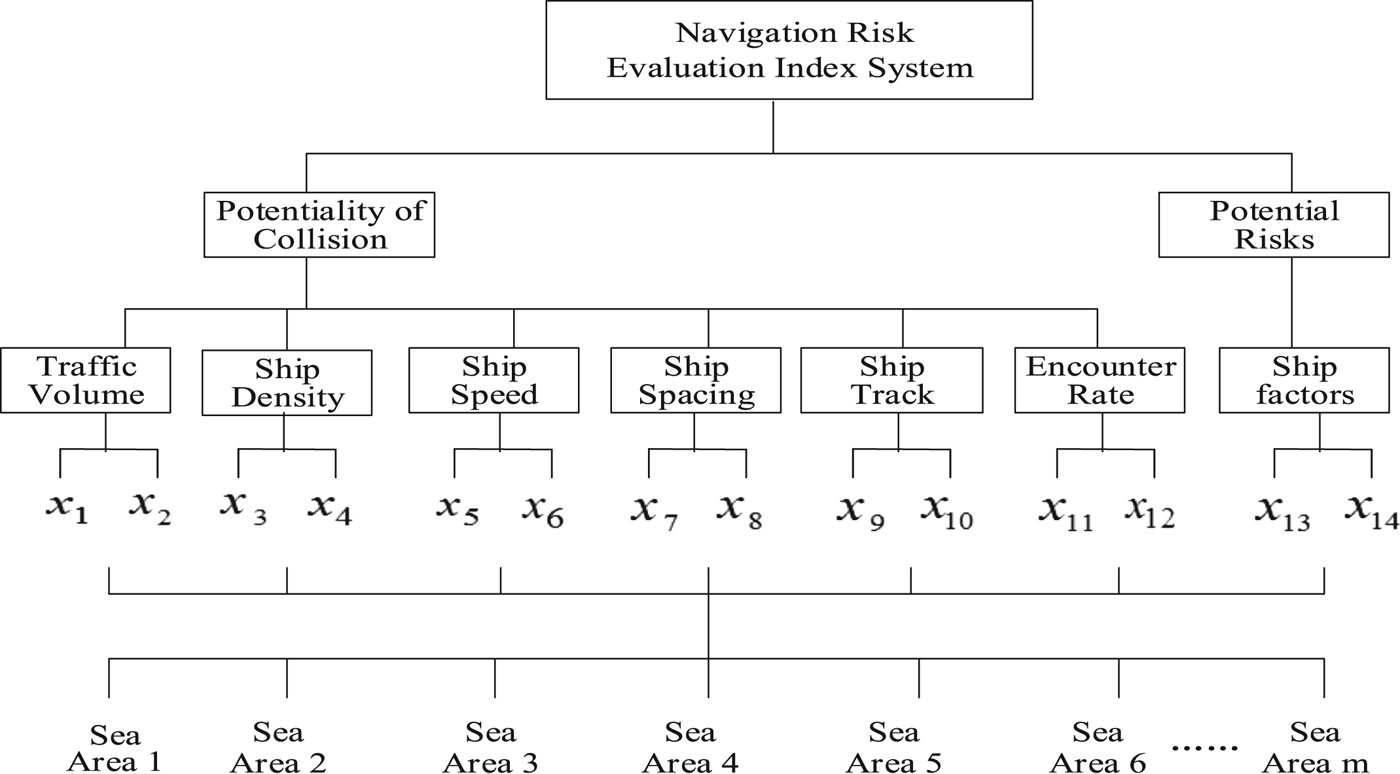
In Figure 1, x 1 is the average traffic volume; x 2 is the peak traffic volume; x 3 is the average ship density; x 4 is the ship density distribution dispersion; x 5 is the average ship speed; x 6 is the ship speed distribution dispersion; x 7 is the ship instantaneous spacing; x 8 is the average ship spacing; x 9 is the ship track overlap rate; x 10 is the number of ship track intersection areas; x 11 is the encounter rate based on DSPA; x 12 is the encounter rate based on altering course collision avoidance; x 13 is the ship type and x 14 is the ship scale.
3.2. Multi-objective and Multi-layer Fuzzy Optimisation Model
In a system, there is a finite alternative (decision) set, consisting of n candidate alternatives (decisions):
 $$D=\lcub {d_1 ,d_2 ,\cdots ,d_n } \rcub $$
The first layer has t sets of juxtaposed unit systems, where the k-th unit system has the evaluation objective set which consists of the evaluations of m sets of objectives for the decision set D. The evaluation objective for the decision j is expressed as the vector:
 $${}_{1k}X_j =\lcub {{ }_{1k}x_{1j} ,{ }_{1k}x_{2j} ,\cdots {}_{1k}x_{mj}} \rcub $$
where 1kx ij is the eigenvalue of the objective i for the j th decision in the first layer k-th unit system, i = 1, 2, 3, …, m, k = 1, 2, 3, …, t.
The objective eigenvalue matrix for n decisions in the first layer k-th unit system is expressed as:
 $${ }_{1k}X=\left[ \matrix{ \matrix{ {{ }_{1k}x_{11} } & {{ }_{1k}x_{12} } & \cdots & {{}_{1k}x_{1n} } \cr {{ }_{1k}x_{21} } & {{ }_{1k}x_{22} } & \cdots & {{ }_{1k}x_{2n} }} \cr {\cdots \cdots \cdots \cdots \cdots \cdots \cdots} \cr \matrix{ {{ }_{1k}x_{m1} } & {{ }_{1k}x_{m2} } & \cdots & {{}_{1k}x_{mn} }} } \right]={ }_{1k}(x_{ij} )$$
The objective eigenvalue matrix X is transformed to obtain the objective optimal relative membership matrix R:
 $${}_{1k}R=\left[ \matrix{ \matrix{ {{}_{1k}r_{11} } & {{}_{1k}r_{12} } & \cdots & {{}_{1k}r_{1n} } \cr {{}_{1k}r_{21} } & {{}_{1k}r_{22} } & \cdots & {{}_{1k}r_{2n} }} \cr {\cdots \cdots\cdots \cdots \cdots \cdots \cdots \cdots} \cr \matrix{ {{ }_{1k}r_{m1} } & {{}_{1k}r_{m2} } & \cdots & {{}_{1k}r_{mn} }}}\right]={}_{1k}(r_{ij})$$
where matrix X is transformed into matrix R by adopting the following objective optimal relative membership degree equation proposed by Chen (Reference Chen1994). Usually, there are two types of objectives, that is, profit and cost (Chen, Reference Chen, Fu, Wang and Liu2001), and their objective optimal relative membership degree can be expressed as follows:
In n alternatives (decisions), the value of objective i for a decision j is x ij, where i = 1, 2, …, m and j = 1, 2, …, n.
In case of the profit type,
 $$r_{ij} ={x_{ij} -\mathop {\hbox{min}}\limits_j x_{ij} \over \mathop{\hbox{max}}\limits_j x_{ij} -\mathop {\hbox{min}}\limits_j x_{ij}}$$
 $$\hbox{Or}\, r_{ij} = {x_{ij} \over \mathop {\hbox{max}}\limits_j x_{ij} +\mathop{\hbox{min}}\limits_j x_{ij}}$$
In case of the cost type,
 $$r_{ij} ={\mathop {\hbox{max}}\limits_j x_{ij} - x_{ij} \over \mathop {\hbox{max}}\limits_j x_{ij} -\mathop {\hbox{min}}\limits_j x_{ij} }$$
 $$\hbox{Or}\, r_{ij} =1- {x_{ij} \over \mathop {\hbox{max}}\limits_j x_{ij} +\mathop {\hbox{min}}\limits_j x_{ij} }$$
where  $\mathop {\max }\limits_{j} x_{ij}$ and
 $\mathop {\min }\limits_{j} x_{ij}$ are respectively the maximum and minimum eigenvalue of objective i in the decision set.
For the profit type, the larger the x ij, the higher the objective optimal relative membership degree, the greater the risk to navigation. In Figure 1, x 1, x 2, x 3, x 4, x 5, x 6, x 9, x 10, x 11, x 12, x 13 and x 14 are profit objectives. For the cost type, the smaller the x ij, the higher the objective optimal relative membership degree, the greater the risk to navigation. In Figure 1, x 7 and x 8 are cost objectives.
According to (Liu et al., Reference Liu, Wu and Jia2005b), when the variation range of the objective eigenvalue is large, Equations (8) and (10) are selected. When the variation range of the objective eigenvalue is small, Equations (9) and (11) are selected.
The first layer k-th unit system decision-making optimal relative membership degree model is:
 $${ }_{1k}u_j =1 \left/ {\left\{ {1+\left\{ {{\sum\limits_{i=1}^m {({ }_{1k}w_i (1-{ }_{1k}r_{ij} ))^p} \over \sum\limits_{i=1}^m {({ }_{1k}w_i { }_{1k}r_{ij} )^p} }} \right\}^{{2 \over p}}} \right\}}\right.$$
where p is the distance parameter: p = 1 (Hamming distance); p = 2 (Euclidean distance). The eigenvalue of m sets of objectives in the decision j have different weights, and the weight vector is:
 $${ }_{1k}w_j =({ }_{1k}w_{1j} ,{ }_{1k}w_{2j} ,\cdots ,{ }_{1k}w_{mj} ), \sum\limits_{i=1}^m {{ }_{1k}w_{ij} } =1$$
Assume that the optimal relative membership degree vector of the first layer k-th unit system is:
 $${} _{1k}u_j = ({}_{1k}u_1 ,{ }_{1k}u_{2,\ldots,} {}_{1k}u_n)$$
The optimal relative membership degree of all the unit systems in the first layer can be calculated by Equation (12), and the decision-making optimal relative membership degree matrix of the higher layer (second layer) is:
 $$U^{\ast }=\left[ \matrix{ \matrix{ {u_{11}^\ast } & {u_{12}^\ast } & \cdots & {u_{1n}^\ast } \cr {u_{21}^\ast } & {u_{22}^\ast } & \cdots & {u_{2n}^\ast }} \cr {\cdots \cdots \cdots \cdots \cdots \cdots } \cr \matrix{ {u_{t1}^\ast } & {u_{t2}^\ast } & \cdots & {u_{tn}^\ast } }} \right]=(u_{ij} ^\ast )$$
Let  $u_{ij} ^{\ast} =r_{ij}^{\ast}$, w ij* be the weight of the objectives in the unit systems of the higher layer, and
 $\sum\limits_{k=1}^{t} {w_{ij} ^{\ast}} =1$. According to the number of evaluation objectives, Equation (15) is calculated by using Equation (12) repeatedly. Therefore, from the low layer to high layer until the highest layer, the optimal relative membership degree vector can be obtained:
 $$u_j = (u_1 ,u_{2,\ldots ,} u_n )$$
The index weight vector is calculated as follows (Liu et al., Reference Liu, Wu and Jia2005a; Reference Liu, Wu and Jia2005b):
 $$w_i = {{\sum\limits_{j = 1}^n {r_{ij}} } \bigg{/} {\sum\limits_{i = 1}^m {\sum\limits_{j = 1}^n {r_{ij}} } }}$$
4. SIMULATION CALCULATION OF MULTI-OBJECTIVE AND MULTI-LAYER FUZZY OPTIMISATION MODEL IN HIGH RISK SEA AREA
4.1. Target sea area and evaluation index eigenvalue
Through in-depth studies on the AIS-based data mining algorithm of real traffic, this paper has designed and developed an AIS-based statistical platform for ship traffic flow. The platform was developed in Microsoft Foundation Class Library (MFC) in Windows. It can statistically analyse the real traffic of sea areas over a specific period. In this paper, the coastal waters of Chengshantou were used as an example to illustrate the platform. According to the size of the waters, the Chengshantou waters was divided into 16 roughly similar-sized sea areas, marked as sea areas 1 to 16. The statistical platform display interface is shown in Figure 2.
Statistical platform display interface.
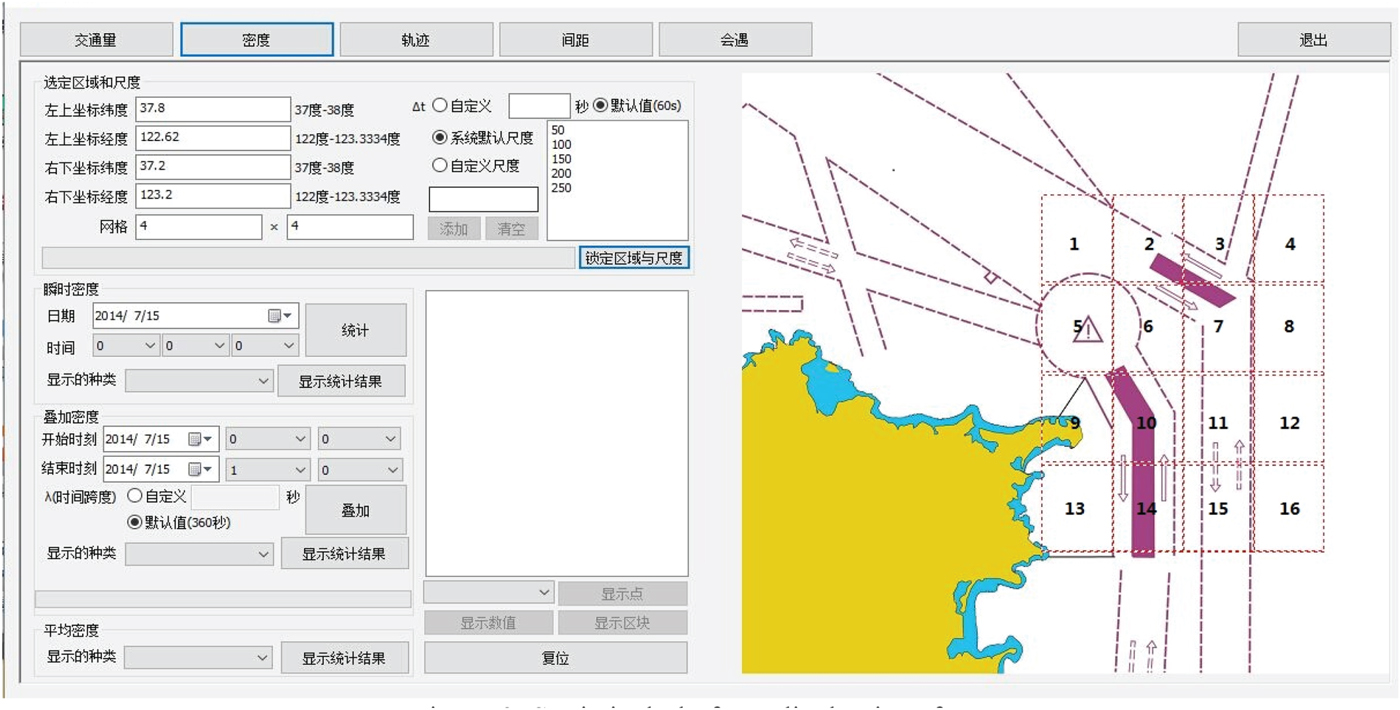
Table 1 shows the evaluation index eigenvalue in each sea area.
Raw traffic data based on AIS information.

4.2. Fuzzy Optimisation Decision-Making for Navigation Risk in Different Sea Areas
According to the data in Table 1, the eigenvalue matrix of target sea areas can be obtained as  ${ }_{1k}X (k=1,2,3,4,5,6,7)$:
 $$\eqalign{{ }_{11}X&=\left[ \matrix{ 8 & {12} & 9 & 6 & {21} & {10} & 5 & {13} & {12} & {25} & 3 & 4 & 2 & {23} & 3 & 5 \cr {12} & {15} & {13} & 8 & {27} & {14} & 8 & {17} & {16} & {30} & 6 & 8 & 4 & {28} & 5 & 8 \cr } \right]\cr { }_{12}X &=\left[ \matrix{ 7 & {11} & 8 & 5 & {19} & {11} & 4 & {10} \cr {1{\cdot}29} & {2{\cdot}21} & {2{\cdot}38} & {2{\cdot}94} & {2{\cdot}22} & {3{\cdot}15} & {2{\cdot}94} & {2{\cdot}44} \cr }\right.\cr &\left.\matrix{ &&9 & {20} & 2 & 4 & 2 & {15} & 2 & 3 \cr &&{2{\cdot}86} & {1{\cdot}84} & {2{\cdot}37} & {2{\cdot}55} & {3{\cdot}09} & {1{\cdot}77} & {2{\cdot}09} & {3{\cdot}51} \cr }\right]\cr { }_{13}X &=\left[ \matrix{ {10{\cdot}3} & {12{\cdot}5} & {12{\cdot}2} & {13{\cdot}2} & {10{\cdot}5} & {10{\cdot}8} & {11{\cdot}8} & {10{\cdot}8} \cr {2{\cdot}44} & {3{\cdot}83} & {3{\cdot}73} & {3{\cdot}46} & {2{\cdot}24} & {1{\cdot}67} & {3{\cdot}38} & {3{\cdot}74} \cr }\right.\cr &\left.\matrix{ && {9{\cdot}4} & {10{\cdot}8} & {11{\cdot}9} & {12{\cdot}1} & {8{\cdot}1} & {9{\cdot}7} & {7{\cdot}5} & {11{\cdot}3} \cr && {3{\cdot}39} & {3{\cdot}26} & {5{\cdot}61} & {4{\cdot}77} & {6{\cdot}60} & {3{\cdot}16} & {6{\cdot}32} & {2{\cdot}97} \cr }\right]\cr { }_{14}X&=\left[ \matrix{ {2{\cdot}54} & {1{\cdot}25} & {1{\cdot}17} & {1{\cdot}98} & {0{\cdot}78} & {1{\cdot}39} & {1{\cdot}52} & {2{\cdot}51} \cr {2{\cdot}24} & {1{\cdot}34} & {1{\cdot}08} & {2{\cdot}21} & {0{\cdot}89} & {1{\cdot}01} & {1{\cdot}23} & {2{\cdot}43} \cr }\right.\cr &\left.\matrix{ && {0{\cdot}92} & {1{\cdot}95} & {1{\cdot}82} & {2{\cdot}61} & {1{\cdot}28} & {0{\cdot}82} & {1{\cdot}78} & {1{\cdot}32} \cr && {1{\cdot}05} & {1{\cdot}61} & {2{\cdot}01} & {2{\cdot}09} & {2{\cdot}03} & {0{\cdot}79} & {2{\cdot}08} & {1{\cdot}98} \cr }\right]\cr { }_{15}X &=\left[ \matrix{ {29{\cdot}6} & {18{\cdot}5} & {15{\cdot}7} & {14{\cdot}3} & {32{\cdot}4} & {39{\cdot}0} & {15{\cdot}2} & {9{\cdot}1} \cr 2 & 2 & 4 & 1 & 4 & 3 & 3 & 2 \cr }\right.\cr &\left.\matrix{ && {11{\cdot}2} & {23{\cdot}0} & {18{\cdot}5} & {6{\cdot}7} & {7{\cdot}8} & {10{\cdot}0} & {8{\cdot}5} & {5{\cdot}2}\cr && 3 & 1 & 2 & 1 & 2 & 1 & 2 & 3 \cr }\right]\cr { }_{16}X &=\left[ \matrix{ 8 & 6 & {13} & 5 & {17} & {11} & {10} & 5 & {15} & 7 & 6 & 3 & 5 & 9 & 4 & 3 \cr 6 & 9 & {10} & 4 & {15} & {13} & 8 & 7 & {10} & 9 & 4 & 5 & 4 & 7 & 6 & 5 \cr } \right]\cr { }_{17}X &=\left[ \matrix{ {7{\cdot}5} & {20} & {21} & {4{\cdot}5} & {18} & {13} & 7 & 4 \cr {12{\cdot}5} & {10} & {9{\cdot}5} & 5 & {15} & {19} & {13} & 5 \cr }\right.\cr &\left.\matrix{ && {10{\cdot}5} & {11} & 5 & {4{\cdot}5} & {1{\cdot}5} & {11{\cdot}8} & {3{\cdot}7} & 4 \cr && {7{\cdot}6} & {8{\cdot}1} & 3 & {1{\cdot}8} & {3{\cdot}4} & {0{\cdot}5} & 4 & 5 \cr } \right]}$$
x 7 and x 8 are the cost types; others are the profit types. Since the variation of the objective eigenvalue is small, Equations (9) and (11) are selected. The optimal relative membership degree matrix of the first layer can be obtained as  ${ }_{1k}u (k=1,2,3,4,5,6,7)$:
 $$\eqalign{{ }_{11}u&=\left[ \matrix{ {0{\cdot}296} & {0{\cdot}444} & {0{\cdot}333} & {0{\cdot}222} & {0{\cdot}777} & {0{\cdot}370} & {0{\cdot}185} & {0{\cdot}481}\cr 0{\cdot}352 & 0{\cdot}441 & 0{\cdot}382 & 0{\cdot}235 & 0{\cdot}794 & 0{\cdot}411 & 0{\cdot}233 & 0{\cdot}500\cr } \right.\cr &\left.\matrix{ & & {0{\cdot}444} & {0{\cdot}925} & {0{\cdot}111} & {0{\cdot}148} & {0{\cdot}074} & {0{\cdot}851} & {0{\cdot}111} & {0{\cdot}185} \cr & & 0{\cdot}470 & 0{\cdot}882 & 0{\cdot}176 & 0{\cdot}235 & 0{\cdot}117 & 0{\cdot}823 & 0{\cdot}147 & 0{\cdot}235 \cr } \right]\cr { }_{12}u&=\left[ \matrix{ 0{\cdot}318 & 0{\cdot}500 & 0{\cdot}363 & 0{\cdot}227 & 0{\cdot}863 & 0{\cdot}500 & 0{\cdot}181 & 0{\cdot}454 \cr 0{\cdot}268 & 0{\cdot}460 & 0{\cdot}495 & 0{\cdot}612 & 0{\cdot}462 & 0{\cdot}656 & 0{\cdot}612 & 0{\cdot}508 \cr } \right.\cr &\left.\matrix{ && 0{\cdot}409 & 0{\cdot}909 & 0{\cdot}090 & 0{\cdot}181 & 0{\cdot}090 & 0{\cdot}681 & 0{\cdot}090 & 0{\cdot}136 \cr && 0{\cdot}595 & 0{\cdot}383 & 0{\cdot}493 & 0{\cdot}531 & 0{\cdot}643 & 0{\cdot}368 & 0{\cdot}435 & 0{\cdot}731 \cr } \right] \cr { }_{13}u&=\left[ \matrix{ 0{\cdot}497 & 0{\cdot}603 & 0{\cdot}589 & 0{\cdot}637 & 0{\cdot}507 & 0{\cdot}521 & 0{\cdot}570 & 0{\cdot}521 \cr 0{\cdot}295 & 0{\cdot}463 & 0{\cdot}451 & 0{\cdot}418 & 0{\cdot}270 & 0{\cdot}201 & 0{\cdot}408 & 0{\cdot}452 \cr } \right.\cr &\left.\matrix{ && 0{\cdot}454 & 0{\cdot}521 & 0{\cdot}574 & 0{\cdot}584 & 0{\cdot}391 & 0{\cdot}468 & 0{\cdot}362 & 0{\cdot}545 \cr && 0{\cdot}409 & 0{\cdot}394 & 0{\cdot}678 & 0{\cdot}576 & 0{\cdot}798 & 0{\cdot}382 & 0{\cdot}764 & 0{\cdot}359 \cr } \right]\cr { }_{14}u&=\left[ \matrix{ 0{\cdot}250 & 0{\cdot}631 & 0{\cdot}654 & 0{\cdot}415 & 0{\cdot}769 & 0{\cdot}590 & 0{\cdot}551 & 0{\cdot}259\cr 0{\cdot}304 & 0{\cdot}583 & 0{\cdot}664 & 0{\cdot}313 & 0{\cdot}723 & 0{\cdot}686 & 0{\cdot}618 & 0{\cdot}245 \cr } \right.\cr &\left.\matrix{ && 0{\cdot}728 & 0{\cdot}424 & 0{\cdot}463 & 0{\cdot}230 & 0{\cdot}622 & 0{\cdot}758 & 0{\cdot}474 & 0{\cdot}315 \cr && 0{\cdot}673 & 0{\cdot}500 & 0{\cdot}375 & 0{\cdot}350 & 0{\cdot}369 & 0{\cdot}754 & 0{\cdot}354 & 0{\cdot}385 \cr } \right] \cr { }_{15}u&=\left[ \matrix{ 0{\cdot}669 & 0{\cdot}418 & 0{\cdot}355 & 0{\cdot}323 & 0{\cdot}733 & 0{\cdot}882 & 0{\cdot}343 & 0{\cdot}205 \cr 0{\cdot}400 & 0{\cdot}400 & 0{\cdot}800 & 0{\cdot}200 & 0{\cdot}800 & 0{\cdot}600 & 0{\cdot}600 & 0{\cdot}400 \cr } \right.\cr &\left.\matrix{ && 0{\cdot}253 & 0{\cdot}520 & 0{\cdot}418 & 0{\cdot}151 & 0{\cdot}176 & 0{\cdot}226 & 0{\cdot}192 & 0{\cdot}117 \cr && 0{\cdot}600 & 0{\cdot}200 & 0{\cdot}400 & 0{\cdot}200 & 0{\cdot}400 & 0{\cdot}200 & 0{\cdot}400 & 0{\cdot}600 \cr } \right]\cr { }_{16}u&=\left[ \matrix{ 0{\cdot}400 & 0{\cdot}300 & 0{\cdot}650 & 0{\cdot}250 & 0{\cdot}850 & 0{\cdot}550 & 0{\cdot}500 & 0{\cdot}250 \cr 0{\cdot}315 & 0{\cdot}473 & 0{\cdot}526 & 0{\cdot}210 & 0{\cdot}789 & 0{\cdot}684 & 0{\cdot}421 & 0{\cdot}368 \cr } \right.\cr &\left.\matrix{ && 0{\cdot}750 & 0{\cdot}350 & 0{\cdot}300 & 0{\cdot}150 & 0{\cdot}250 & 0{\cdot}450 & 0{\cdot}200 & 0{\cdot}150 \cr && 0{\cdot}526 & 0{\cdot}473 & 0{\cdot}210 & 0{\cdot}263 & 0{\cdot}210 & 0{\cdot}368 & 0{\cdot}315 & 0{\cdot}263 \cr } \right]\cr { }_{17}u&=\left[ \matrix{ 0{\cdot}333 & 0{\cdot}888 & 0{\cdot}933 & 0{\cdot}200 & 0{\cdot}800 & 0{\cdot}577 & 0{\cdot}311 & 0{\cdot}177 \cr 0{\cdot}641 & 0{\cdot}512 & 0{\cdot}487 & 0{\cdot}256 & 0{\cdot}769 & 0{\cdot}974 & 0{\cdot}666 & 0{\cdot}256 \cr } \right.\cr &\left.\matrix{ && 0{\cdot}466 & 0{\cdot}488 & 0{\cdot}222 & 0{\cdot}200 & 0{\cdot}066 & 0{\cdot}524 & 0{\cdot}164 & 0{\cdot}177 \cr && 0{\cdot}389 & 0{\cdot}415 & 0{\cdot}153 & 0{\cdot}092 & 0{\cdot}174 & 0{\cdot}025 & 0{\cdot}205 & 0{\cdot}256 \cr } \right]}$$
The first layer weight vector is calculated according to Equation (17):
 $$\eqalign{{ }_{11}w &= (0\cdot4807, 0\cdot5193) \quad { }_{12}w= (0\cdot4207, 0\cdot5793) \quad{ }_{13}w= (0\cdot5328, 0\cdot4672)\cr { }_{14}w &= (0\cdot5074, 0\cdot4926) \quad{ }_{15}w= (0\cdot4541, 0\cdot5459) \quad{ }_{16}w= (0\cdot4972, 0\cdot5028)\cr { }_{17}w &= (0\cdot5100, 0\cdot4900)}$$
According to Equation (12), the optimal relative membership degree matrix of the second layer can be obtained:
 $$\eqalign{{ }_2u&=\left[ \matrix{ 0{\cdot}191 & 0{\cdot}386 & 0{\cdot}240 & 0{\cdot}081 & 0{\cdot}931 & 0{\cdot}295 & 0{\cdot}068 & 0{\cdot}482 \cr 0{\cdot}138 & 0{\cdot}448 & 0{\cdot}402 & 0{\cdot}463 & 0{\cdot}670 & 0{\cdot}692 & 0{\cdot}432 & 0{\cdot}479 \cr 0{\cdot}331 & 0{\cdot}581 & 0{\cdot}557 & 0{\cdot}580 & 0{\cdot}325 & 0{\cdot}297 & 0{\cdot}498 & 0{\cdot}483 \cr 0{\cdot}128 & 0{\cdot}764 & 0{\cdot}789 & 0{\cdot}252 & 0{\cdot}896 & 0{\cdot}752 & 0{\cdot}662 & 0{\cdot}102 \cr 0{\cdot}519 & 0{\cdot}321 & 0{\cdot}689 & 0{\cdot}105 & 0{\cdot}918 & 0{\cdot}841 & 0{\cdot}491 & 0{\cdot}192 \cr 0{\cdot}238 & 0{\cdot}292 & 0{\cdot}667 & 0{\cdot}082 & 0{\cdot}952 & 0{\cdot}719 & 0{\cdot}421 & 0{\cdot}171 \cr 0{\cdot}465 & 0{\cdot}817 & 0{\cdot}815 & 0{\cdot}080 & 0{\cdot}930 & 0{\cdot}871 & 0{\cdot}467 & 0{\cdot}072 \cr } \right.\cr &\left.\matrix{ && 0{\cdot}417 & 0{\cdot}987 & 0{\cdot}029 & 0{\cdot}057 & 0{\cdot}012 & 0{\cdot}963 & 0{\cdot}022 & 0{\cdot}068\cr && 0{\cdot}560 & 0{\cdot}602 & 0{\cdot}263 & 0{\cdot}343 & 0{\cdot}426 & 0{\cdot}457 & 0{\cdot}204 & 0{\cdot}539\cr && 0{\cdot}372 & 0{\cdot}434 & 0{\cdot}724 & 0{\cdot}658 & 0{\cdot}615 & 0{\cdot}365 & 0{\cdot}563 & 0{\cdot}432\cr && 0{\cdot}846 & 0{\cdot}423 & 0{\cdot}346 & 0{\cdot}145 & 0{\cdot}499 & 0{\cdot}906 & 0{\cdot}339 & 0{\cdot}225\cr && 0{\cdot}425 & 0{\cdot}221 & 0{\cdot}321 & 0{\cdot}046 & 0{\cdot}179 & 0{\cdot}066 & 0{\cdot}186 & 0{\cdot}346\cr && 0{\cdot}743 & 0{\cdot}332 & 0{\cdot}107 & 0{\cdot}068 & 0{\cdot}082 & 0{\cdot}324 & 0{\cdot}112 & 0{\cdot}068\cr && 0{\cdot}363 & 0{\cdot}408 & 0{\cdot}053 & 0{\cdot}033 & 0{\cdot}021 & 0{\cdot}200 & 0{\cdot}048 & 0{\cdot}072\cr } \right]}$$
Similarly, the second layer weight vector is obtained from Equation (17):
 $${ }_2w=(0{\cdot}1159,0{\cdot}1578,0{\cdot}1731,0{\cdot}1776,0{\cdot}1299,0{\cdot}1191,0{\cdot}1226)$$
The optimal relative membership degree vector of navigation risk in multi-objective and multi-layer high-risk sea areas are obtained by Equation (12):
 $$\eqalign{u_j &= ({0{\cdot}143,0{\cdot}564},{0{\cdot}680},{0{\cdot}182,0{\cdot}844},{0{\cdot}702},0{\cdot}450,0{\cdot}181,0{\cdot}588,0{\cdot}454, \cr &\quad 0{\cdot}235,0{\cdot}154, 0{\cdot}252,0{\cdot}493,0{\cdot}150,0{\cdot}174)}$$
According to the principle that the higher the optimal relative membership degree, the greater the navigation risk, the 16 sea areas can be ranked from high risk to low risk as follows: sea area 5, 6, 3, 9, 2, 14, 10, 7, 13, 11, 4, 8, 16, 12, 15, 1. Among them, the risk degree of sea areas 5, 6 and 3 is higher, and the risk degree of sea areas 12, 15 and 1 is lower.
5. TEST OF THE EVALUATION RESULTS BY THE DECISION MODEL
5.1. The verification from the perspective of real traffic
Since 1 June 2015, a new Traffic Separation Scheme (TSS) has been implemented in the waters of Chengshantou. On the eastern side of the original TSS, a new Outer Traffic Separation Scheme (OTSS) was added as shown in Figure 2, including the Outer Traffic Separation Lanes (OTSL) and the outer precautionary area. The OTSL are composed of the east, north and south traffic separation lanes and the separation zone. In the 16 sea areas of Chengshantou waters, sea areas 11, 12, 15 and 16 mainly include part of south traffic separation lane of the OTSL. Sea areas 3, 4, 7 and 8 mainly include parts of east, south and north traffic separation lanes of the OTSL and part of the outer precautionary area. Sea areas 1, 2, 5 and 6 mainly include the inner precautionary area, part of the outer precautionary areas and part of the north traffic separation lane of the OTSL. Sea areas 9, 10, 13 and 14 mainly include the south traffic separation lane of the original inner traffic separation lanes.
All ships entering and exiting Bohai Bay using the OTSS need to sail through sea areas 5, 6 and part of sea area 2. They encounter at the inner and outer precautionary area, where the ship traffic volume is large, the average ship spacing is small, collision avoidance manoeuvring is frequent and the encounter rate is high. Therefore, the collision risk is higher in these sea areas. The vessels sailing through sea areas 3 and 7 using the OTSS include ships sailing northward to Dalian Port and other ports in the north, some ships entering and exiting the Bohai Bay, ships sailing eastward to Japan and South Korea and ships sailing southward. In this area, the ship traffic volume, the angle of altering course and the ship scale are large, the ship manoeuvring is difficult, and the potential risk to safety of navigation is relatively higher. Sea areas 9 and 13 are close to the coast. There are many fishing boats in this area, resulting in smaller ship spacing and higher collision risk. The ship traffic volume in sea areas 10 and 14 is very large, resulting in an increase in the ship density. The proportion of some dangerous goods ships and large ships also rises in these areas which leads to higher collision risk. Although the tonnage of ships sailing in sea areas 11 and 12 is large, ships do not need to alter their courses. Since the encounter rate is low in these areas, the collision risk is low.
Using the platform, the 72-hour ship track distribution and the 12-hour overlapped graph of ship density in Chengshantou waters are shown in Figure 3. Figure 3(a) is the display of 72-hour track distribution according to course. Figure 3(b) is the display of 72-hour track distribution according to ship scale. Figure 3(c) is the display of 72-hour track according to ship type. Figure 3(d) is the 12-hour overlapped graph of ship density. From Figure 3, it can be observed that the 72-hour ship track distribution and the 12-hour ship density situation in Chengshantou waters is consistent with the above analysis of the traffic flow in 16 sea areas. In addition, the navigation risk analysis in the 16 sea areas is consistent with the decision model calculation results. Therefore, the model can be shown to be scientific and practical.
Display of 72-hour ship track distribution and 12-hour ship density in Chengshanjiao waters.

5.2. The verification from the perspective of fuzzy comprehensive evaluation model results
To further verify the results of the decision model, a fuzzy comprehensive evaluation model of the safety evaluation was selected, and the weight of each index was determined based on the improved Analytic Hierarchy Process (AHP), i.e., Fuzzy Analytic Hierarchy Process (FAHP). Following the advice of experts such as Zhaolin Wu, Dexin Liu and Yuhui Fu from Dalian Maritime University, the evaluation criteria of each index were determined and the corresponding membership functions were established. Finally, the fuzzy comprehensive evaluation was applied to the 16 sea areas one by one to determine their navigation risk. Among them, the evaluation level of the evaluation set is defined as:
 $$V=\lcub {v_1 ,v_2 ,v_3 ,v_4 ,v_5 } \rcub $$
where v 1 ~ v 5 represents the rating of the evaluation: very low risk, low risk, general risk, high risk, very high risk. Their corresponding fuzzy numbers are 1, 2, 3, 4 and 5.
Through the calculation, the membership degree of each sea area and the comprehensive evaluation results based on a weighted average are shown in Table 2.
Fuzzy comprehensive evaluation results.
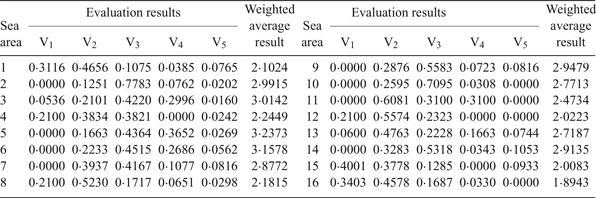
According to the principle that the larger the weighted average result, the higher the risk, the 16 sea areas can be ranked from high risk to low risk as follows: sea areas 5, 6, 3, 2, 9, 14, 7, 10, 13, 11, 4, 8, 1, 12, 15, 16. Comparing this ranking with the evaluation from the multi-objective and multi-layer fuzzy optimisation decision model (from high risk to low risk: sea area 5, 6, 3, 9, 2, 14, 10, 7, 13, 11, 4, 8, 16, 12, 15, 1), it can be found that the results of the two models are similar, although the sorting is different in some parts. This is mainly due to different weighting methods of the two model indices. The index weight of the decision model is objective, while the index weight of the fuzzy comprehensive evaluation model is subjective with preference for certain indices. However, the differences are so small that it can be accepted. Therefore, it can be concluded that the objective evaluation of the decision model is consistent with people's subjective understanding, which further validates the rationality and feasibility of the multi-objective and multi-layer fuzzy optimisation model.
6. CONCLUSIONS
This paper took Chengshantou open coastal waters as an example. The calculation results of the multi-objective and multi-layer fuzzy optimisation model were validated by evaluating results from real traffic data and a fuzzy comprehensive evaluation model. The results show that the decision model is scientific and practical and the decision results are convincing and feasible. With the model, navigation risk judgments in different sea areas can be offered. It can also provide decision making references for the design of ship routing systems, the layout of search and rescue sites, the configuration of rescue forces and the administration of navigation safety.
It is usually difficult to determine the supremum and the infimum of objective eigenvalues when making decisions by the optimal absolute membership degree model, resulting in subjective arbitrariness of decision making. Calculation of the objective optimal relative membership degree and the decision-making optimal relative membership degree by using the fuzzy optimisation model can effectively avoid the subjectivity of the optimal absolute membership degree model (Azadeh et al., Reference Azadeh, Gaeini, Motevali Haghighi and Nasirian2016; Pan et al., Reference Pan, She and Wei2016). In addition, the physical meaning of the model is clear, the theory of the model is rigorous and the calculation of the model is simple (Hu and Xu, Reference Hu and Xu2013). The decision model has good applicability and reliability, which can further enlarge the application of fuzzy optimisation models in navigation.
ACKNOWLEDGMENTS
This work was supported by the Fundamental Research Funds for the Central Universities (W.L., Grant number 3132017108).



