At its core, political science is the study of power. But empirical work on this fundamental subject is hampered by the fact that actually observing power is difficult. In this paper, we propose using newspaper coverage to address this obstacle. We introduce a dataset containing nearly 50 million historical newspaper pages from ~2700 local US newspapers distributed across a thousand counties over the years 1877–1977, and we use it to develop a newspaper-based measure of power. After laying out the measure, we validate it through a series of analyses that leverage historical reforms and other temporal and spatial changes in power across a wide range of political offices, including mayors, governors, members of Congress, and the presidency. As we show, the volume of news coverage devoted to particular political actors or offices helps indicate how important they are. We conclude that a careful analysis of news coverage is a plausible indicator of political power that applies to political actors and political offices over a wide time period and across many localities. In sum, researchers can use the techniques we develop herein to study political power in many contexts.
Our idea can be captured with a simple thought experiment. First (if you live in the United States), ask yourself: How many official state or local party leaders can I name? How many do I read about regularly in the newspaper? In all likelihood, the answer to both of these questions is “zero.” Why? Because these positions are not powerful—that is, they do not play much of a role—in contemporary US politics. Now imagine you were a voter in the late 1800s rather than the early 2000s, asking the same questions. If you lived in New York it is likely that you would have read about leaders such as Roscoe Conkling, Thomas C. Platt, John Kelly, or Richard Croker. Similarly, it is likely that you would have read about Simon Cameron or Matthew Quay if you lived in Pennsylvania, Zachariah Chandler if you lived in Michigan, John “Black Jack” Logan if you lived in Illinois, or Oliver P. Morton if you lived in Indiana. Why? Because these people mattered. They were powerful bosses who controlled access to many elected and appointed political offices in their states, and also had a significant impact on which laws were passed and which were defeated, both nationally and at home. As a result, they appeared regularly in newspaper stories.
We are not the first to see this link between newspaper coverage and power. Although media coverage stems from many sources—including the inevitable biases of newspapers themselves (Groseclose and Milyo Reference Groseclose and Milyo2005; Larcinese, Puglisi and Snyder Reference Larcinese, Puglisi and James M. Snyder2007; Gentzkow and Shapiro Reference Gentzkow and Shapiro2010; Puglisi and Snyder Reference Poole and Rosenthal2011), as well as the demands of readership (Mullainathan and Shleifer Reference Mullainathan and Shleifer2005; Gentzkow and Shapiro Reference Gentzkow and Shapiro2006)—previous scholars have observed that media coverage is positively associated with power. Galtung and Ruge (Reference Galtung and Ruge1965) identified a number of key factors that affect the “news value” of a potential story. Two of these factors are the size or impact of the story and the prominence of the actors involved. Events and actions that have the potential to affect a large number of people have greater news value, as are stories involving elite actors—powerful nations, people, and organizations. Almost by definition, actors with more power have more opportunities to take actions that affect a large number of people, and are therefore more likely to generate newsworthy events.Footnote 1 We build on the logic of this previous work in developing our measure.
We are well aware that individuals have many reasons to receive news coverage beyond power. Celebrities, for example, may not be politically powerful but will often be featured in the news. In subsequent parts of the paper we will discuss this issue and explain how we can avoid contaminating our analyses with this kind of entertainment coverage. One solution is to focus on individuals and political offices that do not attract this kind of coverage; another is to perform analyses that difference out such coverage. In addition, we are also keenly aware that some shadowy individuals use their power to avoid being covered in the news. Our approach will have little to say about these people, but the analyses we present will show that, despite this limitation, there is still much we can learn about politics from the volume of news coverage. Despite the presence of celebrity coverage, and despite the fact that there are surely powerful people who stay out of the news, the specific methods we develop shed light on the relative power of a variety of political offices and actors, and should be useful for future researchers studying a wide array of topics related to political power in media-rich environments.
The paper is organized as follows. First, we provide a conceptual overview of our measurement approach, defining the type of power we believe newspaper coverage can capture, discussing obstacles to the use of newspaper coverage, and explaining the interpretation of the quantitative scale we develop. Following this, in the next section we describe the dataset we have collected and the steps we have taken to process the raw text for analytic purposes. Subsequently, we validate the measure using four disparate cases: (i) comparing the relative coverage of congressional committees to the desirability of committees based on member transfer requests; (ii) examining coverage of members of Congress before, during, and after they are Speaker of the House; (iii) estimating the change in relative coverage of mayors in cities that change from a “strong mayor” (mayor-council) to a “weak mayor” (council-manager) form of government; and (iv) investigating the effect of the passage of a reform that stripped the Massachusetts Executive (Governor’s) Council of most of its powers on the relative coverage of the Council.Footnote 2 Having validated the measure, we briefly apply it to study the decline of state party organizations in order to showcase its value. Finally, we conclude by discussing how researchers can apply the measure to study a variety of questions in many contexts.
A MEASURE OF POLITICAL POWER FROM NEWSPAPER TEXT
In this section, we lay out the idea of using newspaper coverage to measure political power. We explain the logic of our measure, we discuss what kind of power it is likely to tap into, and we discuss its limits and how to interpret it.
Relative Newspaper Coverage to Measure Relative Power
There are many kinds, and many definitions, of power. Newspaper coverage will only reflect some of these.Footnote 3 Shadowy actors who use their influence to avoid media scrutiny, for one obvious example, cannot be directly studied using newspaper coverage.Footnote 4 But a simpler kind of political power will inevitably reveal itself in how often newspapers mention people and offices. In particular, what we will be able to measure is whether, and to what extent, various political actors and offices possess the necessary resources and authority to influence political outcomes, that is, to “matter” for the political process. To make this idea clearer, consider state party committees in the early 20th century. Many of these committees possessed important resources: they could choose candidates to stand for office, marshal campaign support for candidates, and, once elected, could direct economic resources to loyal party members through patronage. As a result of all these resources, state party committees were, in many cases, “powerful.”
A direct consequence of this kind of power is newsworthiness. Though newspapers have latitude to choose what they report on—and a variety of biases may lead them to omit certain stories—economic necessity and the logic of competition, as well as a basic desire to cover the news, compel them to, by and large, report on matters of consequence. Newspaper coverage of political actors and offices therefore reveals who is involved in matters of political consequence.Footnote 5
Our measure captures this idea. This is a relative measure; its meaning springs from careful comparisons made among relevant actors or offices. To make our idea precise, imagine two members of a state legislature; call them A and B. We can learn something about the relative influence of A and B by making comparisons of the form
 $$Relative\,\:Power\,of\,A{\equals}{{\,\#\,\,of\,Newspaper\,Mentions\,of\,A} \over {\,\#\,\:\,of\,Newspaper\,Mentions\,\:of\,A{\plus}\,\#\,\,of\,Newspaper\,Mentions\,of\,B}}.$$
Although newspapers will have many reasons to talk about A and B, overall, if A is mentioned more than B, it is likely that A matters more for the political process than B, and is therefore more powerful.
When Does Press Coverage Fail To Indicate Political Power?
Naturally, many other factors also affect news values. Among these, the entertainment value of the story seems particularly important. Stories that mainly cover subjects because of their special entertainment value will not inform us about political power, even if the subjects are political in nature.Footnote 6 This obstacle confines our idea to only an important subset of all political topics. Using newspaper coverage to measure power is best for actors who are inherently boring to most citizens. For example, except perhaps to a small number of political junkies, political party organizations and congressional committees are not entertaining. This is probably true even for congressional party leaders and mayors of all but the largest cities.Footnote 7
Supply-side theories of media bias also suggest a possible risk, although one that can be mitigated. The press may favor covering politicians or political groups with whom they share similar editorial and market interests, a process that may stem from the ideological preferences of media outlet elites (Demsetz and Lehn Reference Demsetz and Lehn1985; Bovitz, Druckman and Lupia Reference Bovitz, Druckman and Lupia2002) or of editors and journalists (Baron Reference Baron2006).Footnote 8 If this is the case, then a measure based on newspaper coverage cannot be interpreted simply as a measure of power, as the frequency of newspaper mentions may also be driven by the ideological preferences of those producing the news. However, the influence of any present supply-side effects can be reduced by ensuring an adequately balanced representation of newspapers (in our case, of both Democratic- and Republican-leaning newspapers) in the sample.
Issues such as these also constrain the ways researchers can use our newspaper-based measure. Raw counts of the mentions of political actors or offices are likely to be broadly informative—especially when aggregated over long time periods—but because of the many other reasons for coverage they will not be precise. As a result, the newspaper-based measure is likely to be more useful as a dependent variable in analyses where exogenous variation in explanatory variables of interest is present; this exogenous variation will help ensure that findings are not driven by the noise in the measure. An ideal way to use the measure is as an outcome variable paired with a strong research design. For example, in one of the analyses below, we probe how the news coverage of mayors changes after cities implement institutional reforms that reduce the authority of the mayor. In general, the amount of news coverage to the mayor may in part reflect some amount of celebrity/entertainment coverage. But the change in coverage before and after the reform will likely difference out this phenomenon, thereby telling us something about the effect of the reform on the newsworthiness of the mayor.
Making Valid Comparisons
The many other differences in news coverage also makes comparing the measure across actors and offices tricky. If we were to find, for example, that mayors receive more coverage than governors, we could not immediately conclude that mayors are more “powerful” than governors. Perhaps newspapers cover mayors more because local news is valuable to readers, instead. To be meaningful, any such cross-office (or cross-actor, or cross-time) comparison must hold other factors equal. In general, we do this by making within-context, within-time comparisons. Rather than compare mayors to governors, we might compare a mayor to her corresponding city council, for example. These two units occupy the same space at the same time, and as a result, differences in their local newspaper coverage are likely to be informative. While ensuring valid comparisons does limit the applicability of our measure, it can still tell us quite a bit. The relative powers of a variety of actors and offices at the same time and in the same place are at the heart of many of the deepest questions about political institutions.
Another way to make valid comparisons relies on quasi-random variation in an explanatory variable, rather than on directly holding time and context fixed. Imagine, for example, a randomized experiment where the outcome is our newspaper-based measure. Though the reasons for newspaper coverage will vary over time and across space, the randomization from the hypothetical experiment would ensure that this variation is unrelated, in expectation, to the treatment we are interested in studying. As a result we can use the measure for a variety of questions even when we cannot hold time and context fixed. Examples of this might include difference-in-differences designs that leverage state-level variation in institutional structure, such as studying the effects of term limits or campaign finance reform on the power of a variety of state political offices and actors.
Interpreting Relative Coverage: Cardinal or Ordinal?
Even once we have narrowed our focus to a set of comparisons that our newspaper-based measure can examine in a valid manner, we still must understand how to interpret resulting estimates. We think of our measure as being largely ordinal—that is, while we can learn a great deal about the relative power of actors or offices by measuring their relative newspaper coverage, it is not clear that the rate of coverage conveys cardinal information about relative power. Put differently, although in many cases the relationship between coverage and power is monotonic, there is no reason to suspect that it is linear. If A receives 50 percent more coverage than B then A is probably more powerful than B, but it is unlikely that A is exactly 50 percent more powerful than B.
In many cases it is not even clear what the statement “A is 50 percent more powerful than B” even means. That is, in many cases it will be impossible to generate a widely accepted cardinal measure of power because there is not even a widely accepted definition of cardinal power. Almost everyone would agree that the US President is more powerful than any individual US Senator or US House Representative. But how much more powerful? One hundred times as powerful, ten times as powerful, twice as powerful?
Power can sometimes be defined in cardinal terms, but only in particular cases and in the context of a highly stylized model. In weighted voting models, for example, the Shapley–Shubik index (Shapley and Shubik 1954) or the Banzhaf index (e.g., Banzhaf Reference Banzhaf1968) yield cardinal indices of “power.” But these indices focus solely on power that derives from voting—specifically, the probability that a given player will turn losing coalitions into winning coalitions. They ignore considerations such as the power to propose, the ability to bargain or to vote strategically in dynamic settings, or informational asymmetries. They are limited in scope as well, being designed mainly to study “divide the dollar” politics. Other models, such as the Baron–Ferejohn model, add proposal power and bargaining, but make assumptions that many find unpalatable, for example, that proposer are chosen randomly. There is even less agreement about how to define and model other sources of power, such as informational rents or the value of the “bully pulpit.”
The upshot is that in almost all circumstances, an ordinal measure of power is all we can hope for.
NEW DATASET ON NEWSPAPER TEXT
We collected our newspaper text from Newspapers.com. This archive contains the text of millions of newspaper pages generated via optical character recognition (OCR). Currently, the Newspapers.com archive has almost 99 million pages from over 3500 newspapers (they are constantly adding new material). Of these, Newspapers.com has a large amount of material—at least 10,000 pages covering five or more years—for about 700 newspapers. In this paper we use a stratified sample of 50 percent from the archive. We focus on the period 1877–1977, which contains the bulk of the data.Footnote 9
The OCR text is messy and requires considerable cleaning. We deal with this by processing the text with a set of cleaning rules (provided in the Online Appendix) and using regular expressions in our search strings. Using the cleaned text, we generate counts for a variety of relevant words and terms, depending on the political actor or office under study.Footnote 10 Though the remaining text surely contains errors that prevent us from perfectly capturing word frequencies, the validity tests below indicate that the remaining errors are not overly problematic.
VALIDATING THE MEASURE USING POWERFUL ACTORS AND OFFICES
Congressional Committees
In this subsection, we evaluate our measure in the context of congressional committees. Committees are not equally powerful. The Committee on Ways and Means, with its responsibility over taxation, tariffs, and other revenue-raising actions, has more jurisdiction, controls more money, and wields greater influence—all in all, more power—than, for example, the (now defunct) Committee on Merchant Marine. This power differential is also reflected by committee transfer requests. Some committee assignments are more desirable than others, due to committees’ differences in power and prestige. As Ray (Reference Puglisi and James M. Snyder1982) observes, members typically strive for assignments to committees they regard as stronger, and give up assignments they regard as weaker.
During the time period of our data, both parties deemed the Committees on Ways and Means, Appropriations, and Rules as the “exclusive” committees of the House. With few exceptions, members of exclusive committees cannot also serve on non-exclusive committees. The “exclusive” committee designation further reflects the desirability and power of these committees. These three committees, then, should rank at or near the top of any power ranking of Congressional committees.
We use the Groseclose and Stewart (Reference Groseclose and Charles Stewart1998) rankings as an alternative measure to check our power measure. Their method, building on the techniques used by Bullock and Sprague (Reference Bullock and Sprague1969) and by Munger (Reference Munger1988), constructs rankings based on the value members place on committees as reflected by committee transfers. Groseclose and Stewart do not claim to measure power, but instead aim to measure the “value” of committees. We would imagine the two are correlated, but not perfectly (e.g., some members may place a high value on a committee for pork-barreling reasons even through other committees have more “power” due to broader jurisdictions or jurisdictions over policies that affect more people). While their transfer-based ranking is not a direct measure of power, desirability tends to reveal power, and so this is a close measure that we can use to test our coverage-based power measure.
For this analysis we study newspaper coverage of 19 committees across our time period, 1877–1977. These 19 committees are the ones from the set analyzed by Groseclose and Stewart (Reference Groseclose and Charles Stewart1998) that are active throughout this period. For each committee, we collect the total number of mentions of each of these committees and standardize by dividing each count by the total number of mentions of all 19 committees.Footnote 11 Letting committee i be the total mentions of committee i, we define:
 $$Relative\,\:Coverage\,of\,Committee_{i} {\equals}{{Committee_{i} } \over {\mathop{\sum}\nolimits_{j{\equals}1}^{19} {Committee_{j} } }}.$$
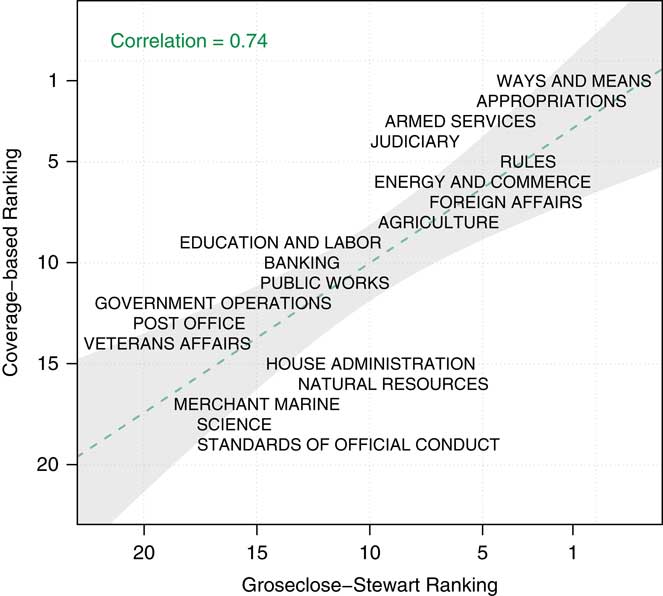
Figure 1 shows the Groseclose–Stewart ranking against our coverage-based ranking, calculated for the time period during which the two measures overlap. Most all of the committees lie around the 45° line, showing a close match between our ranking and the Groseclose–Stewart ranking. Indeed, the correlation between the two rankings is 0.74. Ways and Means, Appropriations, and Rules are ranked at the top as the top three, confirming their place as the most powerful and valued committees.
Committee rankings, 1949–1973 Note: The newspaper-based ranking of Congressional committees corresponds closely to the Groseclose–Stewart ranking based on member preferences.

Our coverage-based power measure, when applied to Congressional committees, is highly correlated with the Groseclose–Stewart ranking. While we reiterate that the Groseclose–Stewart ranking is based on measuring the desirability of committees, as discussed previously we believe that this is a relevant alternative measure with which we can compare our coverage-based power measure. Furthermore, we believe that several of the “outliers” go in our favor, which we discuss in detail in the Online Appendix.
Finally, there is a possible concern that both measures reflect only the behavior of legislators. If legislators seek out news exposure, then the correlation between the preference-based rankings and newspaper coverage may simply be an artifact of this behavior, regardless of why certain committees receive more coverage. Although we may have good reasons to think that press coverage focuses on more important committees, this concern reflects a general problem in correlating existing measures with our own. As a result, in the subsequent sections, we also investigate a variety of cases in which, rather than comparing measures, we look at observable de jure shifts in power and link them to changes in our measure.
Congressional Party Leaders
In this subsection, we use the news coverage of Speakers of the US House to validate our power measure for political actors. Political leaders are not randomly selected from the pool of legislators. Presumably leaders are selected because of their skills and qualities, and these in turn probably help them attract media attention. A simple comparison of the news coverage of leaders and rank-and-file legislators would pick up many systematic differences between the two groups that are not necessarily reflecting their power.
Instead we use a simple within-legislator design to validate our power measure. We focus on the group of legislators who serve as party leaders at some point in their career, and compare how they are covered in the newspapers before, during, and after the period in which they are in power. If news coverage is a good measure of power, we would expect to see a substantial increase in the coverage of individual members of Congress in the periods during which they serve as party leaders.
To implement this test, we search our newspaper database for the surnames of Speakers of the House and minority-party leaders from 1877 to 1977, and count how often they are covered in the news before, during, and after their leadership term. To reduce the number of false positives, we only count cases in which the word-stem “congress” appear within a window of five words from the surname, as well as cases in which one of the words “representative,” “rep.”, “hon.”, “speaker,” or “leader” appears immediately before the surname, and cases in which either of the party identifiers “(D)” or “(R)” appears immediately after the surname.Footnote 12
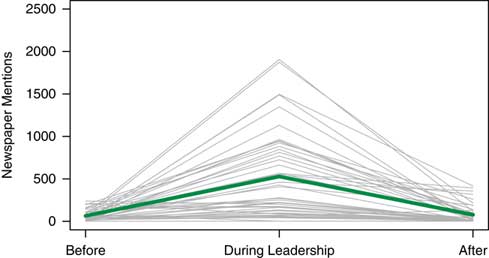
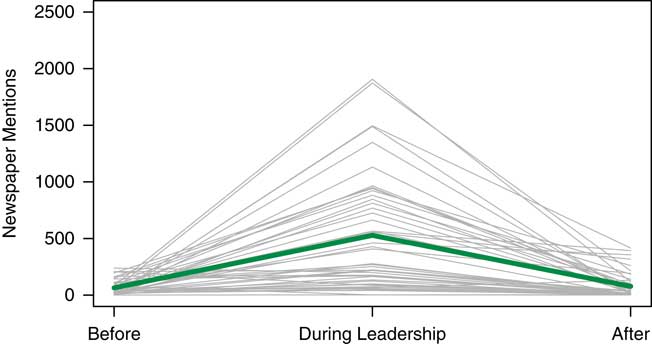
Figure 2 illustrates the main results. The figure plots in gray the number of mentions each Speaker of the House in our dataset receives before becoming Speaker, while serving as Speaker, and after serving as Speaker. A thicker green line indicates the average across all Speakers. As the figure shows, almost all members see a marked increase in coverage while they are Speaker. To examine the pattern more systematically, we count the number of hits for all Speakers and minority-party leaders and discuss this in the Online Appendix. Together, our findings on party leaders further support the idea that power is reflected in newspaper coverage.
News coverage of speakers of the house, before, during, and after speakership Note: Newspaper coverage increases, often dramatically, while members are in positions of power. Gray lines represent individual Speakers; thicker line (green for those viewing in color) indicates average across all observations.
Strong Versus Weak Mayors
We now turn to the analysis of “strong” versus “weak” mayors. Traditionally, cities in the United States operated under the mayor-council form of government. In this form (“strong mayor”) the mayor and city council are separately elected offices, and the mayor is the head of the executive branch, with broad powers to appoint and dismiss department heads, prepare, and administer the city budget, and so on. Beginning in the early 20th century and continuing through today, many cities switched to the council-manager form of government. In this form (“weak mayor”) the city council is the only directly elected body, and it appoints a city manager to oversee the operation of the executive branch. The mayor may be separately elected or selected by the city council from within its ranks, but has little or no executive authority. Some directly elected mayors have veto power, and some mayors have agenda-setting power inside the city council, but in many council-manager cities the position is largely ceremonial.Footnote 13 , Footnote 14 According to the Municipal Year Book, in 1984 about 56 percent of cities with populations over 2500 operated under the mayor-council form of government and about 35 percent operated under the council-manager form.Footnote 15
For this analysis we study newspaper coverage of three local offices: mayor, city council, and city manager. For each newspaper i we collect the total number of mentions of each of these offices in each year t. Denote these by Mayor it , Council it , and Manager it , respectively. We then construct three variables:
 $$\eqalignno{ & Relative\,\:Coverage\,of\,Mayor_{{it}} \,{\equals}\,{{Mayor_{{it}} } \over {Mayor_{{it}} {\plus}City\:\,Manager_{{it}} {\plus}City\,Council_{{it}} }}, \cr & Relative\,Coverage\:\,of\,City\,Manager_{{it}} \,{\equals}\,{{City\,Manager_{{it}} } \over {Mayor_{{it}} {\plus}City\,\:Manager_{{it}} {\plus}City\,Council_{{it}} }}, \cr & Relative\:\,Coverage\,of\,City\:\,Council_{{it}} \,{\equals}\,{{City\,\:Council_{{it}} } \over {Mayor_{{it}} {\plus}City\,Manager_{{it}} {\plus}City\,\:Council_{{it}} }}. $$
Since the position of city manager does not even exist in a city before the adoption of a council-manager form of government, coverage of this office may “automatically” increase. We therefore also construct a fourth variable that only compares the coverage of the mayor and the city council, both of which exist before and after the reform:
 $$Relative\:\,Coverage\,of\,Mayor\,Versus\,Council_{{it}} \,{\equals}\,{{Mayor_{{it}} } \over {Mayor_{{it}} {\plus}City\,\:Council_{{it}} }}.$$
We also identify the year in which the home city of each newspaper switched its form of government from the mayor-council form to the council-manager form. Some cities never switched, or switched in a year outside the period for which we have local newspaper coverage. These are not included in the figures, although they can be included in the panel regressions (to help estimate the year fixed effects).
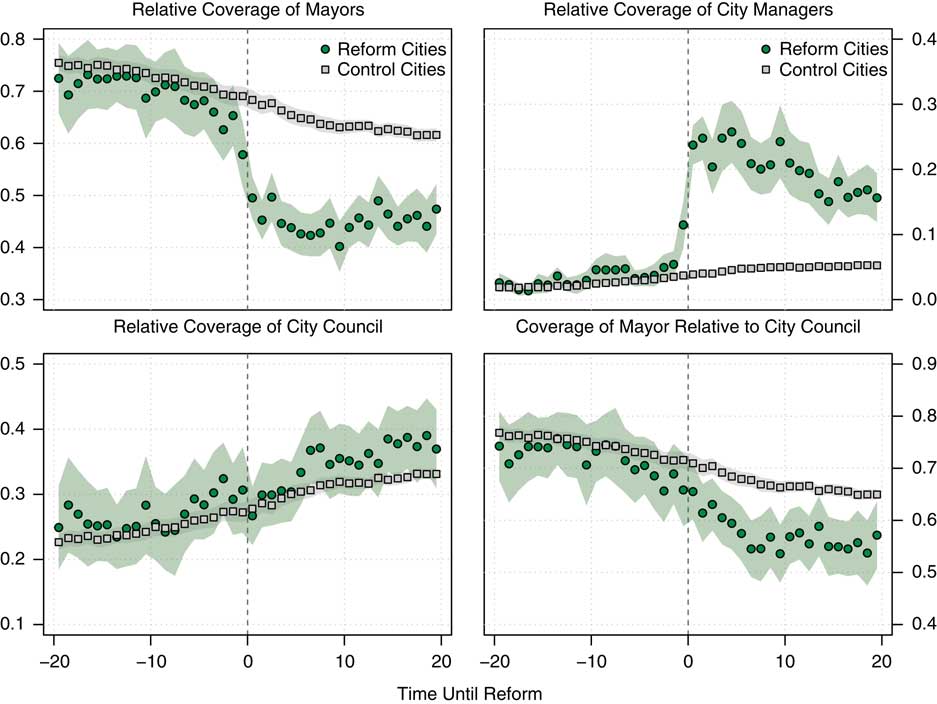
For each city, define year 1 as the first year the city operated under the council-manager form of government rather than the mayor-council form. Figure 3 shows the average values of the Relative Coverage variables over the 20 years before and after the changes in the form of government, pooling over all cities that switched. Two time series are displayed. The first, in green circles, reflects the “treatment path,” that is, treated cities before and after they enact the reform. The second series, in gray squares, represents the difference-in-differences “control" series. This is computed as the average, for each year, of all cities that have not enacted the reform yet.
Relative coverage of city offices over time Note: City government reforms are seen to reduce the measured power of mayors and increase that of city managers and city council members. Shaded regions represent 95 percent confidence intervals. Gray square points reflect annual averages for “control” cities that have not switched to the city manager form of government; green circles reflect annual averages for “treated” cities before and after they switch.

Evidently, there is a dramatic change in coverage due to the change in the form of government. The Relative Coverage of Mayor variable, plotted in the top left panel, falls sharply for reform cities, from about 80 percent of the mentions to only about 50 percent. This drop is much sharper than that displayed in the control cities over the same time period.
This is a large drop, and we are likely understating its magnitude due to several features of the data. First, some reforms occur earlier or later in the calendar year, so that the last year before “treatment” may be a combination of pre- and post-reform coverage. This is a likely reason why the final pre-reform point in the plot is somewhat lower than those before it. Second, though we have been careful to use contextual words to avoid too many false positive hits for “mayor,” we are likely to still be including a fair number, and these are more likely to present a higher proportion of this after reform than before it.
The Relative Coverage of City Manager variable, in the top right panel, increases sharply, from only about 5 percent of the mentions to more than 25 percent. Again, this change is far sharper than that displayed in the control cities. Again, we are likely understating the magnitude of this increase. The final pre-reform point, like in the previous plot, appears to be anticipating some of the effect of the reform—likely due in part to anticipatory coverage of the reform itself, but also because of the remaining errors of timing and false positives discussed in the previous paragraph.
It is less clear what to expect regarding Relative Coverage of City Council, although we might expect to see an increase in coverage since the city council is the body with the power to appoint and dismiss the city manager. The bottom left panel of Figure 3 shows that mentions of the city councils trend upward over the years before and after the switch to the council-manager form of government, although there is no discontinuous jump around the year the switch took place.
Finally, the bottom right panel of the figure investigates the coverage of mayors relative only to the city council. This addresses the possibility that there is a “mechanical” fall in the relative coverage of mayors, and a concomitant rise in the relative coverage of city managers, simply because the phrase “city manager” enters the public lexicon. Excluding city manager counts avoids this potential issue; we continue to see a decrease in the coverage of mayors after the reform.
Many of the mentions in a given city’s newspaper refer to the mayors, city managers, and city councils of other cities. This is one reason that Relative Coverage of Mayor remains at a rather high level even after a city switches to the council-manager form of government. In the Online Appendix, we attempt to improve the analysis by limiting attention to mentions in which the name of the newspaper’s home city appears near the relevant search string. The basic patterns are the same as above.
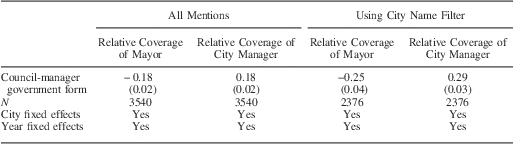
Table 1 presents regression results for the full set of cities in our sample (not just those that changed government form).Footnote 16 Let Council-Manager Govt Form it be 1 if city i operated under the council-manager form of government in year t and 0 if city i operated under the mayor-council form. We exploit the panel structure of the data, and the fact that different states adopted the reforms in different years, using a difference-in-differences approach. More specifically, we include city and year fixed effects in all specifications, and estimate models of the form:
 $$Relative\,\:Coverage\,of\,Mayor_{{it}} {\equals}\alpha _{i} {\plus}\theta _{t} {\plus}\beta \,Council\,Manager\,\:Govt\,Form_{{it}} {\plus}{\epsilon}_{{it}} .$$
Impact of Switch from Mayor-Council to Council-Manager City Government

Note: Results from a difference-in-differences design suggest that the reform causes a large decrease in the relative coverage of mayors.
Standard errors, clustered by city, are in parentheses.
Not surprisingly, the estimates confirm the patterns shown in Figure 3, and also show that the estimated changes in Relative Coverage are statistically significant. The Relative Coverage variables appear to capture rather well the clear change in relative power associated with the changes in city government structure. In the Online Appendix, we also re-estimate these results including city-specific time trends to relax the “parallel-trends” assumption; results are highly similar.
The Massachusetts Executive (Governor’s) Council
The Massachusetts Governor’s Council, also known as the Executive Council, is composed of eight individuals elected from districts (plus the Lieutenant Governor who serves ex officio). The eight councilors are elected from their respective districts every two years.
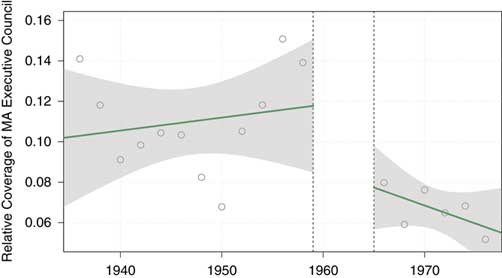
In 1964, Massachusetts voters passed a ballot question that stripped the Executive Council of its statutory powers (the changes went into effect on December 3, 1964). The reform followed a scandal in the late 1950s and early 1960s involving the sale of judicial positions; five members of the council were eventually indicted on bribery and corruption charges. Prior to this, the governor needed to obtain the Council’s approval for almost all gubernatorial appointments, all highway and waterway contracts, all land-taking by eminent domain, all state leases and rentals, to determine which banks could hold state funds in deposit, and to determine which out-of-state insurance companies could operate in the state. Starting in December 1964, the governor did not need Council approval for these actions. The main powers left to the Executive Council were its constitutionally mandated powers, most prominently the power to confirm judicial appointments and pardons.
Most observers viewed the reform as a significant shift in power from the Executive Council to the governor’s office. One journalist wrote: “stripping the council of all its statutory powers … effectively gives the governor full and complete rein over the administrative functions of the state government” (Micciche Reference Trench1964). Another noted that the next governor will have “more power than any since those of Colonial times … wide appointive and contractual powers previously controlled by the Executive Council – and a four-year term in which to exercise them,”Footnote 17
The variables and analysis are analogous to those in the previous subsection. Summing over all available Massachusetts newspapers, we collect the total number of mentions of Executive Council or Governor’s Council and the total mentions of Governor in each year t.Footnote 18 Denote these by Executive Council t and Governor t . We then construct the variable:
 $$Relative\:\,Coverage\,of\,Executive\,Council_{t} {\equals}{{Executive\,Council_{t} } \over {Executive\,Council_{t} {\plus}Governor_{t} }}.$$
We drop the years of the scandal since some of the coverage of the Executive Council was about the scandal itself. In fact, Relative Coverage of Executive Council is higher during those years than during the 1957–1958 period.
Figure 4 presents the results. In the figure, we plot the relative coverage using the full universe of newspapers in our dataset. We see that there is a notable drop in the relative coverage of the council after the reform.Footnote 19
Relative coverage of the Massachusetts Executive Council over time Note: The reform that stripped the Massachusetts Executive Council of its powers appears to decrease the coverage of the Executive Council relative to that of the Governor, who absorbed the power previously held by the council. The plot omits the years 1959–1965, during which discussion of the council spiked because of the scandal.

Summary
In this section, we have presented a variety of analyses that suggest that we can use newspaper coverage to measure the relative power of political actors. First, newspaper coverage of Congressional committees appears to offer an accurate view of which committees are more powerful, and more sought after by members of Congress, than others. Second, newspaper coverage of members of Congress increases markedly when those members become Speaker of the House, and falls when they stop being Speaker. Third, city government reforms that reallocate power from the mayor to the city manager and city council appear to cause a sharp decrease in newspaper coverage of mayors and a simultaneous rise in the coverage of the newly empowered actors. Fourth, a reform to the MA Executive Council that stripped it of many of its powers appears to produce a marked decrease in newspaper coverage of the council. We also present a fifth example on the transfer of tariff-related power between Congress and the president in the Online Appendix. Taken together, these validity tests suggest, first, that newspaper coverage is a meaningful indicator of political power and, second, that it is applicable to a broad set of political offices and contexts.
WHEN DID STATE PARTY COMMITTEES DECLINE? A BRIEF EXAMPLE APPLICATION
Having validated our newspaper-based measure of power, we now offer a brief example of its value by applying it to study the power of state and local party committees across US history. There is a pervading sense that these committees were once powerful but no longer are, but it is difficult to identify the precise timeframe over which this decline occurred (if, indeed, it did).
To measure the relative power of state and local party committees, we proceed as follows. First, for each state i and year t, define Party Mentions it as the total number of times, summing across all newspapers in the state, that the following occurs: the word “committee” appears after either the word “Democratic” or “Republican” or “GOP” (within five words), and after one of the words “state” or “county” or “district” or “local” or “central” or “executive” or “regular” or “organization” (within five words).Footnote 20 This is designed to capture all references to committees such as the Illinois Democratic state central committee, the Montgomery county Republican executive committee, and so on.
Next, for each state i and year t, define Candidate Mentions it as the total number of times, summing across all newspapers in the state, candidates for major offices (governor, US senator, and US representative) are mentioned. To do so, we look for the use of the word-stem “candidate,” counting only the cases where this word appears near a mention of one of the relevant political offices. Then, we define:
 $$Relative\,\:Party\,Mentions_{{it}} \,{\equals}\,{{Party\,Mentions_{{it}} } \over {Party\,Mentions_{{it}} {\plus}Candidate\,\:Mentions_{{it}} }}$$
The idea is simple. We want to assess the power of parties relative to a counterfactual—that is, if parties were to lose power, where would the power go? The natural counterfactual to party organizations is candidate-centered politics. Thus, we measure the power of state and local party organizations by assessing how often they are mentioned relative to how often candidates, themselves, are mentioned. Obviously, candidates will tend to be mentioned more, simply due to their volume—that is, this measure will tend to be closer to 0 than to 1. But comparisons across the measures—either across states, times, or newspapers—will tell us something about the context in which candidates versus party organizations matter relatively more or less.
Patterns of Party Committee Power Over Time
Most scholars argue that state party organizations were especially powerful in the late 19th century. For example, Reichley (1992, 129–30) notes that in the late 1800s: (i) under the leadership of Matthew Quay, the Pennsylvania Republican state party committee received 2 percent of the salaries of all patronage workers, giving the organization a budget of about $24 million per year to pay about 20,000 full-time and part-time party workers; (ii) similarly, the state Republican organization built by Thomas C. Platt raised about $20 million per year and funded about 10,000 workers; (iii) similar state Republican organizations were built in Illinois, Michigan, Ohio, and Wisconsin; (iv) smaller organizations were also maintained in some of the great plains states.
Many city and county-based organizations continued as powerful patronage machines much longer—in some cases through the 1950s and even into the 1960s. Powerful urban party organizations existed in New York City, Chicago, Philadelphia, Pittsburgh, St. Louis, Baltimore, Cleveland, Memphis, New Orleans, Albany, Pittsburgh, Kansas City (MO), Jersey City, Hartford, New Haven, and a host of others; strong suburban organizations existed in Nassau and Suffolk counties (NY), Bucks, Delaware and Montgomery counties (PA), and elsewhere (see e.g., Josephson Reference Josephson1963; Kehl Reference Kehl1981; Mayhew Reference Mayhew1986).
Some states had powerful state or local organizations in the late 19th and early 20th centuries that collapsed during or shortly after the progressive era. In California, for example, the Southern Pacific Railroad controlled both of the major state parties in the late 1800s, and Abe Rouf ran a powerful party machine in San Francisco in the early 1900s (by far the largest city in the state at the time). As Macy put it, “California has long been classed with Pennsylvania as a State ruled by the Republican machine” (Reference Macy1918, 198).
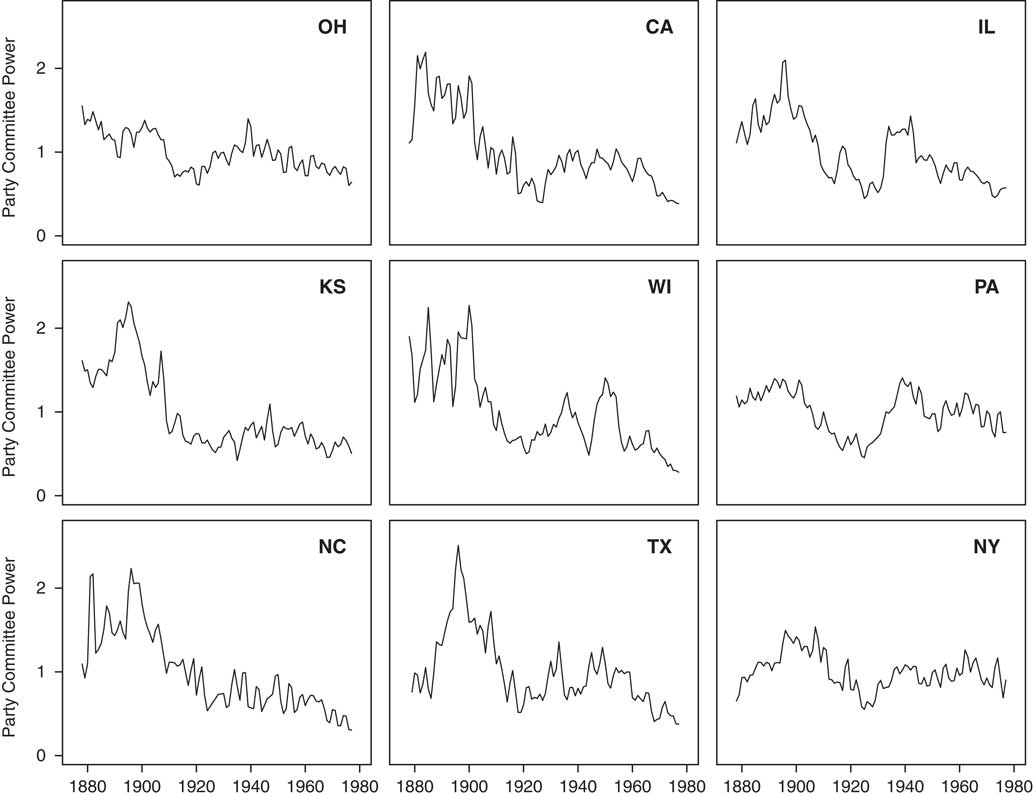
Figure 5 shows scatterplots of Relative Party Mentions over time in nine states. Overall, the measure seems consistent with many salient patterns identified in the literature. The general decline over time is clear, but in some states—for example, New York, Ohio, and Illinois, three states with Mayhew (Reference Mayhew1986) TPO scores of 5 in the late 1960s—the decline is much less pronounced. Our analysis thus suggests that there has indeed been a steady decline in the power of state party organizations, but that this decline has been uneven across states.
Party committee power over time in nine US States Note: Plots our coverage-based measure of state party committee power over time for Ohio, California, Illinois, Kansas, Wisconsin, Pennsylvania, North Carolina, Texas, and New York

CONCLUSION
In this paper, we have argued that we can use newspaper coverage of relevant political actors as a measure of their political power, under certain conditions. We have introduced a dataset of over 50 million historical US newspaper articles, and we have validated our resulting measures of political power in a variety of ways. We have shown that newspaper coverage of political actors decreases in times when they hold less powerful positions and increases when they hold more powerful ones, and we have shown that the measure correlates well with several existing measures of particular forms of political power.
We believe the measure has several strengths that will make it valuable for future work. First, the measure is historically comprehensive, covering an important 100-year period of American history. This period covers all manner of reform and upheaval in the American political process, including two world wars, the expansion of suffrage, Prohibition, the progressive reforms, McCarthyism, the Voting Rights Act, and Watergate, among many others. The study of all these events, and many more, concerns fundamental questions about who holds power, when they hold it, and why they are able to do so.
Second, the measure is broadly applicable; in our validity tests, we apply it to Congressional committees, to Congressional leaders, to the president, and to local municipal governments—a set that spans a variety of offices as well as individual actors. There is no reason to think it could not be extended further, to other political actors and other offices in other contexts. The measure can therefore facilitate further research in well-developed fields (e.g., Congress, the bureaucracy), and also encourage new research in contexts that have received less scholarly attention (e.g., local government).
Of course, the measure is not without its limitations. While in many instances coverage may indicate political power, it also results from other sources, such as “celebrity” coverage. In many applications this may mainly add noise to the measure, which is not overly problematic when it is used as a dependent variable in an analysis. In cases where the political actor or office in question has significant personal appeal or celebrity status, however (e.g., the US president) the measure is likely to break down. Researchers who apply our measure in other contexts must always take care to validate its use and consider alternative explanations for how the measure fluctuates.
Because power is at the core of political science, measuring it in data is an important task for empirical researchers. The newspaper-based measure we have put forward in this paper offers researchers a chance to study power in American politics in a variety of ways. In addition, the arguments we have made, and the validity tests we have performed, should aid researchers in constructing similar newspaper-based measures for other countries and other time periods. Though newspapers have many reasons to publish what they do, the overall frequency with which they cover political actors indicates who is powerful.