1 Introduction
The formation, break-up, deposition and re-entrainment of agglomerates are of major interest in several fields of science and industry. Medical relevancy, such as the formation of thrombosis or atherosclerosis, pollution transport in the atmosphere and flow assurance in the oil and gas industry are only a few examples of where these processes play a role. To predict if, where and/or when these phenomena will occur, simulations using numerical models are a versatile and cost-effective modality. To keep the effort that is required to conduct such simulations tractable, however, simplifications need to be made, either in the scope of the problem statement, or in the representation of the microscopic phenomena. It is our aim to bridge the gap between simulations with a detailed description of agglomeration and break-up (that are present in the literature as will be described shortly) and turbulent flows.
Meakin & Jullien (Reference Meakin and Jullien1988) numerically studied the formation of agglomerates for three different regimes, fully resolving the structure of the agglomerates in time. These regimes are: random-walk-induced collisions between particles and/or agglomerates, with a collision efficiency of unity (diffusion limited agglomeration); collisions induced by linear motion, also with uniform collision efficiency (ballistic agglomeration); and rotating two agglomerates over random angles, bringing a pre-defined pair of primary particles into contact, and rejecting the agglomeration event if other primary particles of the agglomerates overlap (reaction limited agglomeration). The different regimes lead to agglomerates with fractal dimensions of approximately 1.80, 1.95 and 2.10, respectively. Meakin & Jullien (Reference Meakin and Jullien1988) also studied how the fractal dimension of the agglomerates changes when restructuring of the agglomerates is allowed for a short period after the initial contact is formed. Maximum fractal dimensions of 2.18, 2.19 and 2.25 were found under those conditions, respectively.
Richardson (Reference Richardson1995) studied the formation of agglomerates from an initial state of randomly dispersed primary particles with a random velocity distribution. Different levels of detail were taken into account by Richardson, with the simplest representing all agglomerates by spheres with different masses but identical radii and the most detailed representing the full structure of the agglomerates. Large variations in the agglomeration dynamics between these levels of detail were found, leading to the conclusion that aggregates grow and collide much more effectively than single particles, owing to their complex shape. Mäkinen (Reference Mäkinen2005) constructed a model similar to that of Richardson and also determined the stress in the bonds between the individual primary particles.
Chen & Doi (Reference Chen and Doi1999) studied the dissociation of aggregating colloids in strongly sheared flows, at low Reynolds numbers. Ernst, Dietzel & Sommerfeld (Reference Ernst, Dietzel and Sommerfeld2013) used lattice Boltzmann simulations to fully resolve the flow primary particles that are settling in a quiescent fluid. Due to the very fine grid resolution required, only a very limited number of primary particles can be used in such simulations; therefore, Ernst et al. used only 50 particles. Zinchenko & Davis (Reference Zinchenko and Davis2014) studied a similar system, using a multipole solution technique for the Stokes flow around the agglomerates, with agglomerates that consisted of up to 100 primary particles. Derksen (Reference Derksen2008) studied the forces induced in the bond inside a sphere doublet that is immersed in a turbulent flow, but did not study the dynamics of the formation and/or break-up of the agglomerate.
In the literature that deals with the formation and/or break-up of agglomerates in turbulent flows (e.g. Brunk, Koch & Lion Reference Brunk, Koch and Lion1998; Flesch, Spicer & Pratsinis Reference Flesch, Spicer and Pratsinis1999; Reade & Collins Reference Reade and Collins2000; Babler Reference Babler2008; de Bona, Lanotte & Vanni Reference de Bona, Lanotte and Vanni2014; Babler et al.
Reference Babler, Biferale, Brandt, Feudel, Guseva, Lanotte, Marchioli, Picano, Sardina, Soldati and Toschi2015), it is commonplace to neglect the internal agglomerate structure, for instance by using population balance equations. Exception to this are the works of Derksen (Reference Derksen2012) and Dizaji & Marshall (Reference Dizaji and Marshall2016). Derksen (Reference Derksen2012) used an immersed boundary method to model the interaction between homogeneous isotropic turbulence and the process of agglomeration in detail. In that work, a square-well potential is used to model the particle–particle interactions and a maximum of 5000 primary particles is considered that form agglomerates that consist of up to 150 primary particles. Dizaji & Marshall (Reference Dizaji and Marshall2016) studied the formation and break-up of agglomerates in homogeneous turbulence using a discrete element method, with little under 47 000 particles in a cubic box. Agglomerates that consist
 $O(200)$
primary particles are formed, with a fractal dimension of 2.3. Both Derksen (Reference Derksen2012) and Dizaji & Marshall (Reference Dizaji and Marshall2016) did not study how the presence of the agglomerates affect the turbulence, however.
Bridging the gap between a detailed description of agglomeration and break-up and turbulent flows allows us to assess whether the universality of agglomerate properties that are formed under no-flow or non-turbulent flow conditions still holds if the flow is turbulent. It will also reveal what changes the presence of a dispersed phase that undergoes agglomeration and break-up impose upon the turbulent flow itself. Two typical flow geometries used in numerical turbulence studies (namely an infinite channel and a cylindrical pipe) will be considered to study whether the shape of the flow domain has any influence on the results. We focus our study on agglomerates that have a very small relative inertia compared to the fluid phase.
2 Theory and methods
2.1 Model basis
The basis of our model is given by an existing particle-laden finite-volume code, called Direct Eulerian–Lagrangian Flow Turbulence (DELFT) (Portela & Oliemans Reference Portela and Oliemans2003). This code was built as an extension of single-phase finite-volume codes for pipe and channel flows (Eggels Reference Eggels1994; Pourquié Reference Pourquié1994; Boersma Reference Boersma1997; van Haarlem Reference van Haarlem2000) and it can be used both for Direct Numerical Simulations (DNS) and Large Eddy Simulations (LES). In the LES mode, the Smagorinsky model, together with van Driest damping of the eddy viscosity near the walls, is applied to account for the sub-grid turbulence scales.
From a computational perspective, resolving the flow around the individual agglomerates is not a viable option. Instead, the dispersed phase is solved using a point-particle method based on the particle source in cell approach (Chen, Kontomaris & McLaughlin Reference Chen, Kontomaris and McLaughlin1999), which allows for simulations with one-way and two-way coupling. For efficient detection of particle collisions it uses a methodology similar to the one used by Li et al. (Reference Li, McLaughlin, Kontomatis and Portela2001), described in detail by Chen et al. (Reference Chen, Kontomaris and McLaughlin1999). The DELFT code was used in numerous studies (e.g. Portela, Cota & Oliemans Reference Portela, Cota and Oliemans2002) and the point-particle method, with small variations among different authors, is now a standard approach (Marchioli et al. Reference Marchioli, Soldati, Kuerten, Arcen, Tanière, Goldensoph, Squires, Cargnelutti and Portela2008).
2.2 Model for particle–particle collisions
Physically, the probability of particles adhering during a collision event depends on the relative time scales involved with the adhesion process and with the particle contact. Since these time scales are much smaller than the largest time scale present in the turbulent flow (which determines the time that needs to be simulated to get a decent statistical accuracy), it is computationally not feasible to model the inter-particle collisions in microscopic detail. Instead, a collision efficiency equal to unity is assumed (the ‘hit-and-stick’ approach). As we only consider agglomeration in competition with break-up, the simplification from a pragmatic perspective is a fair approximation, as, at least to some extent, physically improper agglomeration events will quickly be undone by the break-up of the bonds formed.
All collisions are considered to be purely inelastic, conserving both linear and angular momentum. From time step to time step, the agglomerate motion is described by a superposition of the linear velocity of the centre of mass of the agglomerate and the rotation of the agglomerate around its centre of mass. Within time steps, a second-order accurate approximation of the primary particle trajectory is used to determine which primary particles collide at what moment. These collisions are processed consecutively as they occur, irrespective of the time step used for agglomerates that momentarily do not undergo collisions. The inter-particle bonds are considered to have an infinite resistance to deformation, resulting in agglomerates that are rigid up to the point where the bonds between individual particles are broken. Further details about the method can be found in Schutte (Reference Schutte2016).
2.3 Hydrodynamic forces acting on dispersed phase
The motion of a particle, that is dispersed inside an unsteady flow at small Reynolds numbers, is well described by the Basset–Boussinesq–Oseen equation, which, neglecting the Faxen force (viz. flow non-uniformity), is given by (Crowe, Sommerfeld & Tsuji Reference Crowe, Sommerfeld and Tsuji1997):
 $$\begin{eqnarray}\displaystyle & & \displaystyle \unicode[STIX]{x1D70C}_{p}\frac{4\unicode[STIX]{x03C0}R_{p}^{3}}{3}\frac{\text{d}\boldsymbol{U}_{p}}{\text{d}t}=\underbrace{6\unicode[STIX]{x03C0}\unicode[STIX]{x1D707}_{f}R_{p}(\boldsymbol{U}_{f}-\boldsymbol{U}_{p})}_{drag}+\underbrace{\frac{\unicode[STIX]{x1D70C}_{f}}{2}\frac{4\unicode[STIX]{x03C0}R_{p}^{3}}{3}\left(\frac{\text{D}\boldsymbol{U}_{f}}{\text{D}t}-\frac{\text{d}\boldsymbol{U}_{p}}{\text{d}t}\right)}_{added\;mass}\nonumber\\ \displaystyle & & \displaystyle -\,\underbrace{\frac{4\unicode[STIX]{x03C0}R_{p}^{3}}{3}(\unicode[STIX]{x1D735}P-\unicode[STIX]{x1D735}\boldsymbol{\cdot }\unicode[STIX]{x1D64F})}_{pressure\;gradient}+\underbrace{6\sqrt{\unicode[STIX]{x03C0}\unicode[STIX]{x1D70C}_{f}\unicode[STIX]{x1D707}_{f}}R_{p}^{2}\int _{t_{0}}^{t}\frac{1}{\sqrt{t-\unicode[STIX]{x1D70F}}}\left[\frac{\text{d}\boldsymbol{U}_{f}}{\text{d}\unicode[STIX]{x1D70F}}-\frac{\text{d}\boldsymbol{U}_{p}}{\text{d}\unicode[STIX]{x1D70F}}\right]\text{d}\unicode[STIX]{x1D70F}}_{history\;force}+\boldsymbol{F}_{other},\qquad\end{eqnarray}$$
where
 $R_{p}$
is the primary particle radius,
 $\unicode[STIX]{x1D707}_{f}$
the fluid viscosity and
 $\unicode[STIX]{x1D70C}_{p}$
and
 $\unicode[STIX]{x1D70C}_{f}$
denote the density of the dispersed and fluid phases, respectively.
 $P$
presents the pressure and
 $\unicode[STIX]{x1D64F}$
is the stress tensor in the fluid. The fluid-phase velocity
 $\boldsymbol{U}_{f}$
is evaluated at the location of the particle centre. The other forces, represented by
 $\boldsymbol{F}_{other}$
, may include external forces, such as the gravitational force or an electromagnetic force, or other fluid forces, such as the lift force.
We are particularly interested in simulating upward vertical flows of systems that have density ratios between the dispersed and continuous phases close to one. As a result, gravity does not have a component in the wall-normal direction, and the streamwise gravity-induced slip velocity of the particles is negligible when compared to typical turbulent velocity fluctuations. Likewise, it is expected that the influence of the lift force is small, such that this force can also be neglected. The only force acting on the dispersed phase considered in this work is the drag force, corrected for the added-mass effect.
The drag force is approximated using Stokes drag, without accounting for shielding effects for primary particles that are close to each other (the ‘free-draining’ approximation). Due to the high local particle concentration inside the agglomerates, shielding effects in reality will have an substantial impact on the force exerted on the primary particles. This effect, however, is complex to model, and computationally very costly to evaluate. Taking it into account would prevent simulating large ensembles of primary particles in turbulent flows within tractable simulation time, as is shown by the state of the art in the literature. Therefore, these detailed local particle–fluid interactions have not been taken into account in our model.
In general, one may expect that the drag force on a particle that is directly exposed to the flow is slightly enhanced due to the presence of a sheltered particle downstream of it, whereas the drag force on the sheltered particle itself can significantly decrease. The overestimation of the total drag force introduced by neglecting these effects is partly compensated by the fact that we use Stokes drag to compute the drag force on individual primary particles. For typical values of the particle Reynolds numbers in our work (up to 10), the Stokes drag approximation underestimates the drag force on a single sphere.
As a final simplification, we neglect the material derivative of the fluid velocity in the added-mass term. This simplification is made for reasons of computational efficiency, as it greatly reduces the number of fluid velocity interpolations that need to be made for all primary particles during each time step. Equation (2.1) then reduces to:
 $$\begin{eqnarray}\breve{\unicode[STIX]{x1D70C}}_{p}\frac{4\unicode[STIX]{x03C0}R_{p}^{3}}{3}\frac{\text{d}\boldsymbol{U}_{p}}{\text{d}t}\equiv \boldsymbol{F}_{p}=6\unicode[STIX]{x03C0}\unicode[STIX]{x1D707}_{f}R_{p}(\boldsymbol{U}_{f}-\boldsymbol{U}_{p})\quad \text{with }\breve{\unicode[STIX]{x1D70C}}_{p}=\left(\unicode[STIX]{x1D70C}_{p}+\frac{\unicode[STIX]{x1D70C}_{f}}{2}\right),\end{eqnarray}$$
where
 $\breve{\unicode[STIX]{x1D70C}}_{p}$
can be seen as the effective density of the dispersed phase corrected for the added-mass effect. We have verified that the properties of the steady-state agglomerate population formed do not change significantly when the lift force and the full formulation of the added mass are included in the model, showing that the simplifications made above are reasonable. Order of magnitude estimates that support this result are available online in the supplementary material at https://doi.org/10.1017/jfm.2018.716.
2.4 Break-up
Macroscopically, five principal modes of stress which can give rise to the structural failure of a rigid body can be distinguished: buckling, straining, shearing, bending and twisting. Buckling and straining are associated with the normal component of the force exerted on the body, and shearing with the tangential force component. Bending and twisting are associated with the normal and tangential components of the exerted torque, respectively. On a microscopic level, shearing, bending, twisting and buckling may lead to internal restructuring of the material (which cannot be taken into account by our model), but by itself, this will not lead to macroscopic failure of the body. Therefore, we consider inter-particle bonds to be broken only when they are at least infinitesimally strained. This ensures that the resulting fragments move apart after the break-up event.
The internal stresses in the bonds between the primary particles are computed by equating the mass times the acceleration of the individual primary particles to the force balance over the respective particles themselves. This technique was also used by Mäkinen (Reference Mäkinen2005):
 $$\begin{eqnarray}m_{p}\frac{\text{d}\boldsymbol{U}_{p}}{\text{d}t}=m_{p}\left(\frac{\text{d}\boldsymbol{U}_{cm}}{\text{d}t}+\frac{\text{d}\unicode[STIX]{x1D734}}{\text{d}t}\times \boldsymbol{r}_{p}+\unicode[STIX]{x1D734}\times \frac{\text{d}\boldsymbol{r}_{p}}{\text{d}t}\right)=\boldsymbol{F}_{p}+\mathop{\sum }_{b}\boldsymbol{F}_{b},\end{eqnarray}$$
where the subscript
 $cm$
denotes the centre of mass and
 $\unicode[STIX]{x1D734}$
the angular velocity of the agglomerate. The summation in (2.3) runs over all bonds the particle
 $p$
has with other primary particles (‘nearest neighbours’), and the values of
 $\boldsymbol{F}_{b}$
represents the force induced in those bonds. Similarly, the torque
 $\boldsymbol{T}_{b}$
in each bond can be found using the equation:
 $$\begin{eqnarray}\unicode[STIX]{x1D644}_{p}\frac{\text{d}\unicode[STIX]{x1D734}}{\text{d}t}-\unicode[STIX]{x1D734}\times (\unicode[STIX]{x1D644}_{p}\unicode[STIX]{x1D734})=\boldsymbol{F}_{p}\times \boldsymbol{r}_{p}+\mathop{\sum }_{b}\boldsymbol{T}_{b},\end{eqnarray}$$
which is defined in a co-rotating reference frame attached to the individual agglomerates. The term
 $\unicode[STIX]{x1D644}_{p}$
represents the moment of inertia tensor of the particle about the centre of mass of the agglomerate and
 $\boldsymbol{r}_{p}$
is the location vector of the primary particle with respect to the agglomerate centre of mass.
Evaluating expressions (2.3) and (2.4) for all primary particles in an agglomerate results in two systems of
 $N$
equations. Since we consider agglomerates to be rigid, and fully resolve collisions in time, the probability that two agglomerates connect at more than one pair primary particle is infinitesimally small (Gastaldi & Vanni Reference Gastaldi and Vanni2011). Primary particles thus are connected by one unique pathway only, and in an agglomerate that consists of
 $N$
particles, exactly
 $N-1$
bonds are present. Hence, the systems of equations are always closed. Bonds are considered to be broken when any of the normal or tangential stress components exceed threshold values that are characteristic of the strength of the bonds (viz.
 $(\boldsymbol{F}_{b})_{\bot }>F_{L}^{N}$
for straining,
 $(\boldsymbol{F}_{b})_{\Vert }>F_{L}^{S}$
for shearing,
 $(\boldsymbol{T}_{b})_{\bot }>T_{L}^{B}$
for bending or
 $(\boldsymbol{F}_{b})_{\Vert }>T_{L}^{T}$
for twisting), provided that the fragments move apart afterwards. If multiple bonds in one agglomerate are eligible for break-up at the same time, the bond to be actually broken is selected randomly. The linear and angular velocities of the agglomerate branches after break-up are set such that the velocity of the primary particles does not change instantaneously during the breakage. This corresponds to conservation of linear and angular momentum.
It is important to emphasize that the adhesion mechanisms that are considered in this work are more complex than for instance considered in the JKR theory (Johnson, Kendall & Roberts Reference Johnson, Kendall and Roberts1971). Such complex adhesion may occur, for example, whenever partial recrystallization plays a role in the formation of bonds between the primary particles. This is also the reason that shearing, bending and twisting may lead to the break-up of an agglomerate; these are not covered by simple contact models, where only straining can lead to agglomerate fragmentation.
2.5 Interaction between particles and wall
Collisions between agglomerates and the walls of the flow domain are resolved in time. In each collision, the linear and angular velocities of the agglomerates are changed such that the wall-normal velocity component (
 $W_{p}$
) of the primary particle that has collided with the wall is reversed. In the limit of an agglomerate that consists only of one primary particle, this corresponds to a specular reflection. To ensure that particles that have virtually no wall-normal velocity and a relatively large wall-normal acceleration do not ‘float’ into the wall during the remainder of the numerical time step
 $(\unicode[STIX]{x0394}t_{rest})$
, the target for the wall-normal velocity of the particle after the collision is computed as:
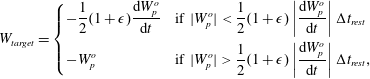 $$\begin{eqnarray}W_{target}=\left\{\begin{array}{@{}ll@{}}\displaystyle -\frac{1}{2}(1+\unicode[STIX]{x1D716})\frac{\text{d}W_{p}^{o}}{\text{d}t} & \displaystyle \text{if }|W_{p}^{o}|<\frac{1}{2}(1+\unicode[STIX]{x1D716})\left|\frac{\text{d}W_{p}^{o}}{\text{d}t}\right|\unicode[STIX]{x0394}t_{rest}\\ \displaystyle -W_{p}^{o} & \displaystyle \text{if }|W_{p}^{o}|>\frac{1}{2}(1+\unicode[STIX]{x1D716})\left|\frac{\text{d}W_{p}^{o}}{\text{d}t}\right|\unicode[STIX]{x0394}t_{rest},\end{array}\right.\end{eqnarray}$$
where
 $\unicode[STIX]{x1D716}=10^{-6}$
. This is a simple fix to ensure that particles remain inside the computational domain (lying almost exactly flush with the wall after
 $\unicode[STIX]{x0394}t_{rest}$
), removing the need to take very small time steps for those particles that are really close to the wall. If the agglomerate consists of more than one primary particle, the specular reflection results both in a linear and angular impulse acting on the agglomerate. The expressions for both of these are given in Schutte (Reference Schutte2016).
2.6 Two-way coupling between fluid and dispersed phases
Like Portela & Oliemans (Reference Portela and Oliemans2003), who used the DELFT code with two-way coupling for spherical particles, we model the force exerted by the dispersed phase on the continuous (fluid) phase by using Newton’s third law. For agglomerates that extend over multiple fluid-phase grid cells, the backforcing in each of the control volumes is computed by summing only the contributions of the primary particles that have their centre located inside that control volume. Thereby, the backforcing of the agglomerate is spread out over the grid cells that the agglomerate spans, and no excessive backforcing occurs in individual control volumes.
3 Description of considered cases
3.1 Flow properties
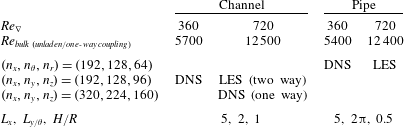
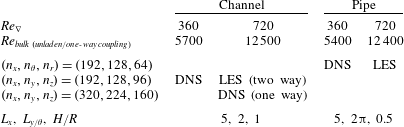
We consider turbulent channel and pipe flows with
 $Re_{\unicode[STIX]{x1D6FB}}(\equiv \unicode[STIX]{x1D70C}_{f}u_{\unicode[STIX]{x1D6FB}}H/\unicode[STIX]{x1D707}_{f})$
equal to 360 and 720, corresponding to bulk Reynolds numbers between 5400 and 12 500. The pressure gradient velocity
 $u_{\unicode[STIX]{x1D6FB}}$
is defined as:
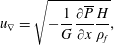 $$\begin{eqnarray}u_{\unicode[STIX]{x1D6FB}}=\sqrt{-\frac{1}{G}\frac{\unicode[STIX]{x2202}\overline{P}}{\unicode[STIX]{x2202}x}\frac{H}{\unicode[STIX]{x1D70C}_{f}}},\end{eqnarray}$$
where
 $G$
is equal to 2 in the channel and 4 in the pipe;
 $H$
represents the pipe radius or the full channel height and
 $\unicode[STIX]{x2202}\overline{P}/\unicode[STIX]{x2202}x$
is the pressure gradient that is the driving force of the flow. Periodic boundary conditions are used in the streamwise (
 $x$
) and spanwise/circumferential (
 $y/\unicode[STIX]{x1D703}$
) directions. For the fluid flow, a no-slip boundary condition is used at the walls, that are located at
 $z=0.0$
and
 $z=1.0$
in the channel and at
 $r=0.5$
in the pipe. A uniform grid is used in the streamwise and spanwise/circumferential directions. In the wall-normal direction, the resolution is higher near the walls than in the centre, transitioning gradually. Care is taken to ensure that the turbulent flow is statistically steady before the dispersed phase is introduced.
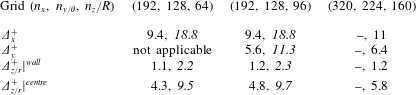
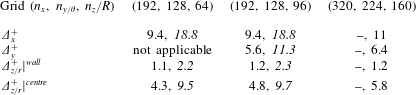
The parameters associated with the fluid phase are summarized in table 1. The associated grid resolutions (in wall units), are given in table 2. The grid resolutions used in the channel are similar to or better than the ones used by van Haarlem (Reference van Haarlem2000) in DNS studies with the DELFT code. The grid resolutions used in DNS mode in the pipe are similar to the ones used by Eggels (Reference Eggels1994).
Overview of parameters associated with the continuous-phase flow.
Grid resolutions considered in this work, expressed in wall units. Values printed in regular typeface represent grids that are used for DNS and values in italics represent grids that are used for LES. The sequences of values reported correspond to
 $Re_{\unicode[STIX]{x1D6FB}}=360$
and
 $Re_{\unicode[STIX]{x1D6FB}}=720$
.
3.2 Dispersed-phase parameters
The dispersed-phase parameters are given by: the radius of the primary particles (
 $R_{p}$
), the volume fraction and number of primary particles, the added-mass corrected particle–fluid density ratio
 $(\breve{\unicode[STIX]{x1D70C}}_{p}/\unicode[STIX]{x1D70C}_{f})$
and the maximum stress that the inter-particle bonds can withstand before breaking (
 $F_{L}^{N}$
,
 $F_{L}^{S}$
,
 $T_{L}^{B}$
and
 $T_{L}^{T}$
), as explained in § 2.4.
In this study, we consider particles that are mono-disperse, with a radius equal to 0.5 % of the channel height
 $H$
. This relatively large primary particle size is adopted because it results in sufficiently large collision rates at moderate primary particle numbers, allowing the simulations to reach a steady state within a reasonable simulation time. In each channel flow simulation, we introduce 250 000 primary particles, corresponding to a dispersed-phase volume fraction of 1.3 %. In pipe flows, the same dispersed phase volume fraction is used by lowering the number of primary particles to 98 175. The particles are individually introduced at random locations throughout the entire flow domain; their initial velocity is set equal to the local fluid velocity. The density ratio
 $\unicode[STIX]{x1D70C}_{p}/\unicode[STIX]{x1D70C}_{f}$
is set at 1.5. This gives an effective, added-mass corrected density ratio
 $\breve{\unicode[STIX]{x1D70C}}_{p}/\unicode[STIX]{x1D70C}_{f}$
of 2.0. The dimensions of the computational domain are equal for the dispersed phase and the continuous phase, and periodic boundary conditions are used for the particles in the streamwise and spanwise directions; they are also used for the continuous phase.
The maximum stress that the inter-particle bonds can withstand before breaking and
 $\mathit{Re}_{\unicode[STIX]{x1D6FB}}$
are the parameters that are varied between simulations. For interpreting the results, we consider the values of
 $F_{L}$
and
 $T_{L}$
scaled by the characteristic hydrodynamic force acting on a single primary particle in a turbulent flow, which can be obtained by substituting
 $u_{\unicode[STIX]{x1D6FB}}$
for
 $(\boldsymbol{U}_{f}-\boldsymbol{U}_{p})$
in (2.2). These can be expressed as:
 $$\begin{eqnarray}F_{L}^{\ast }=\frac{F_{L}}{6\unicode[STIX]{x03C0}\unicode[STIX]{x1D707}_{f}R_{p}u_{\unicode[STIX]{x1D6FB}}};\quad T_{L}^{\ast }=\frac{T_{L}}{6\unicode[STIX]{x03C0}\unicode[STIX]{x1D707}_{f}R_{p}^{2}u_{\unicode[STIX]{x1D6FB}}}.\end{eqnarray}$$
Multiple values of
 $F_{L}^{\ast }$
and
 $T_{L}^{\ast }$
are considered; their values are chosen such that the number of primary particles per agglomerate in steady state is of
 $O(100)$
. This allows, on the one hand, for a significant number of agglomerates to be simulated with a tractable number of primary particles, yet, on the other hand, it remains feasible to attribute macroscopic properties (e.g. a fractal dimension) to the agglomerates.
Agglomerates are considered to be broken by only one single break-up mechanism in each simulation. This is equivalent to assuming that the bonds between the particles can withstand infinite stresses in all but one stress component (e.g. when agglomerates are broken due to shearing, they are assumed to have an infinite resistance to straining, bending and twisting). Although it is clearly not possible to engineer a physical bond with these properties, this approach allows us to study the interaction of the individual stress components with the turbulent flow.
3.3 Simulation conditions
The balance between agglomeration and break-up leads to a statistical steady state (stationary state); we will simply refer to it as ‘steady state’. When the steady state sets in, individual agglomerates still frequently undergo collisions, thereby forming larger agglomerates, and agglomerates also are frequently broken. Overall, these processes cancel out each other, such that the properties of the agglomerate population in a statistical sense remain unchanged. The results that are presented in the remainder of this paper refer to average values of steady-state situations, unless otherwise noted.
4 Non-laden turbulent flow properties
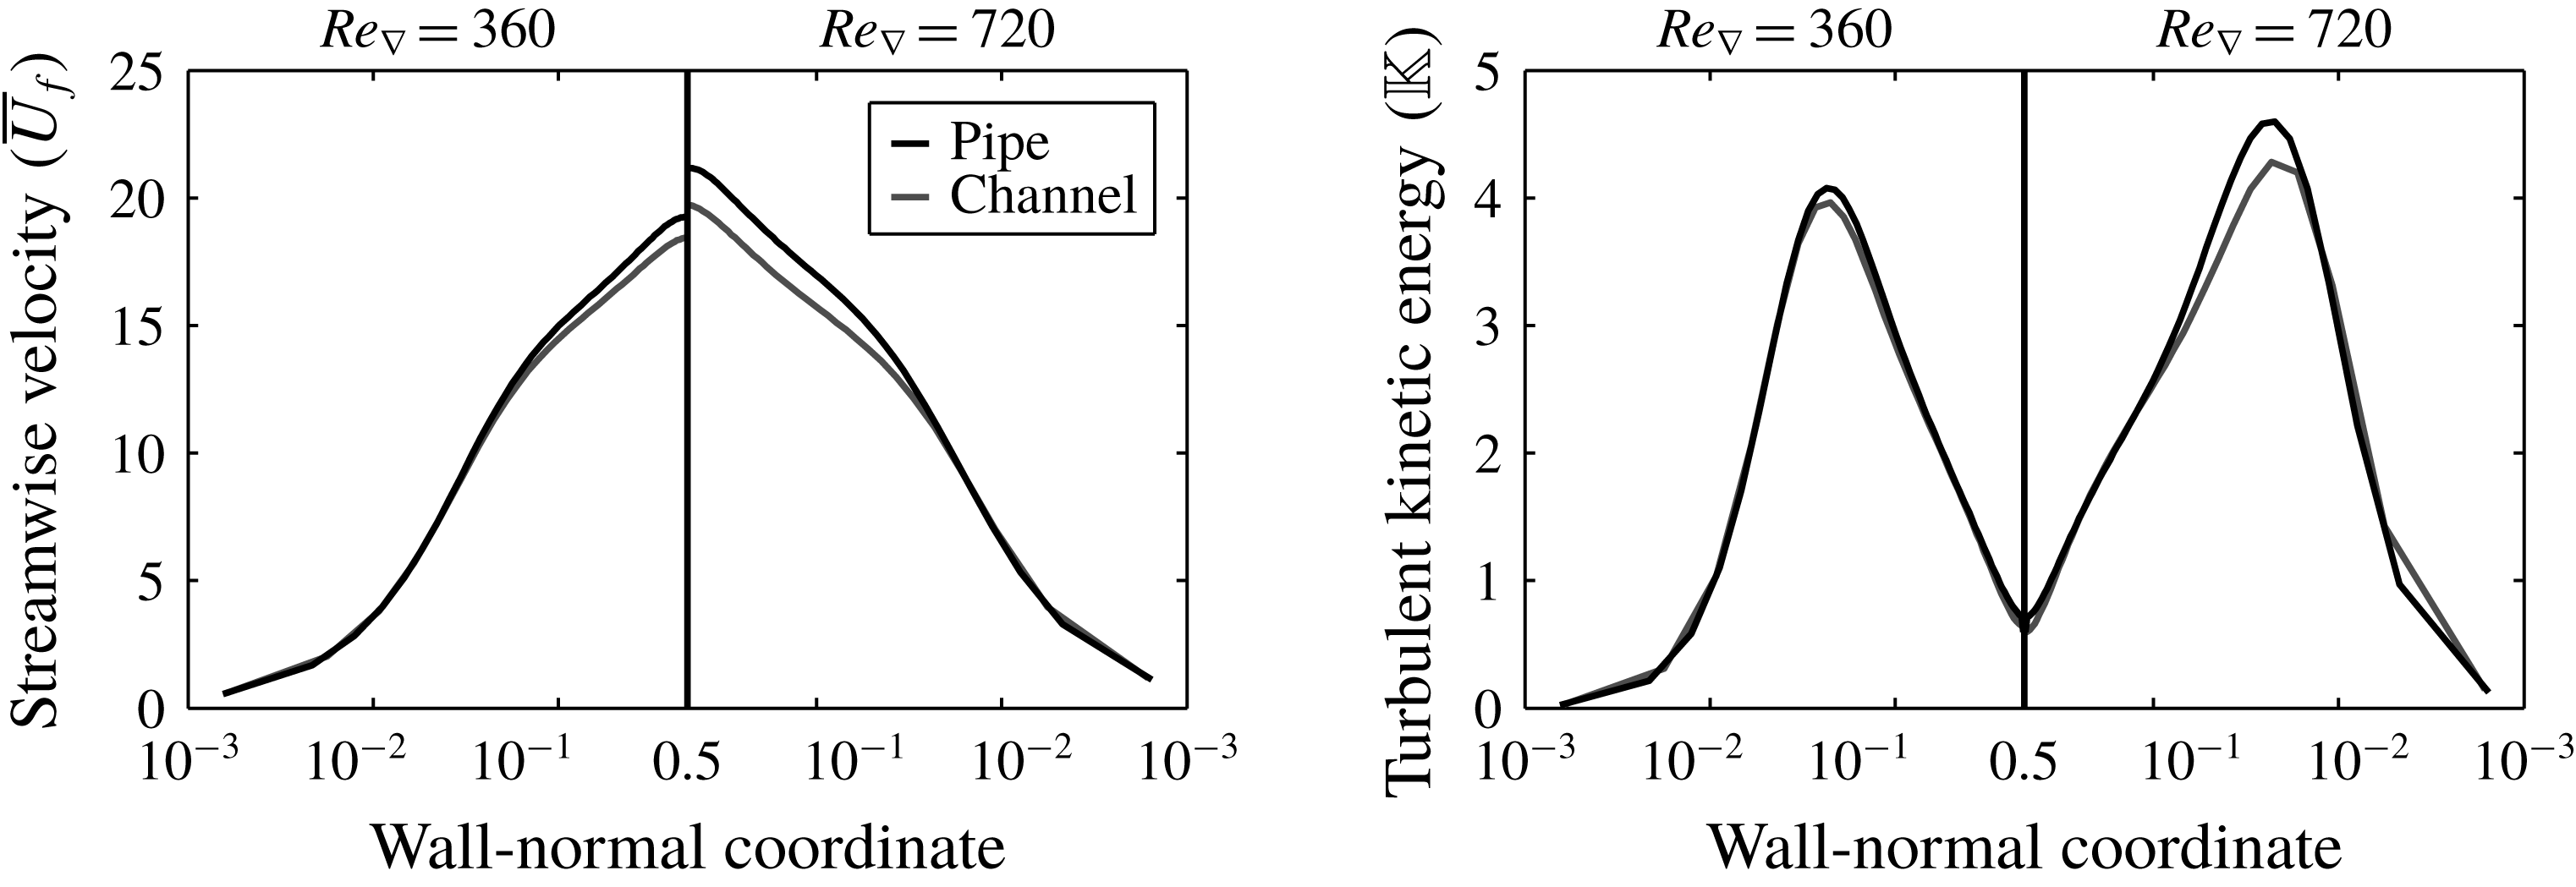
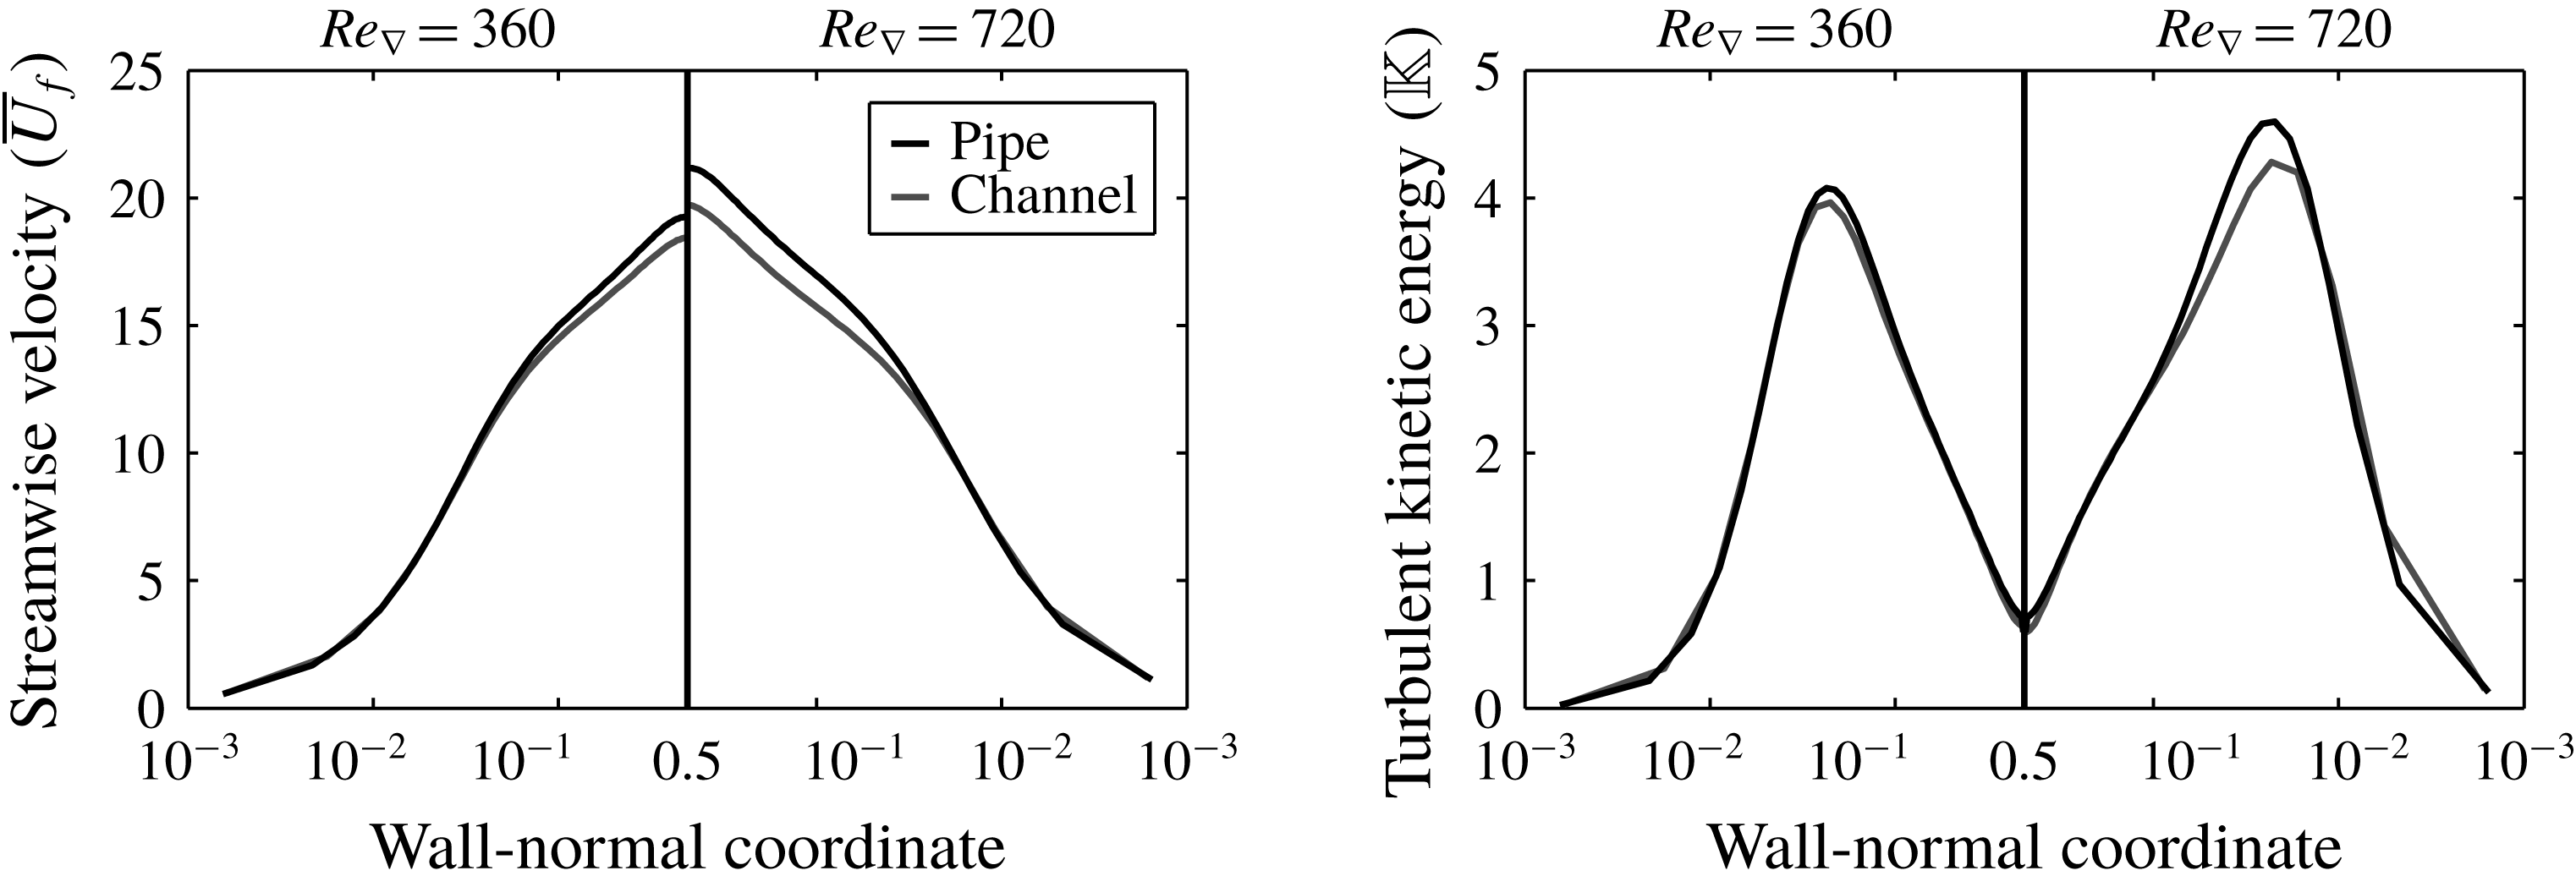
Figure 1 shows a comparison of the time-averaged streamwise fluid velocity and the turbulent kinetic energy as a function of the wall-normal coordinate between non-laden channel and pipe flows. The mean velocity and the turbulent kinetic energy have been normalized with
 $u_{\unicode[STIX]{x1D6FB}}$
and
 $u_{\unicode[STIX]{x1D6FB}}^{2}$
, respectively.
Comparison of the non-dimensional time-averaged streamwise velocity (left) and the turbulent kinetic energy (right) for non-laden flows.
For the channel, we compared the statistics of the single-phase
 $Re_{\unicode[STIX]{x1D6FB}}=360$
flow to the DNS reference data by Moser, Kim & Mansour (Reference Moser, Kim and Mansour1999). The maximum deviation of the mean streamwise fluid velocity (
 $+$
1.4 %) occurs close to the walls of the channel. The maximum observed deviation in the Reynolds stresses is found for
 $\overline{u^{\prime }u^{\prime }}$
(
 $-$
12 %), close the centre of the channel. For pipe, we compared the statistics of the single-phase
 $Re_{\unicode[STIX]{x1D6FB}}=360$
flow to the high-resolution DNS data obtained by El Khoury et al. (Reference El Khoury, Schlatter, Noorani, Fischer, Brethouwer and Johansson2013). We found that the maximum deviation of the mean streamwise fluid velocity (
 $+$
1.0 %) occurs at around
 $r=0.2$
. The maximum deviation observed in the Reynolds stresses is found for
 $\overline{w^{\prime }w^{\prime }}$
(
 $-$
8.4 %), close the wall of the pipe.
5 Results: modification of turbulence
When two-way coupling is considered, the presence of the agglomerates will change the properties of the turbulent flow. It is well known from the literature that the addition of non-interacting spherical particles to a turbulent flow may augment (for relatively large particles) or attenuate the turbulence intensity (for smaller particles) (Balachandar & Eaton Reference Balachandar and Eaton2010). The addition of a dispersed phase with a non-spherical structure (such as polymers (Sureshkumar, Beris & Handler Reference Sureshkumar, Beris and Handler1998; Ptasinski et al. Reference Ptasinski, Nieuwstadt, van den Brule and Hulsen2001), or non-elastic rods (Paschkewitz et al. Reference Paschkewitz, Dubief, Dimitropoulos, Shaqfeh and Moin2004)) can cause a drag reduction in turbulent flows by reduction of the turbulent stresses. On the other hand, one may expect that the presence of dispersed objects with dimensions that are large compared to the typical length scale of the turbulent eddies increase the correlation length of the flow, and thus increase the apparent viscosity of the fluid (which essentially is a measure of the resistance of the fluid against velocity gradients).
5.1 Change of mean flow rate
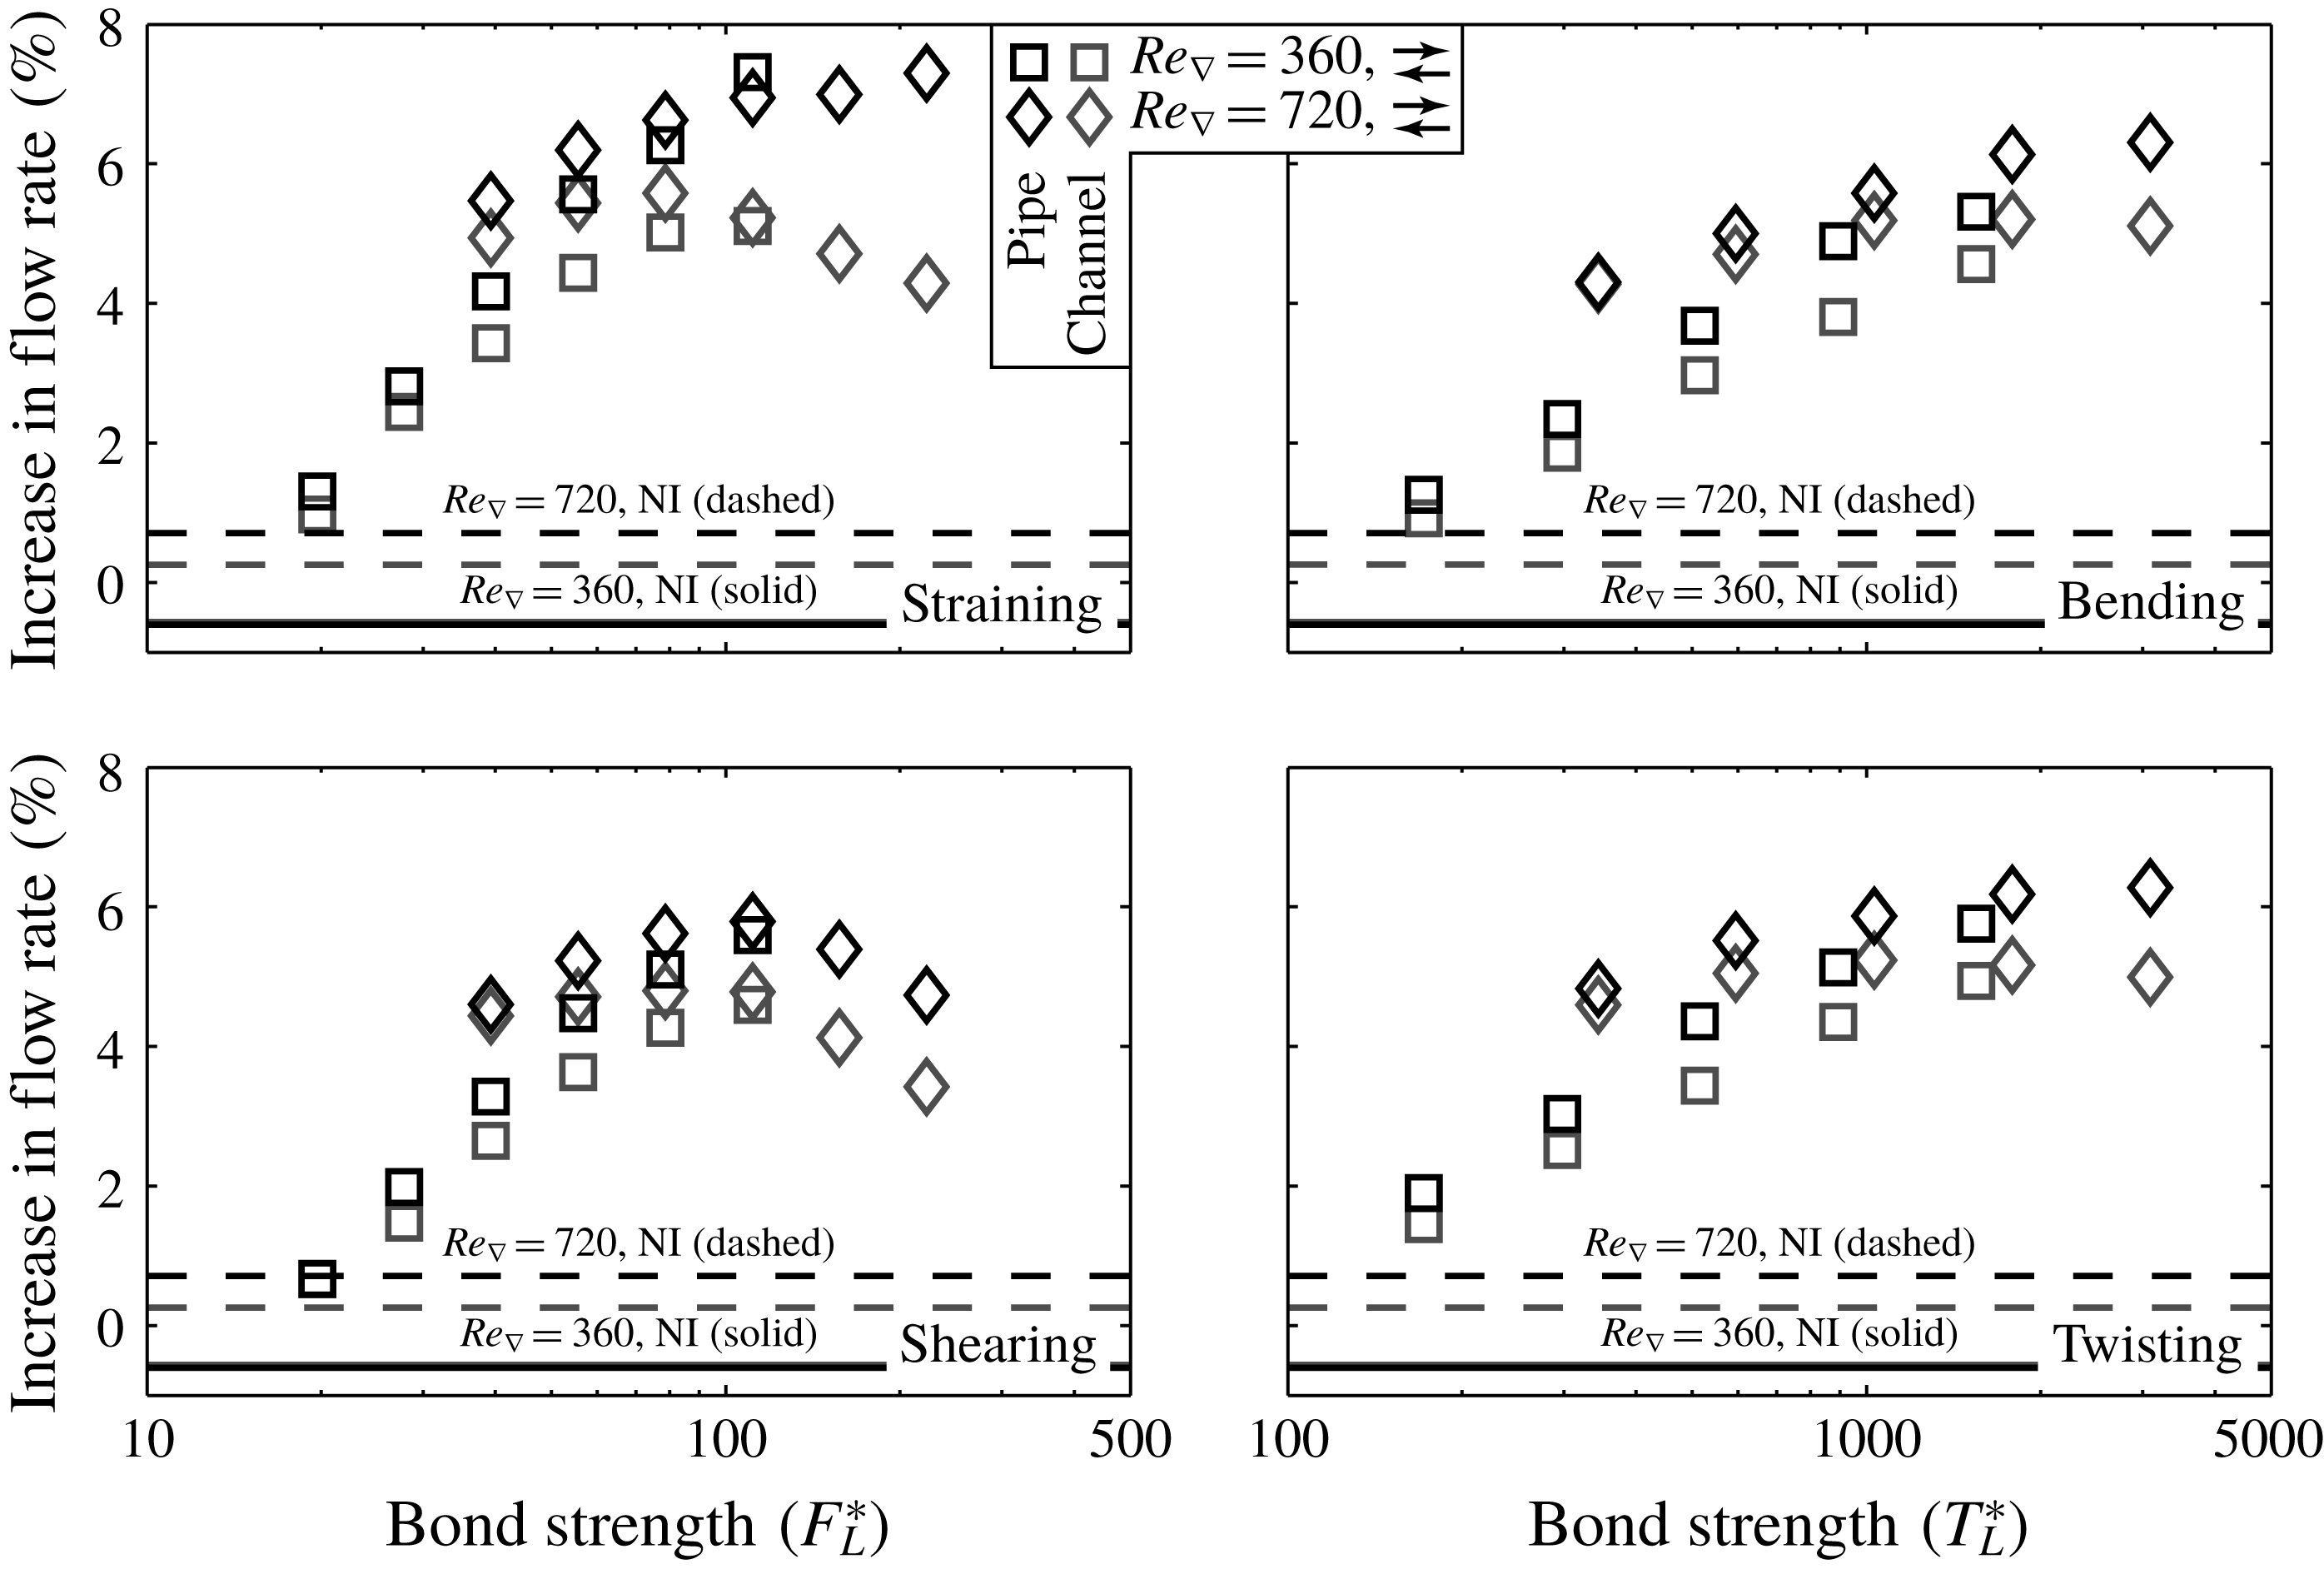
Change in fluid-phase flow rate with respect to non-laden flow upon including the dispersed phase using two-way coupling. The horizontal lines indicate results that have been obtained using a two-way coupled non-interacting dispersed phase with the same properties and volume fraction as in the agglomeration/break-up model, for reference.
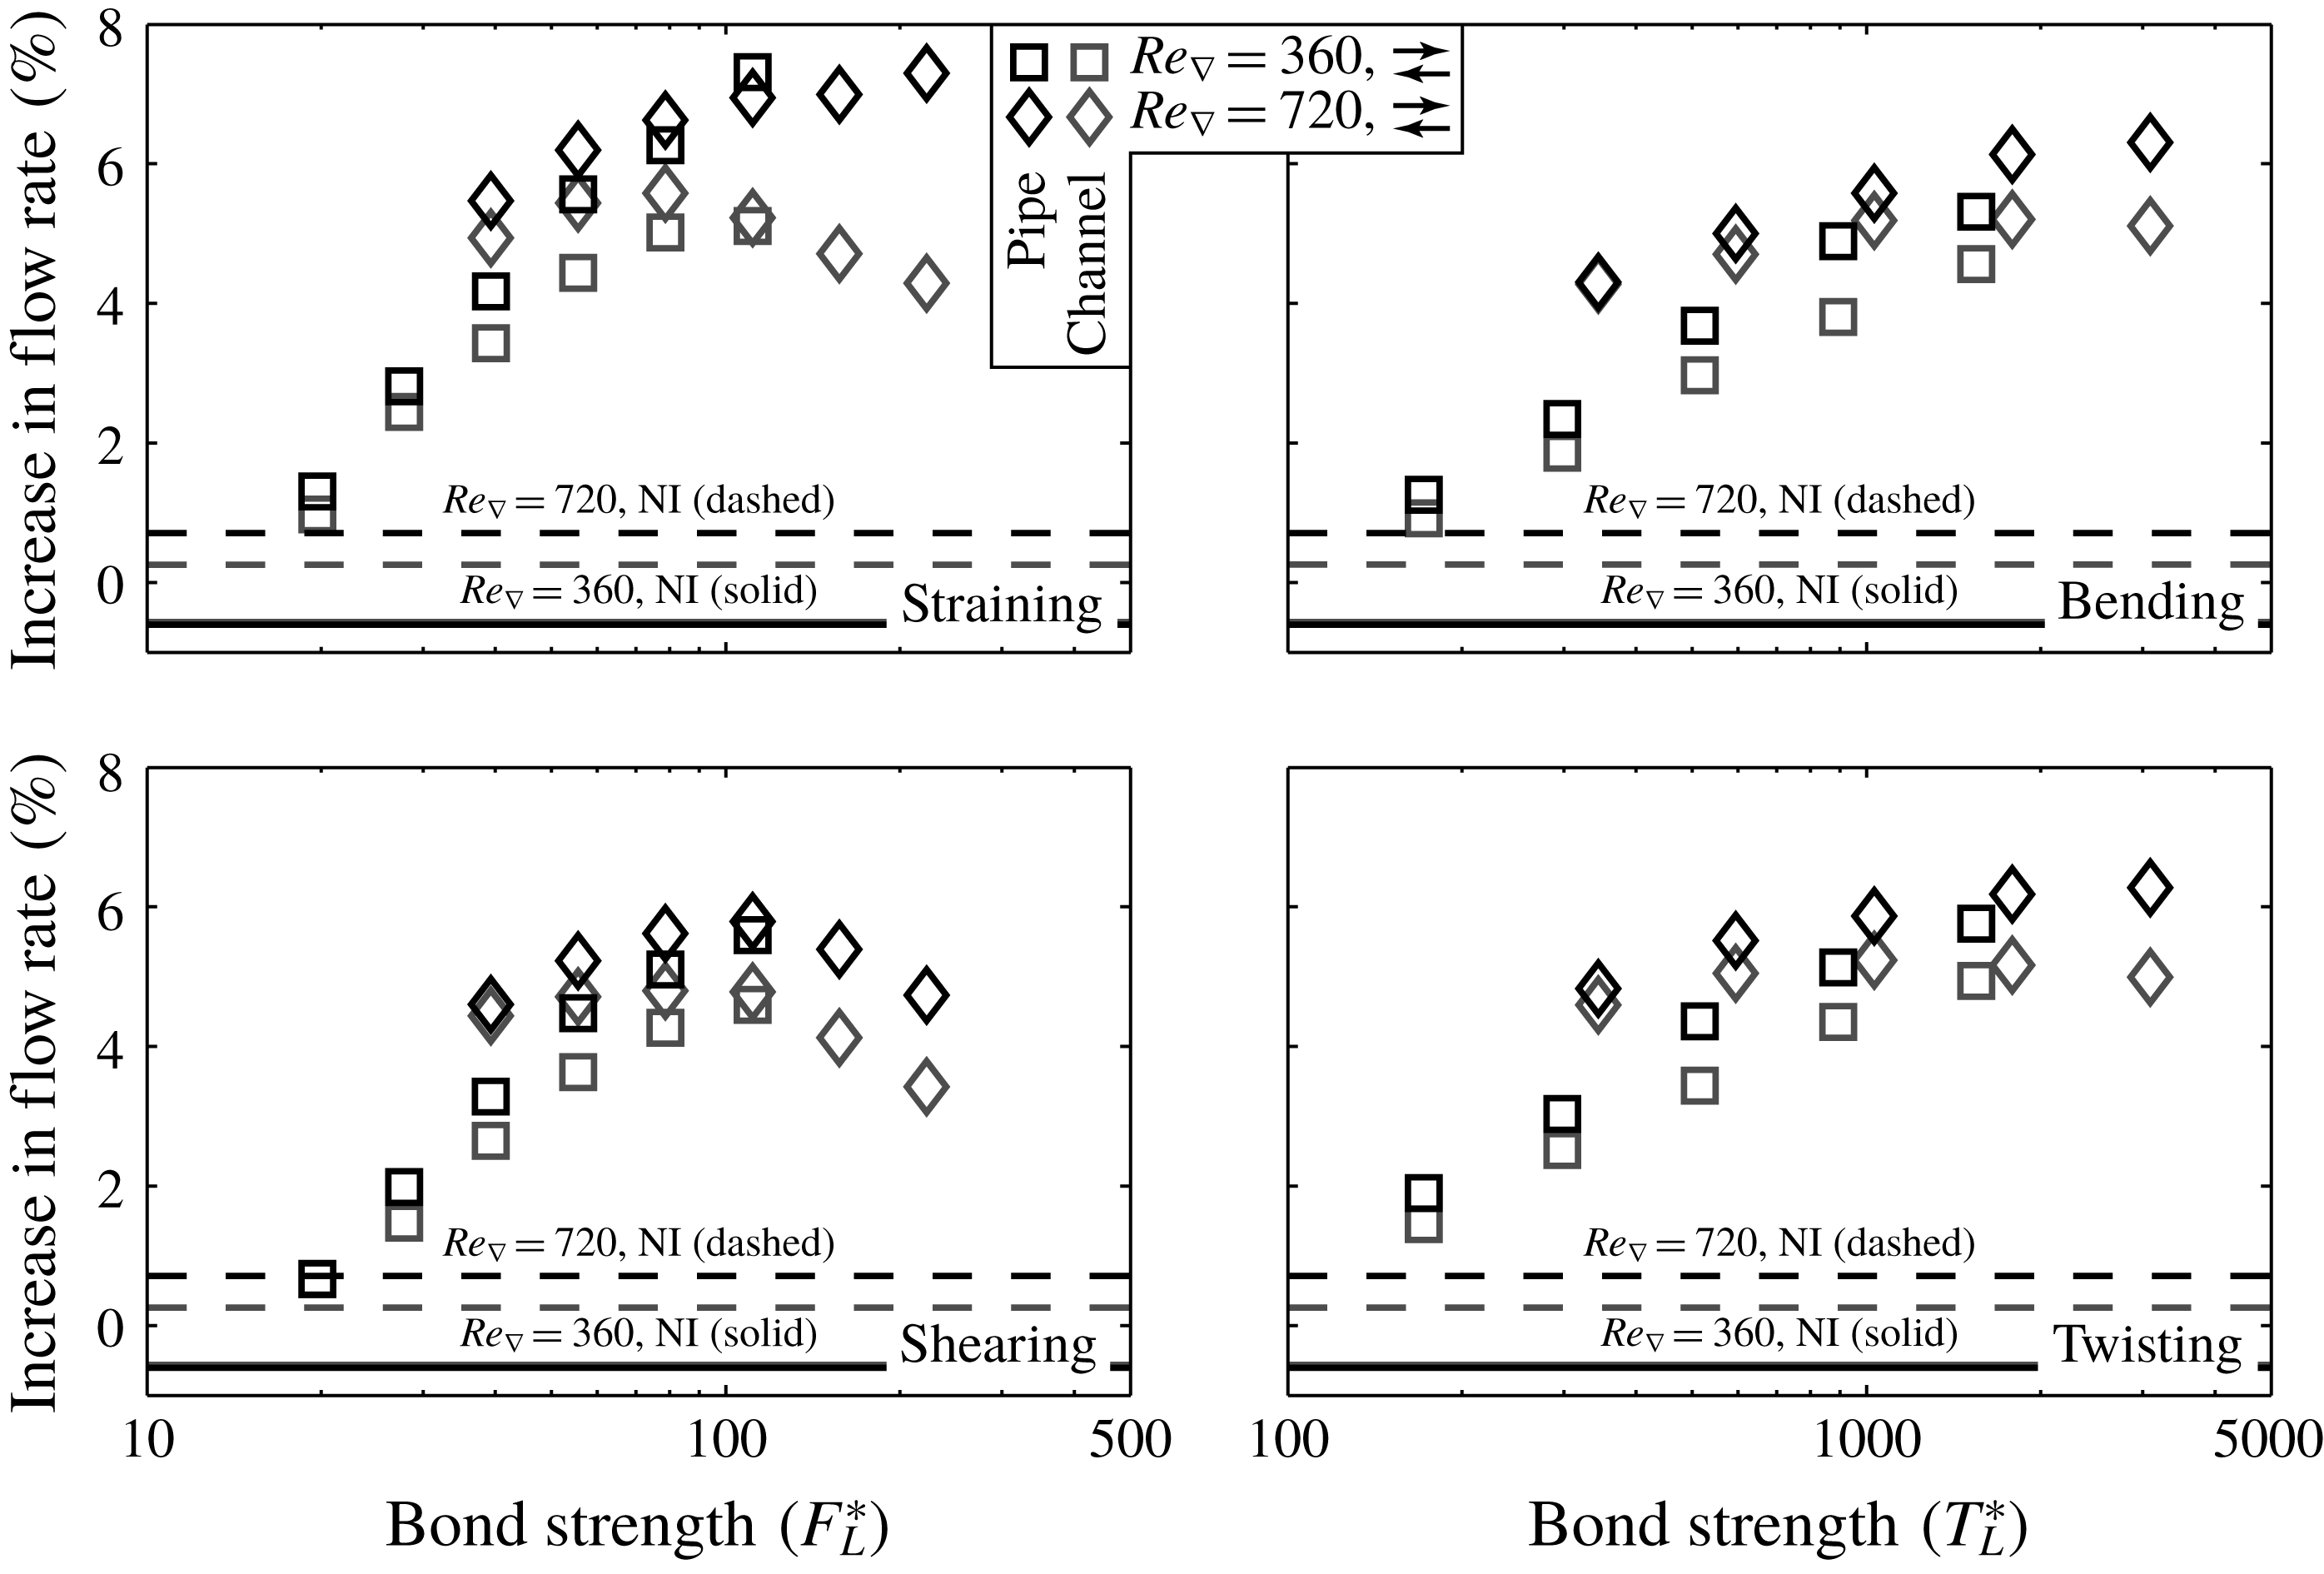
Figure 2 shows the change in overall flow rate upon ladening the flow with the dispersed phase using two-way coupling. To separate between the effects of the general ladening and the specific interactions of the agglomerates with the flow, additional results are shown for flows that are laden with two-way coupled non-interacting spherical particles. Apart from being non-interacting, these dispersed phases have the same properties and volume fraction as considered in all other cases.
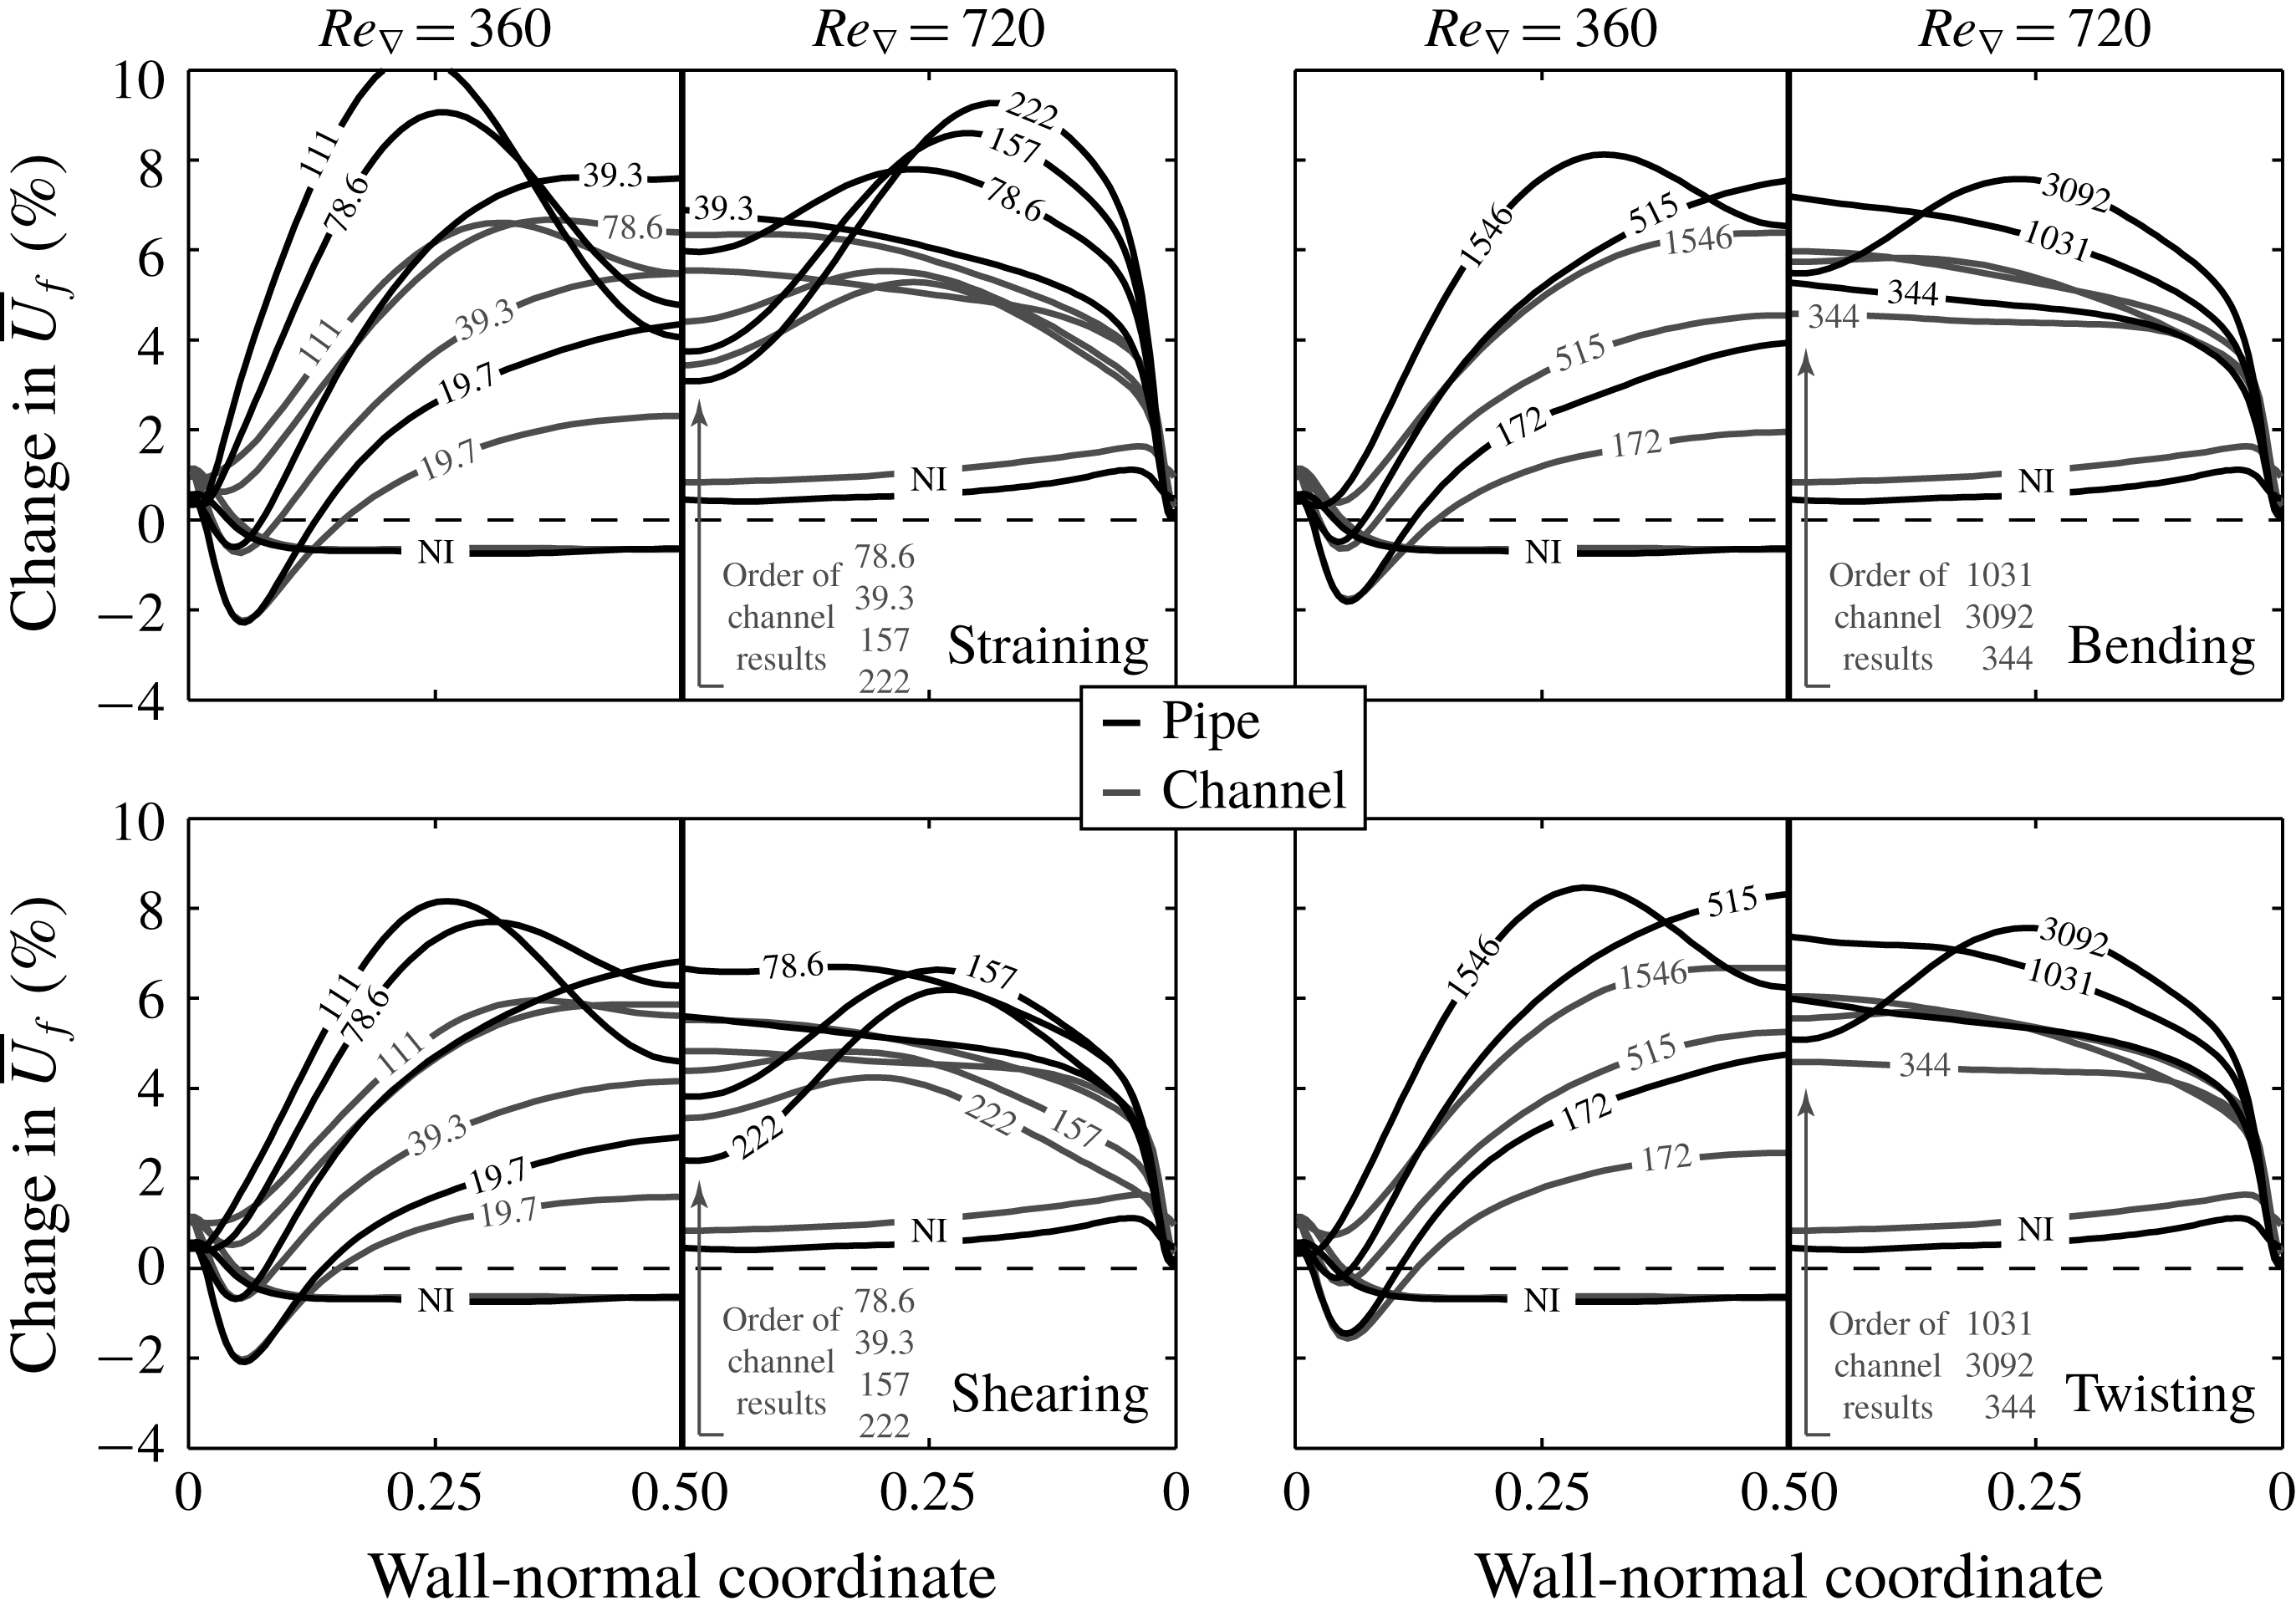
It is clear that the effect of the agglomerates on the flow by far surpasses the effect of the non-interacting primary particles. The most important observations that can be made are: (I) the maximum increase in the flow rate achieved in the channel (approximately 5.5 %) is smaller than that in the pipe (approximately 7 %); (II) the maximum increase is similar for both Reynolds numbers, yet is reached at lower values for
 $F_{L}^{\ast }$
and
 $T_{L}^{\ast }$
at
 $Re_{\unicode[STIX]{x1D6FB}}=720$
than at
 $Re_{\unicode[STIX]{x1D6FB}}=360$
; (III) agglomerates broken by straining inflict the largest influence on the flow, the effect of both torque-related break-up mechanisms is smaller and similar whereas shearing leads to the smallest increases in flow rate.
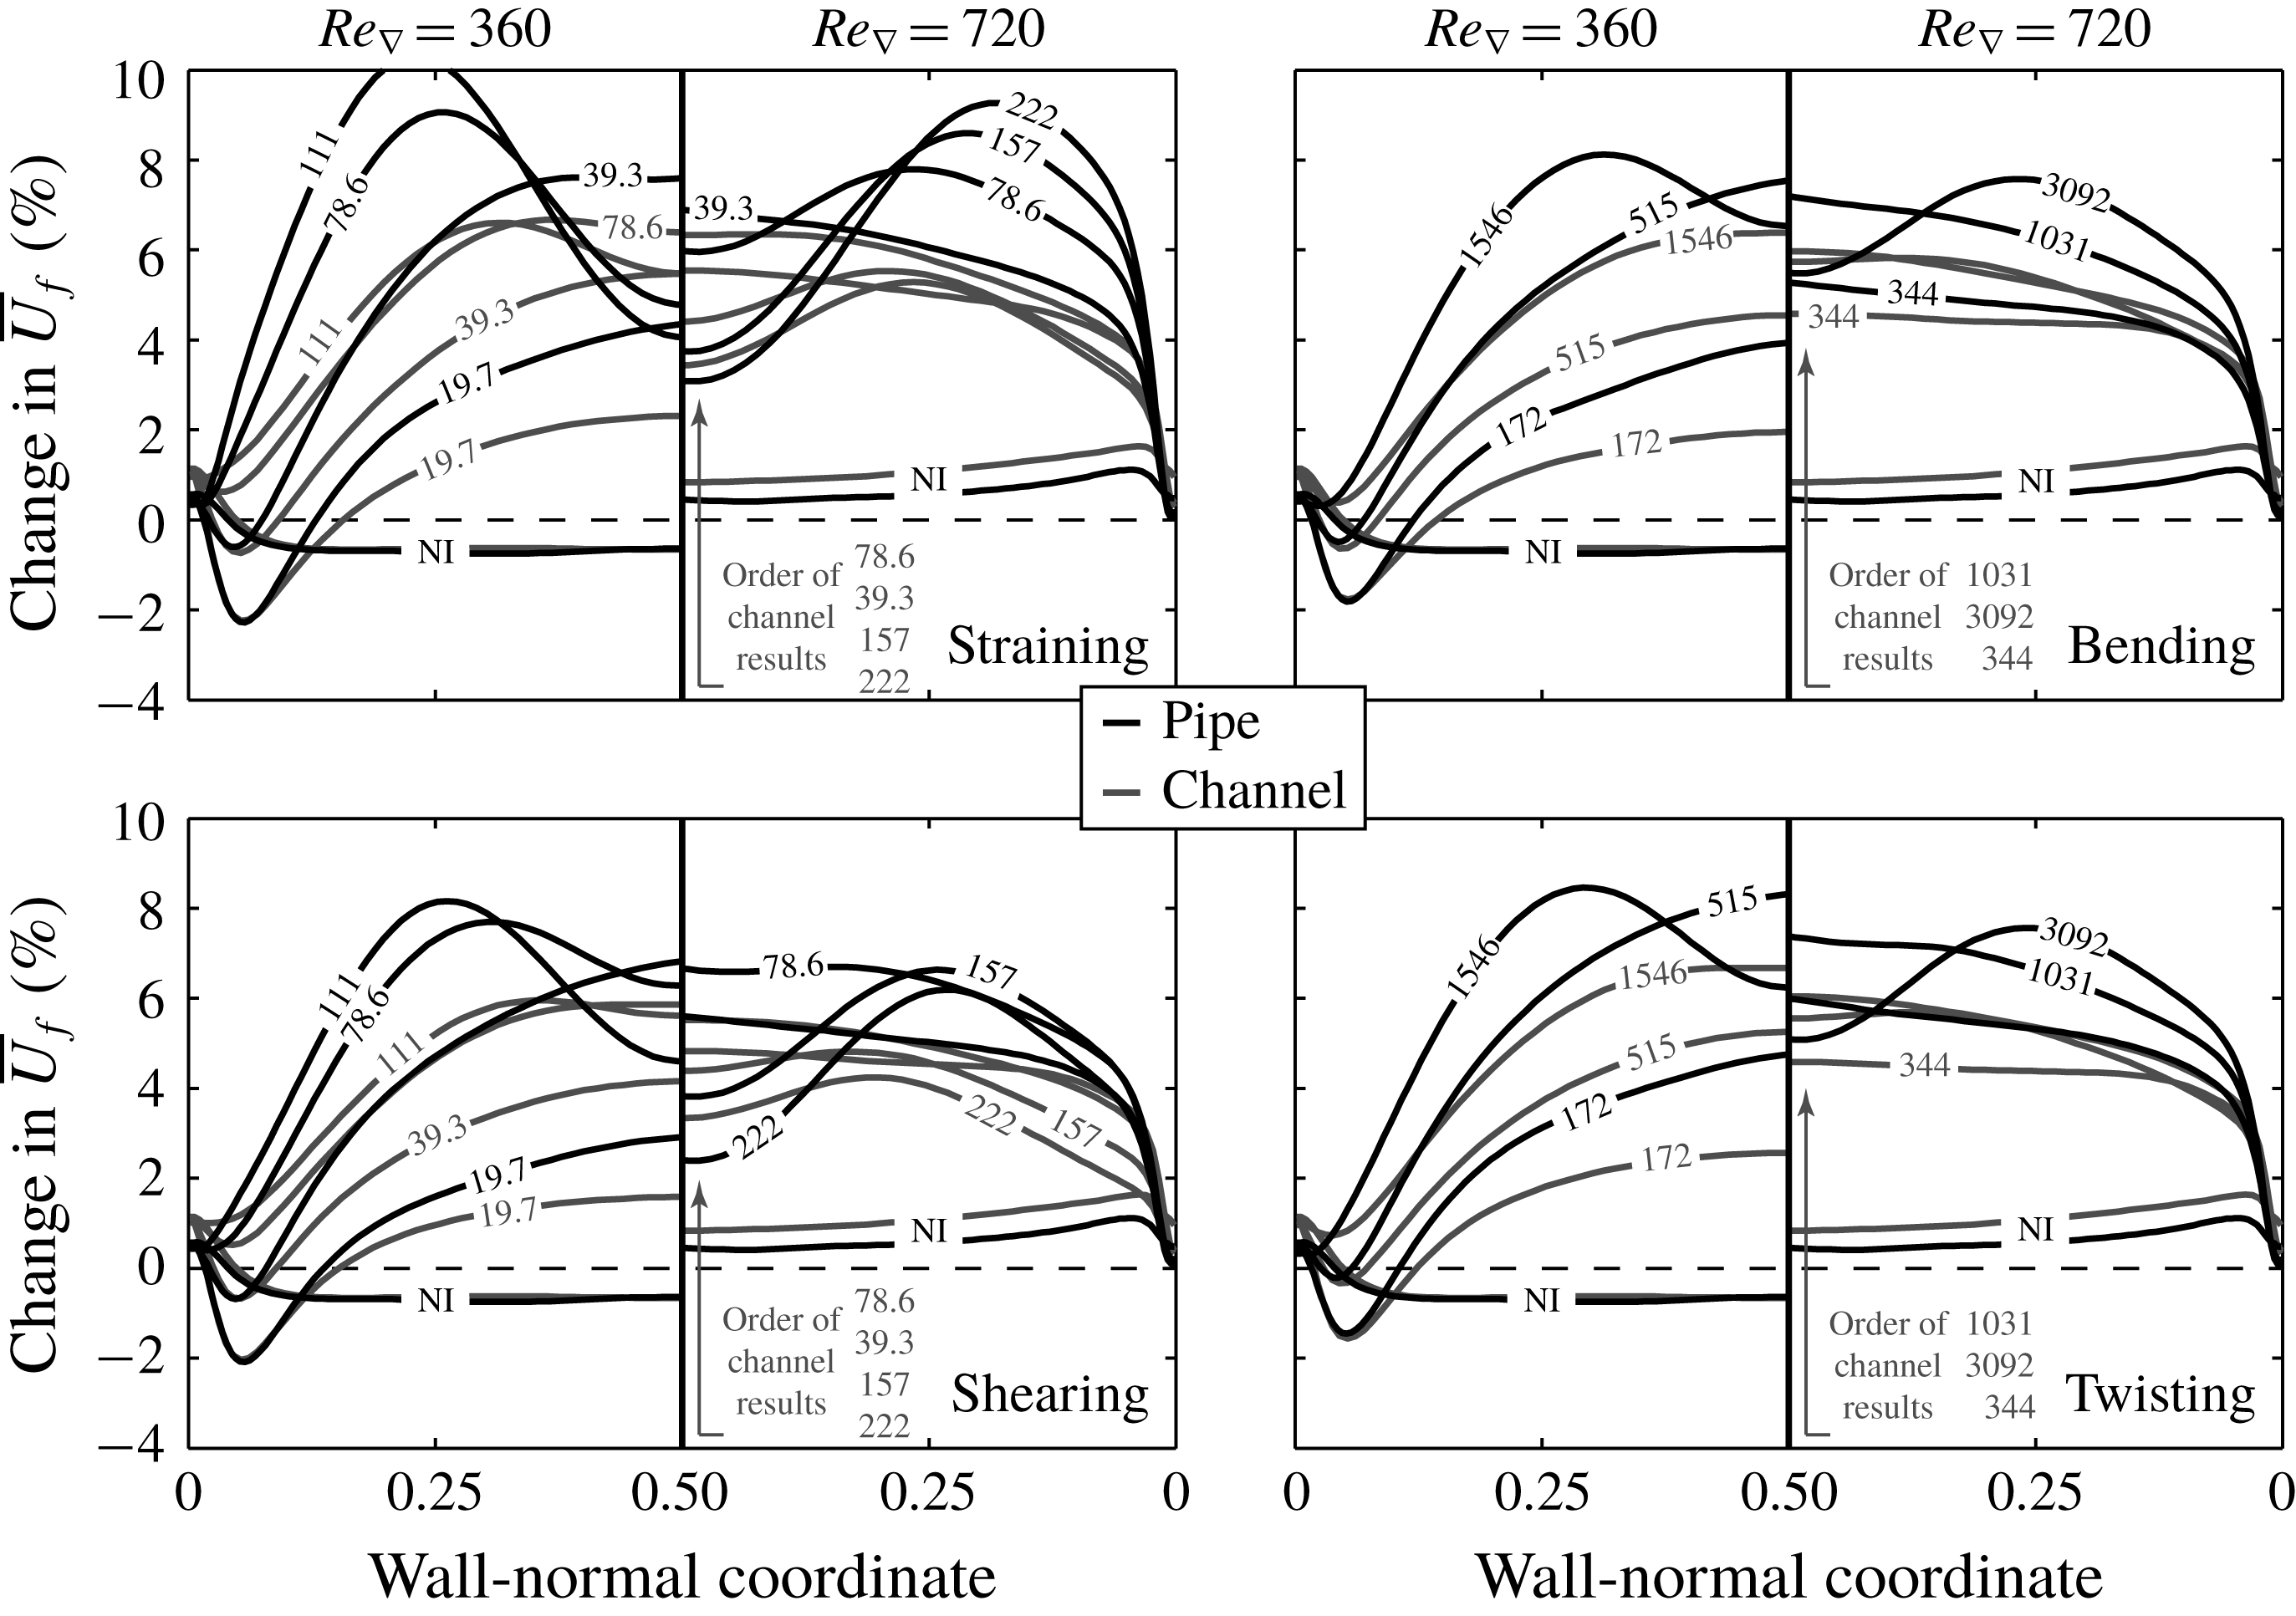
The increase in flow rate mainly results from an increase in the streamwise velocity near the centre of the channel and the pipe, as is shown in figure 3. If the agglomerate strength surpasses a certain threshold (which is lower in the pipe than in the channel), the largest velocity increase no longer occurs near the centre of the flow domain, but at a location intermediate between the wall and the centre. We postulate that this is caused by the way that the agglomerates affect the effective viscosity of the continuous phase, as will be explained shortly. Note that the stronger increase of fluid velocity close to the walls of the flow domain at
 $Re_{\unicode[STIX]{x1D6FB}}=720$
compared to
 $Re_{\unicode[STIX]{x1D6FB}}=360$
may be caused by the by the fact that LES is used at the former Reynolds number. Possibly, its resolution is insufficient to fully capture the changes in the boundary layer induced by the two-way coupling of the dispersed phase.
Change in the average continuous-phase streamwise velocity with respect to non-laden flow upon including dispersed-phase using two-way coupling. The numbers imposed onto the lines indicate the values of
 $F_{L}^{\ast }$
and
 $T_{L}^{\ast }$
used to obtain the respective results. ‘NI’ indicates results obtained using a two-way coupled non-interacting dispersed phase.
5.2 Turbulence modification by dispersed phase
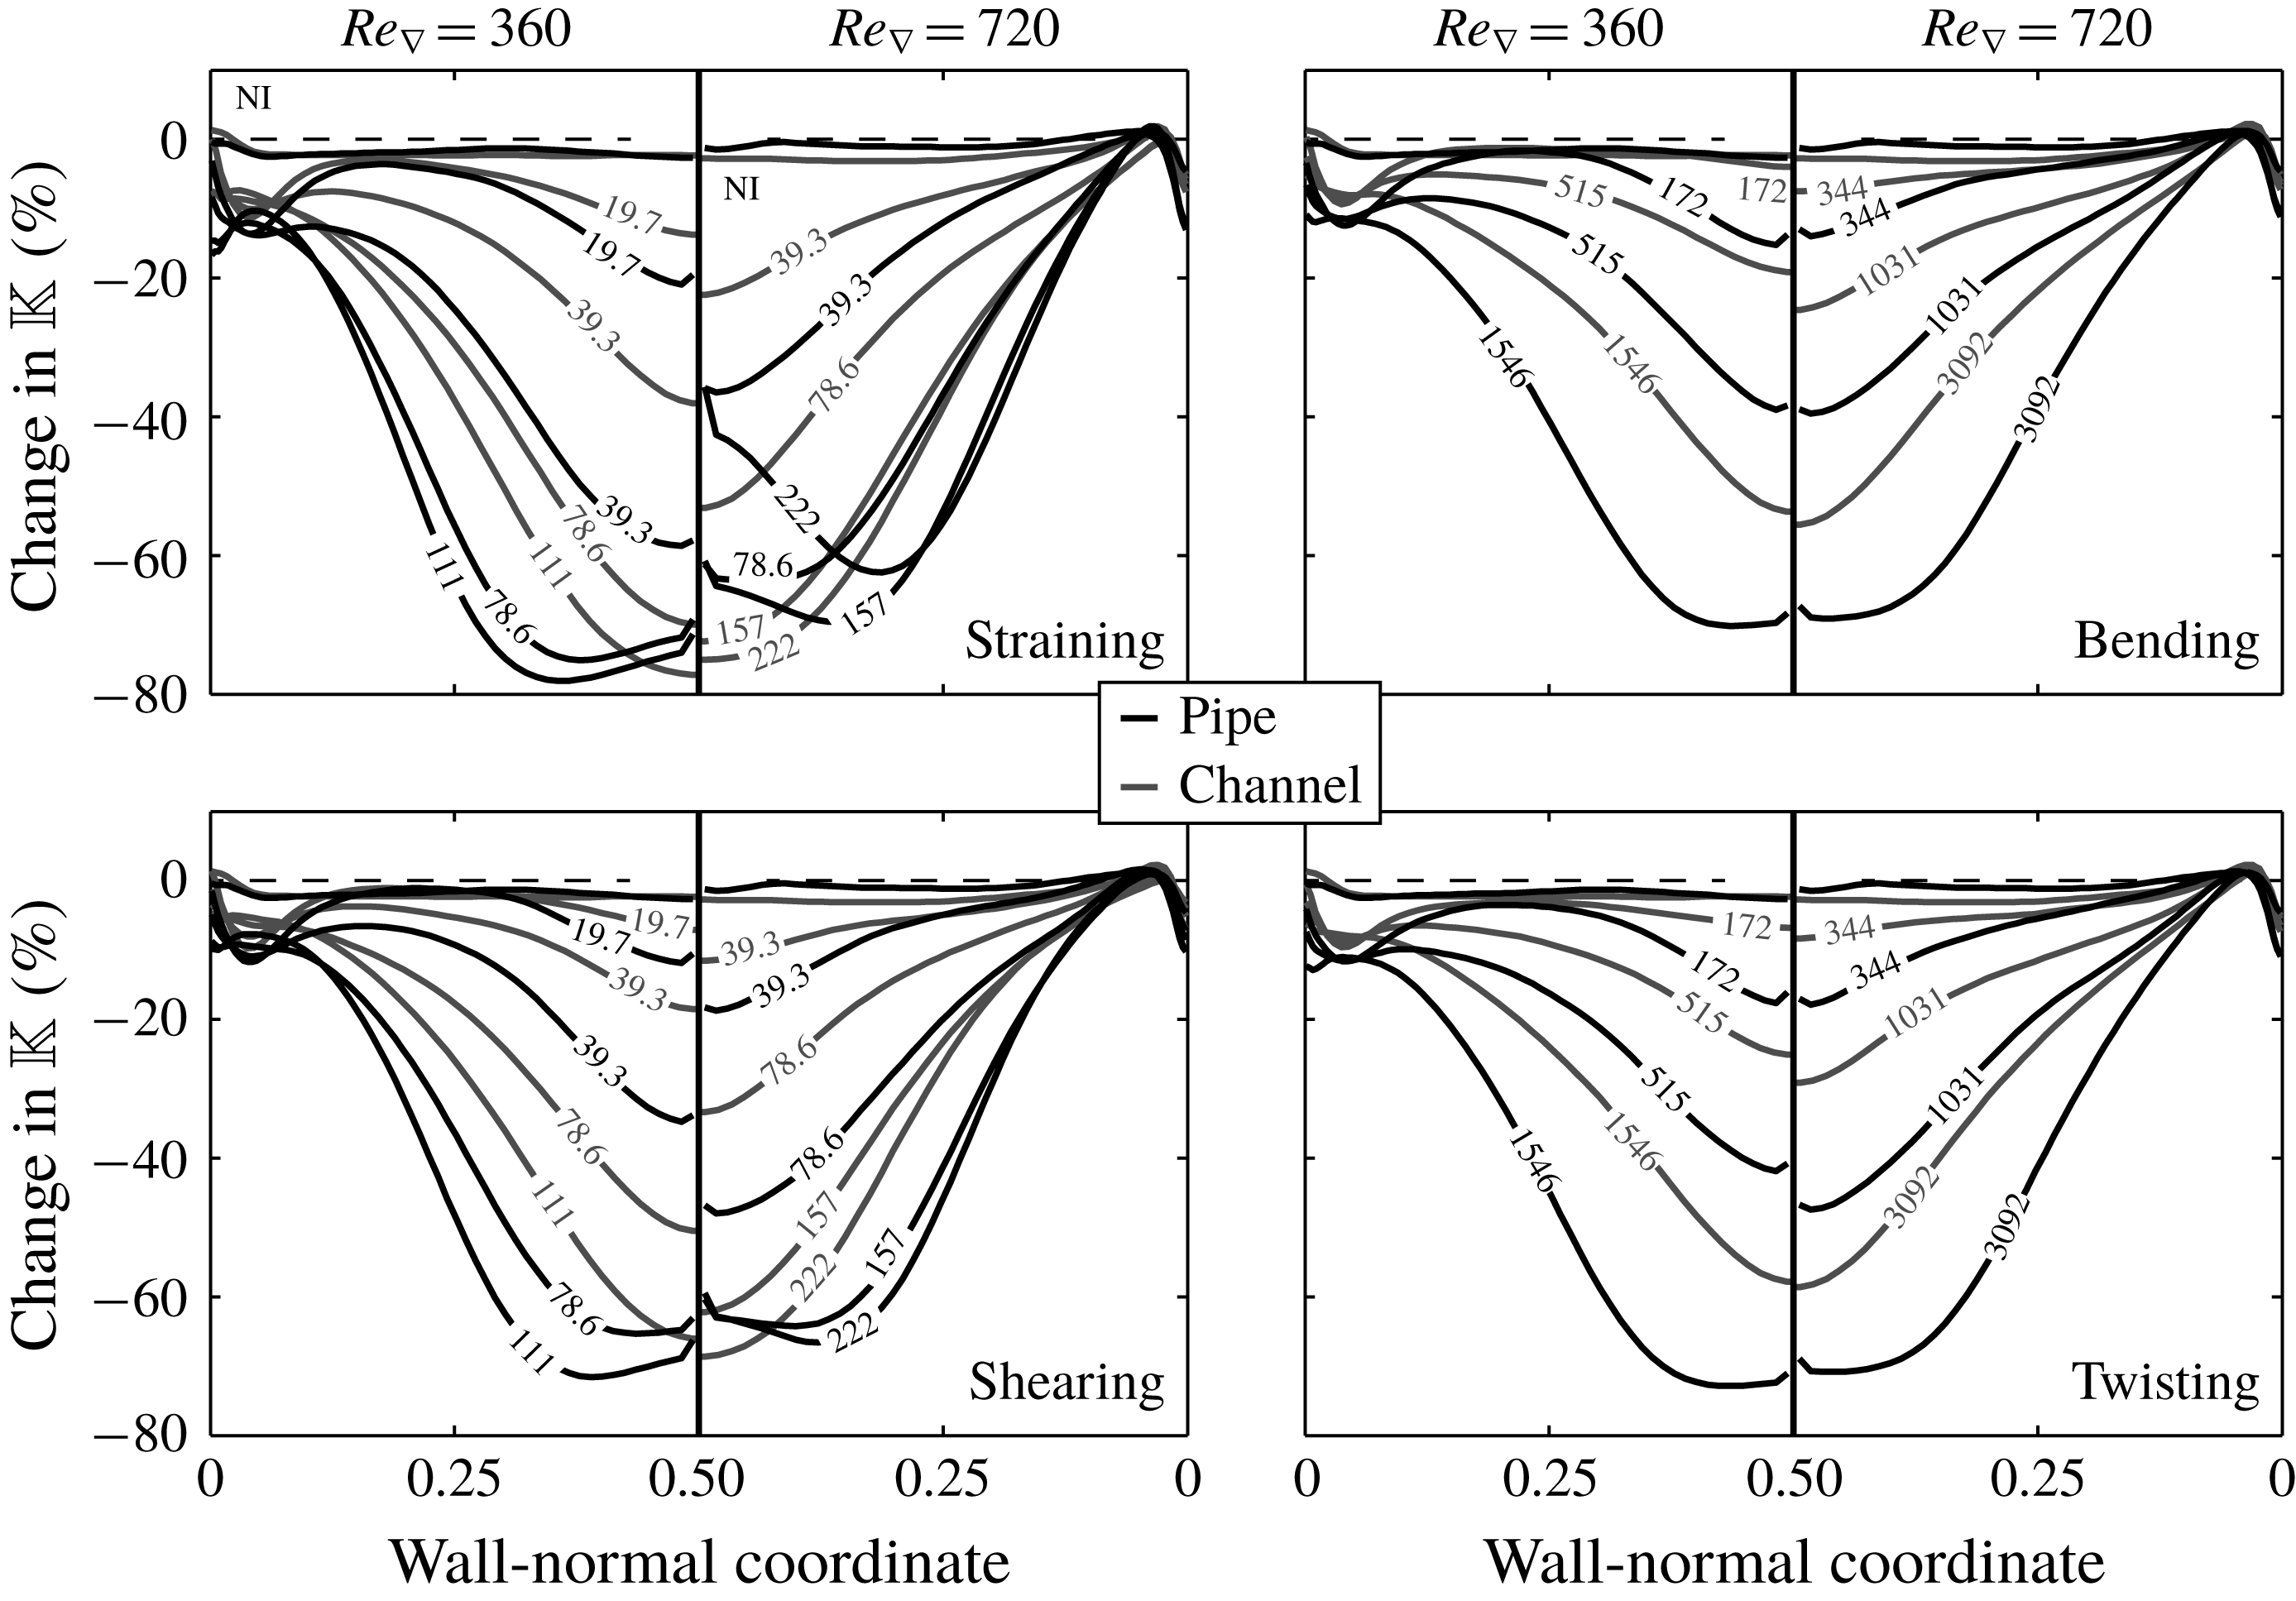
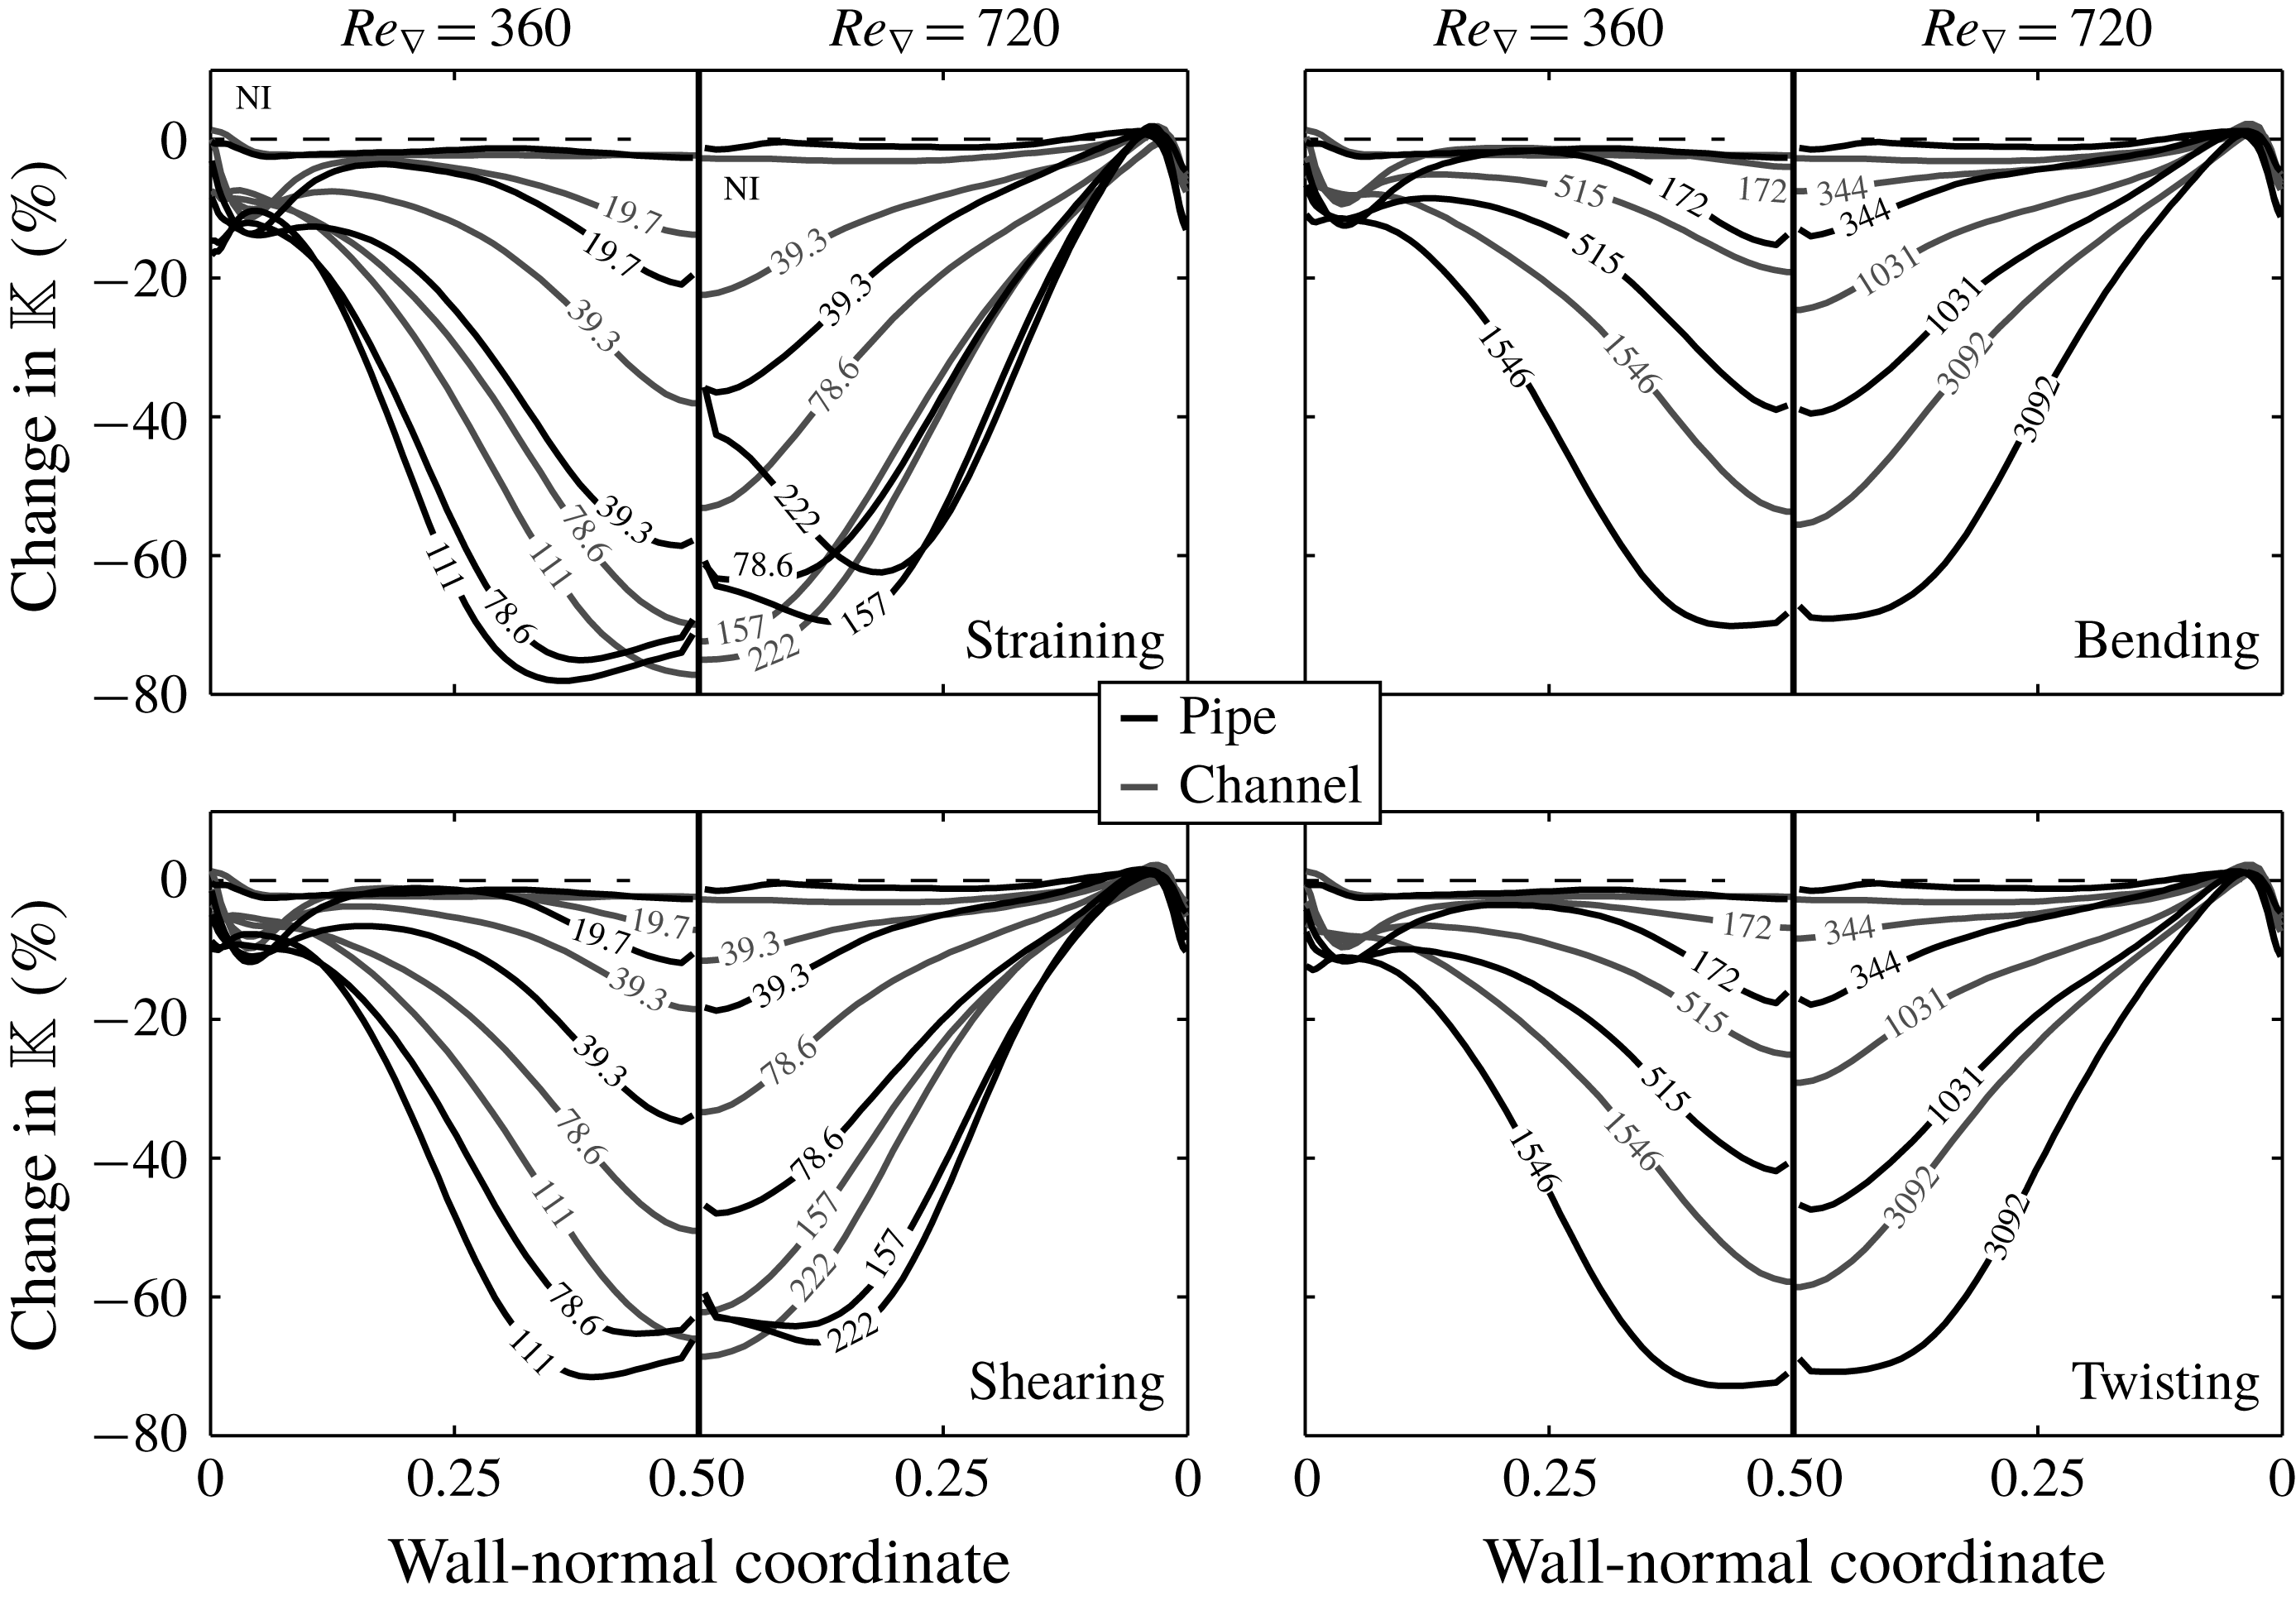
As we consider pressure-driven flows and constant molecular viscosities in our simulations, any changes in the effective viscosity of the fluid phase will result in changes in the fluid flow rate. As a simple estimate of how the magnitude of the turbulent viscosity of the continuous phase changes upon two-way coupling with the dispersed phase, we consider the turbulent kinetic energy. Figure 4 shows the change in turbulent kinetic energy as a function of the wall-normal coordinate for the two-way coupled approach compared to non-laden flows. The presence of the dispersed phase that is undergoing agglomeration and break-up has a strong tendency to decrease the turbulent kinetic energy. This tendency is stronger in the pipe than it is in the channel.
Change in the turbulent kinetic energy with respect to non-laden flow, upon including the dispersed phase using two-way coupling. The labels aligned along the lines indicate the values of
 $F_{L}^{\ast }$
and
 $T_{L}^{\ast }$
used to obtain the respective results. Black lines: pipe flow, grey lines: channel flow.
At large values of
 $F_{L}^{\ast }$
and
 $T_{L}^{\ast }$
, the decrease of the turbulent kinetic energy saturates. As will be shown in § 6.3, the number of primary particles per agglomerate will continue growing upon further increasing the value of
 $F_{L}^{\ast }$
or
 $T_{L}^{\ast }$
past this saturation point. Consequently, the dimensions of the agglomerates keep on increasing. As postulated before, a growth of the agglomerates will lead to an increase in the effective fluid viscosity by increasing the correlation length of the flow. Such an increase is indeed observed in our simulations. It is non-isotropic and its magnitude varies as a function of the wall-normal coordinate. The hypothesis of increased effective viscosity is supported by the results of simulations that were conducted in laminar flows (in which the turbulent eddy viscosity does not play a role). Here, we find that the flow rate decreases significantly (by around 25 %) upon ladening the flow with the two-way coupled dispersed phase that is undergoing agglomeration and break-up.
When the turbulent eddy viscosity has already vanished considerably, its further decrease for increasing values of
 $F_{L}^{\ast }$
and
 $T_{L}^{\ast }$
can no longer compensate for the increase of the long-range correlation viscosity. This point marks the transition above which the fluid flow rate decreases upon a further increase of
 $F_{L}^{\ast }$
or
 $T_{L}^{\ast }$
. The agglomerates are more effective at suppressing the turbulence fluctuations in the pipe than in the channel at lower values of
 $F_{L}^{\ast }$
and
 $T_{L}^{\ast }$
(and thus, as will be shown in § 6.3, when they contain fewer primary particles and have smaller dimensions. Therefore, the balance between both competing effects sets in at larger values of the flow rate increase in the pipe than in the channel. This explains the differences in the maximum flow rate increase in both geometries.
6 Results: agglomerate properties
In this section, the properties of the agglomerates will be discussed. Since, due to the nature of the model that was adopted, the break-up of agglomerates is intensely linked to the particle–fluid interactions, some of the properties that will be studied are probed during break-up events.
6.1 Slip velocity of primary particles with respect to the continuous phase
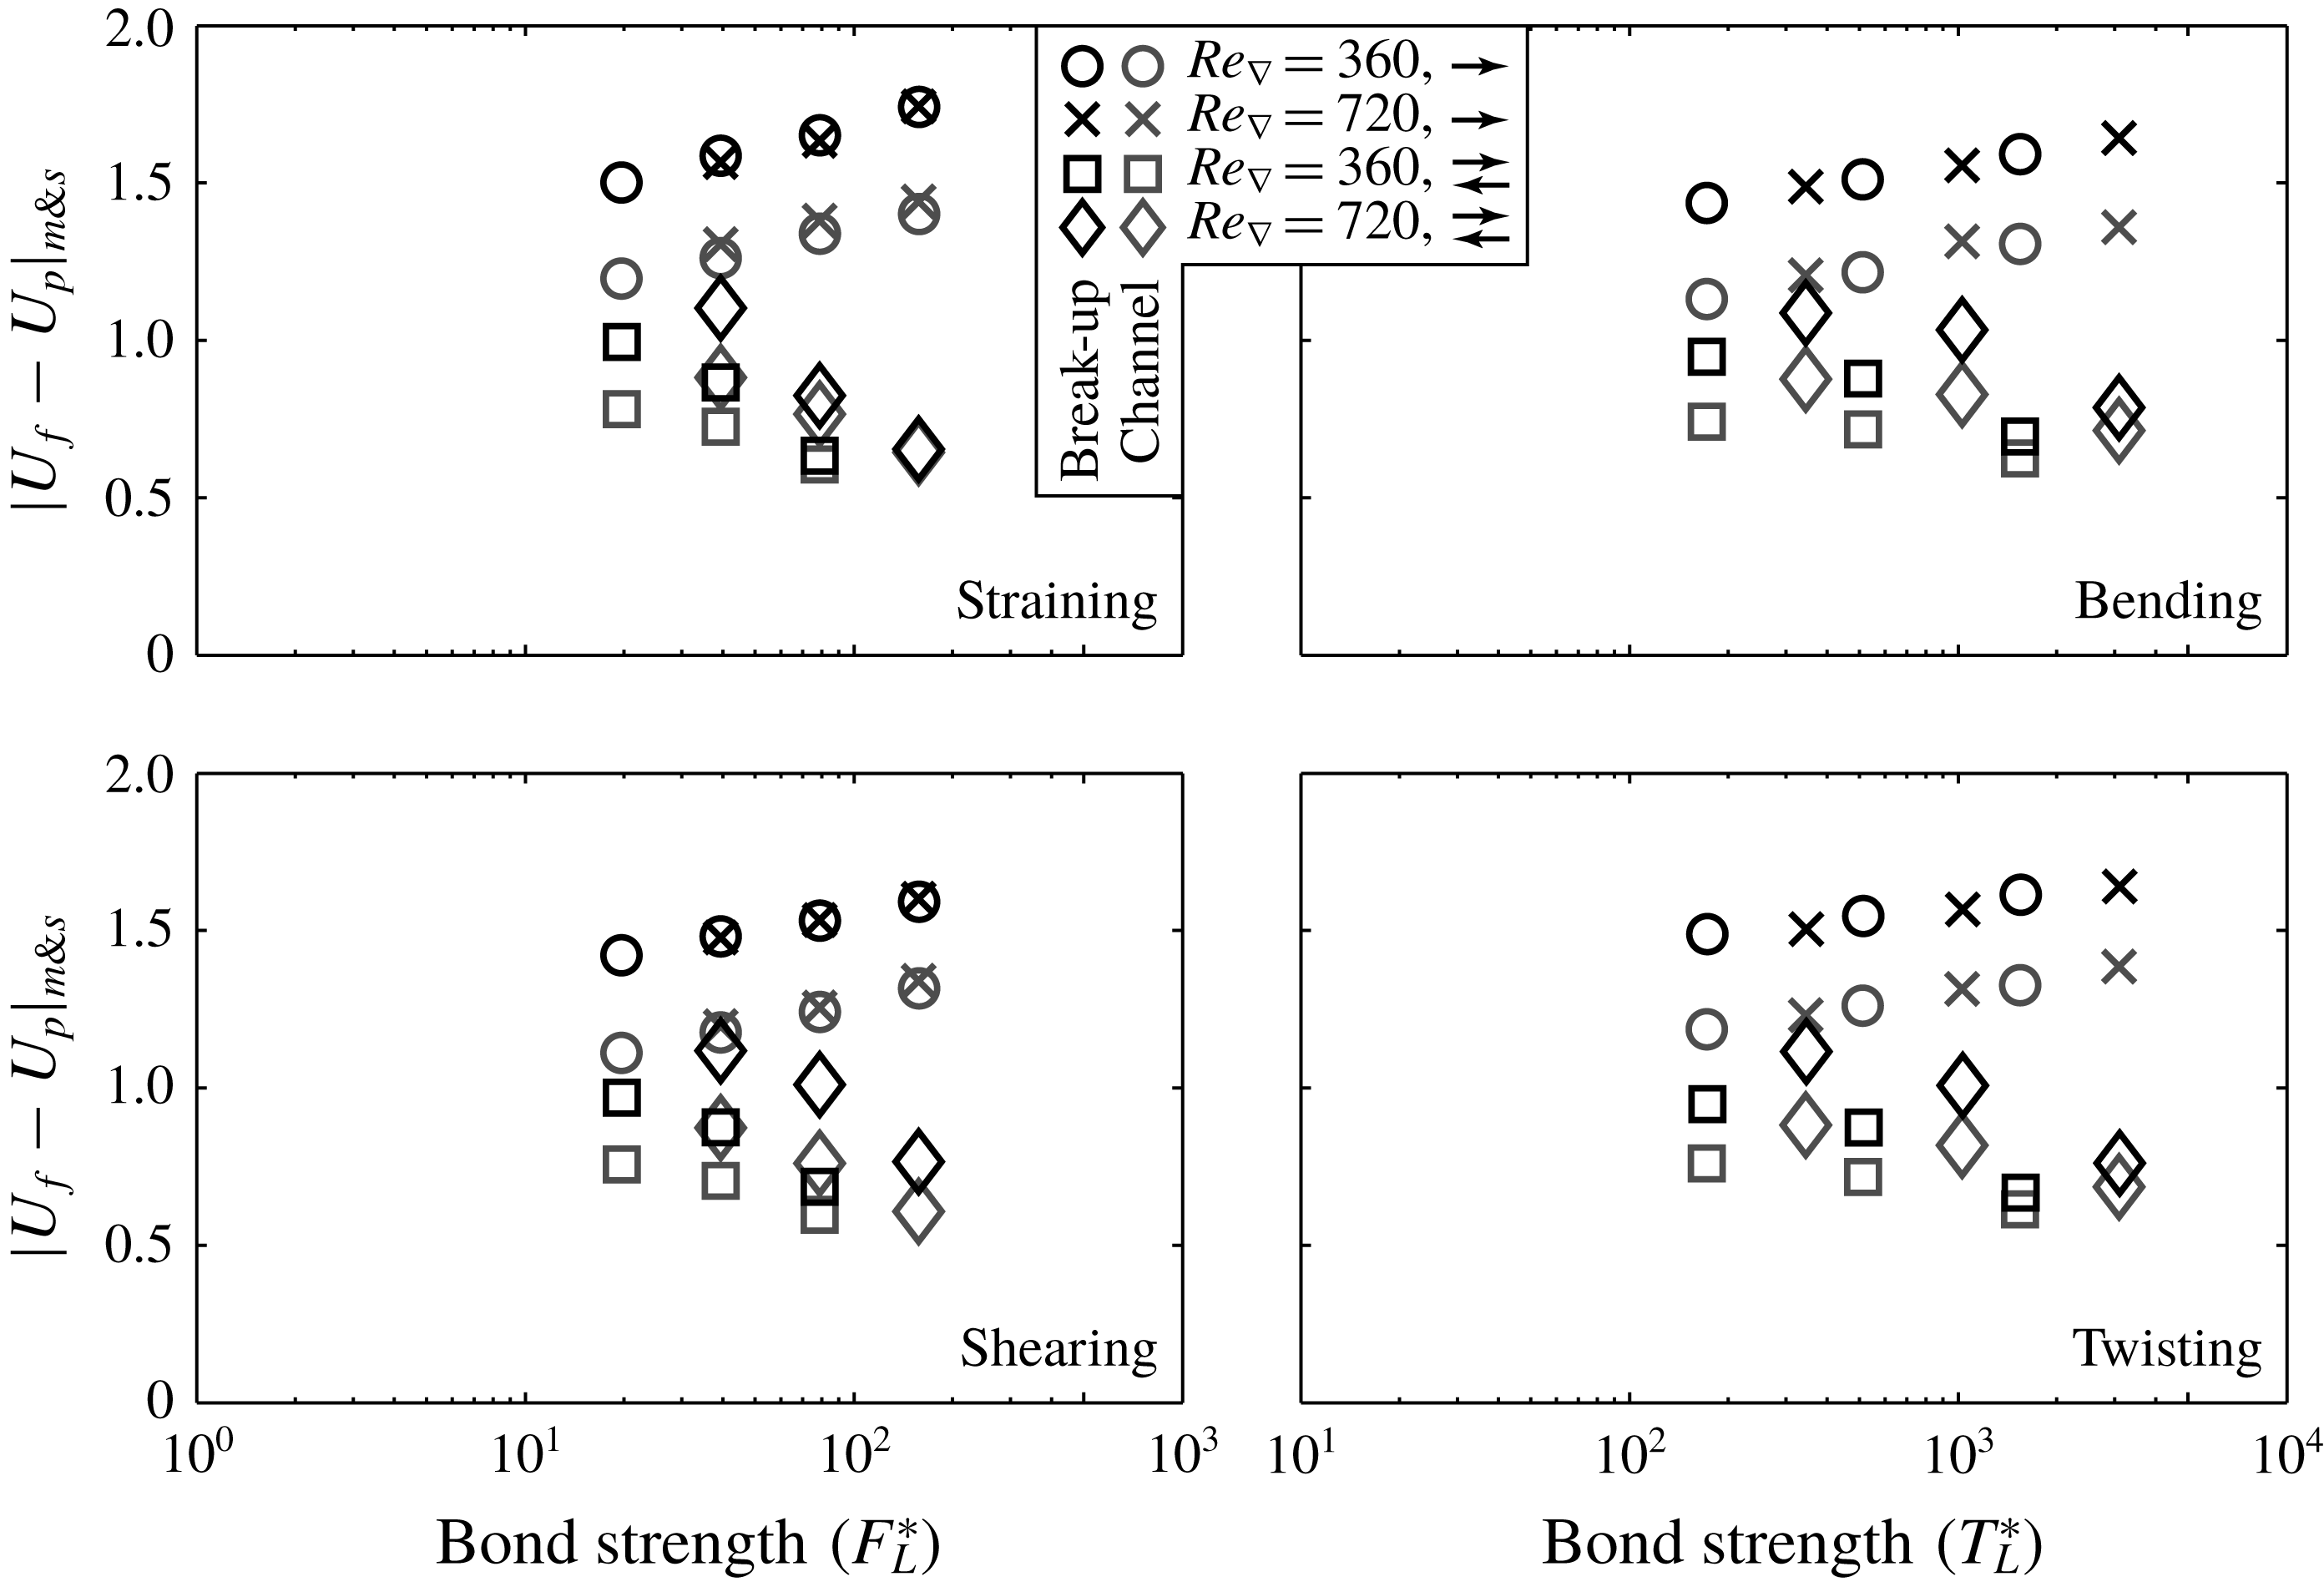
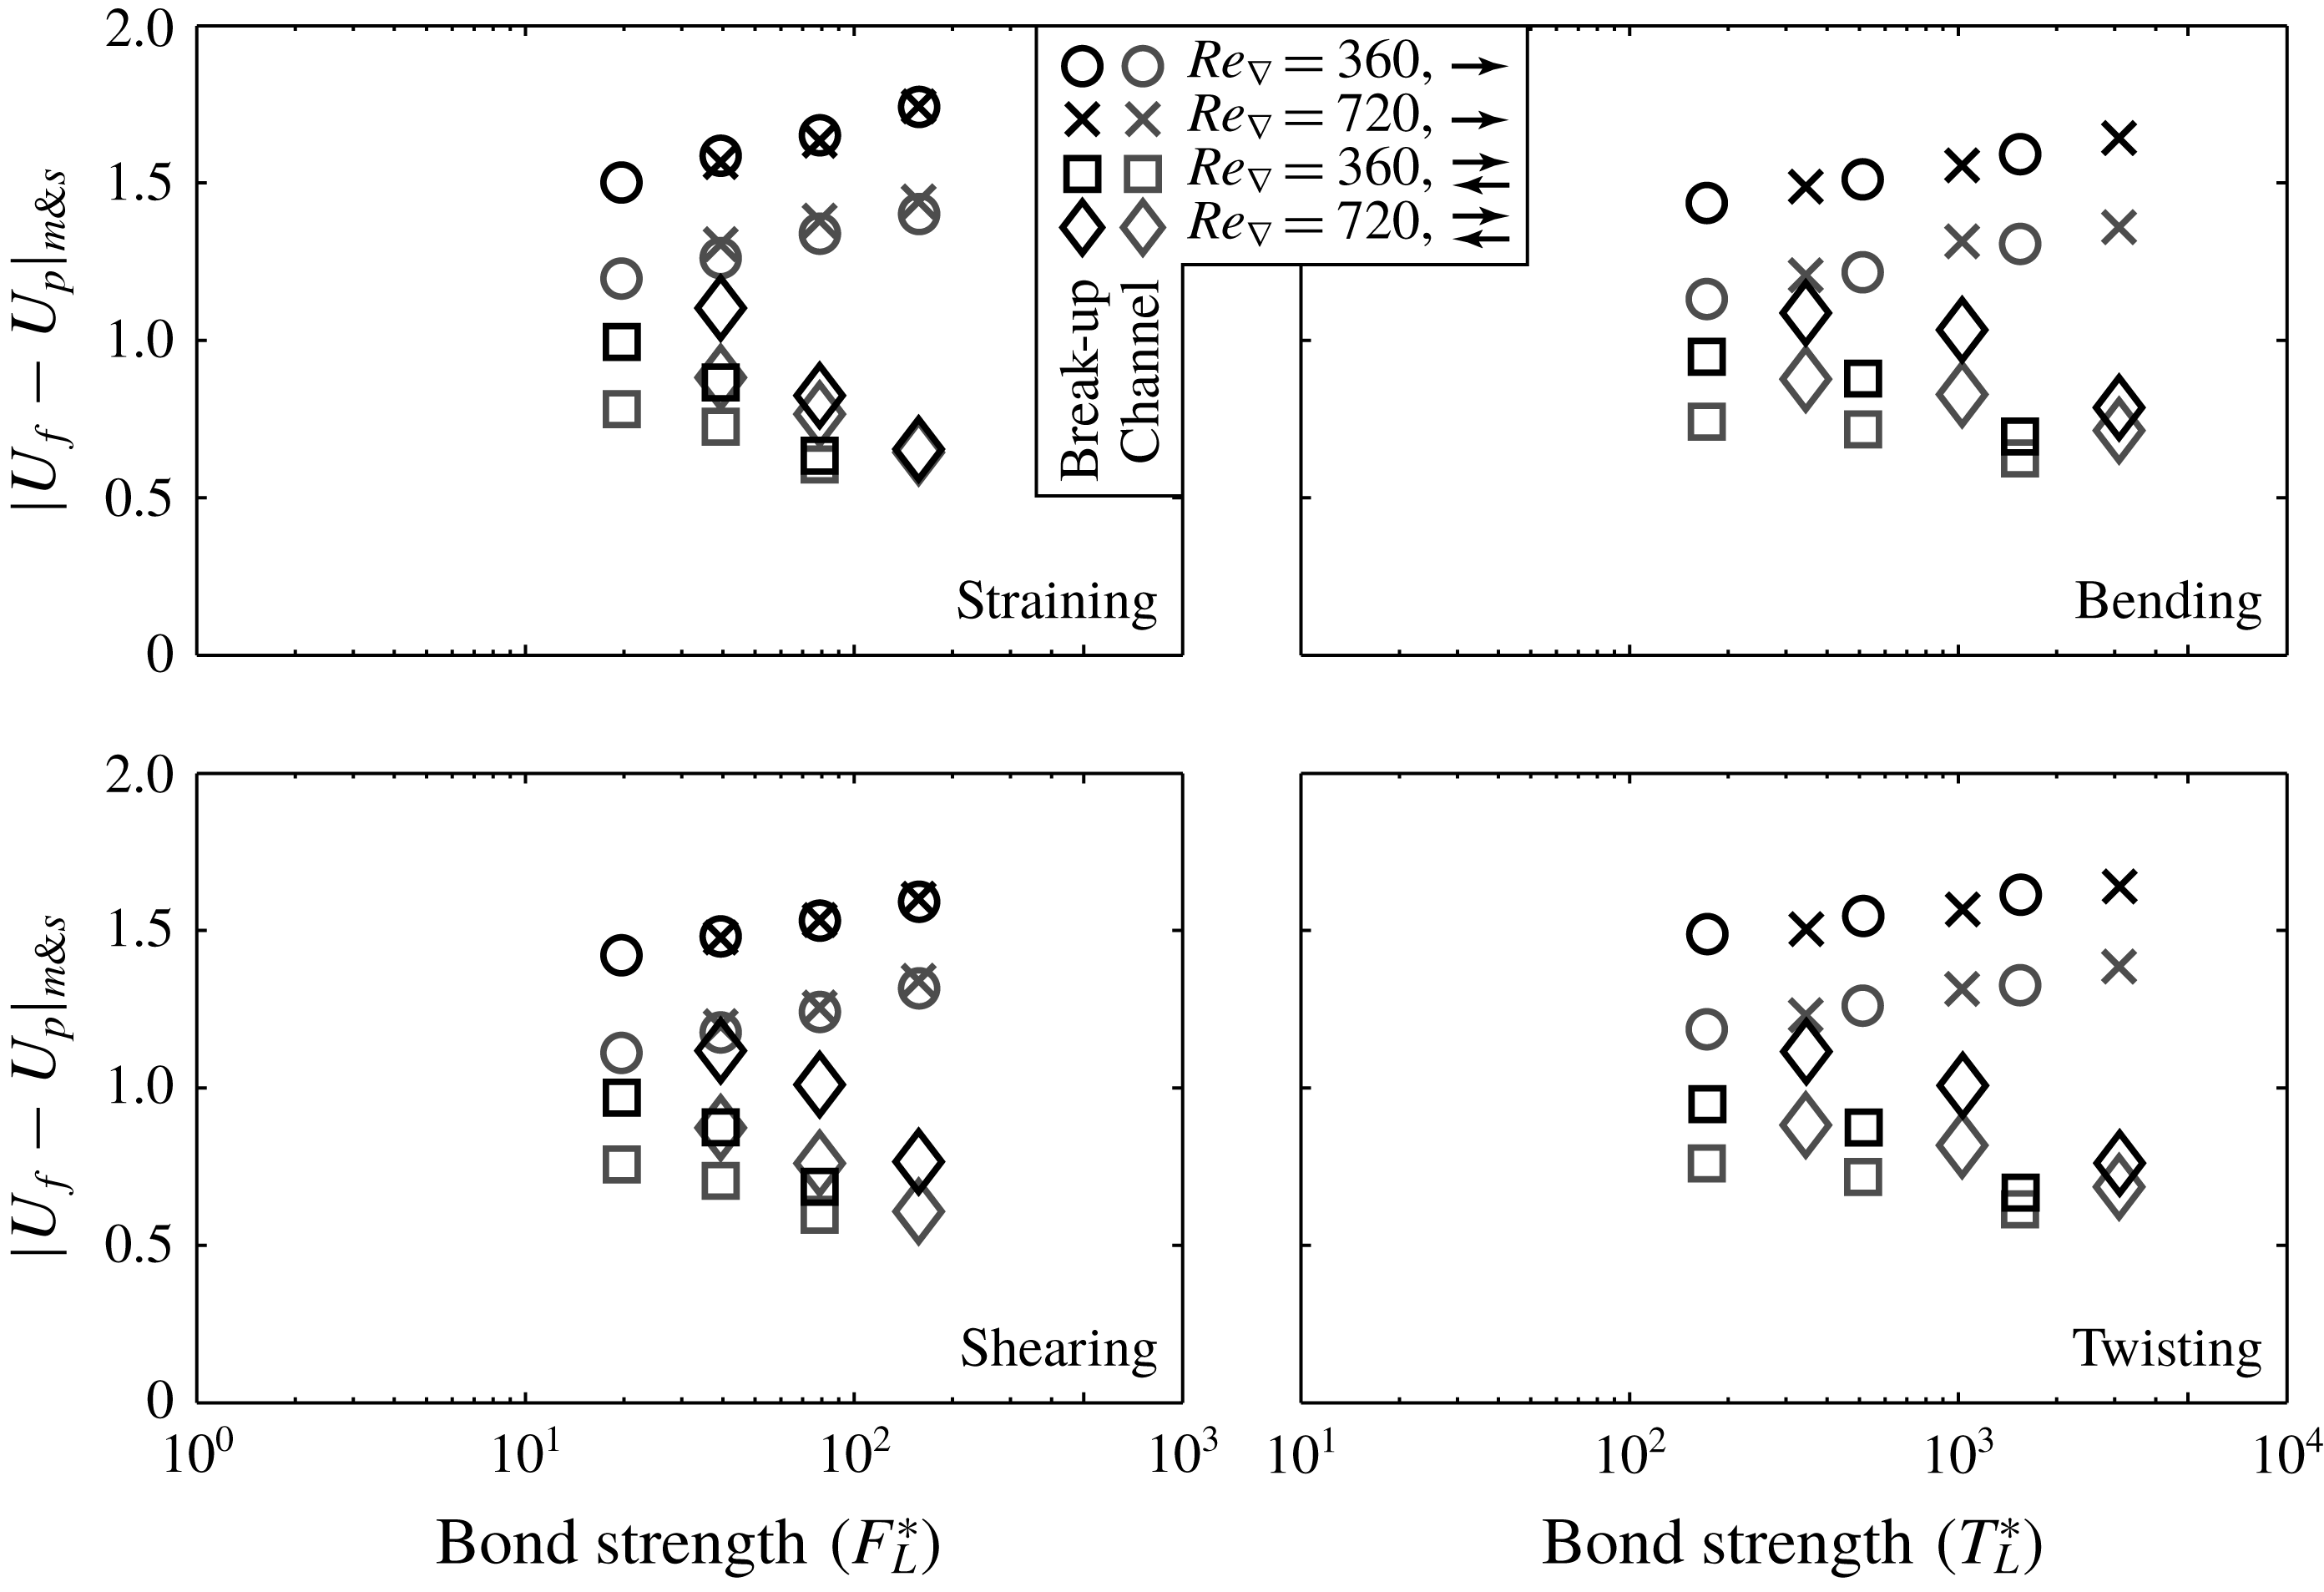
Figure 5 shows the magnitude of the average slip velocity of the primary particles, probed at the moment individual agglomerates are broken. The results in figure 5 show that: (I) in general, the slip velocities are larger in the pipe than in the channel; (II) the slip velocities decrease significantly when two-way coupling is considered instead of one-way coupling; (III) under two-way coupling the slip velocities are dependent on the value of
 $Re_{\unicode[STIX]{x1D6FB}}$
; and (IV) slip velocities are similar for the different break-up mechanisms.
Average magnitude of the primary particle slip velocity measured at agglomerate break-up. The quoted values are averages over all primary particles per simulation (not weighted per agglomerate).
Since the dispersed phase has a very small non-dimensional density, the agglomerates adapt quickly to local changes in the fluid flow velocity. Therefore, they act as a spatial filter to the fluid velocity along their perimeter. The more the different branches of one agglomerate protrude through different turbulent eddies, the more the characteristic slip velocity of the primary particles will approach the characteristic velocity difference between these eddies. Due to the curvature of the flow domain, the turbulent inner layer (which is characterized by a large wall-normal streamwise velocity gradient and strong turbulent velocity fluctuations) occupies a larger volumetric fraction of the flow domain in the pipe than it does in the channel. Therefore, it has more opportunity to interact with the dispersed phase. Together, this explains why the average magnitude of the slip velocity of the primary particles is larger in the former geometry.
Two-way coupling induces feedback of the velocity filtering experienced by the agglomerates onto the flow. As shown before, this attenuates local fluid velocity fluctuations, which in turn results in a decrease of the average primary particle slip velocity compared to one-way coupling. The stronger attenuation of turbulence by agglomerates with larger values of
 $F_{L}^{\ast }$
and
 $T_{L}^{\ast }$
found in § 5.2 is consistent with the growing deviation between the one- and two-way coupled average slip velocities as the strength of the agglomerates is increased.
6.2 Derivation of a simple model for the induced internal stresses in an agglomerate
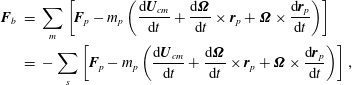
Rewriting (2.3), it follows that the linear stress induced in an arbitrary bond
 $b$
inside an agglomerate can be written in the form:
 $$\begin{eqnarray}\displaystyle \boldsymbol{F}_{b} & = & \displaystyle \mathop{\sum }_{m}\left[\boldsymbol{F}_{p}-m_{p}\left(\frac{\text{d}\boldsymbol{U}_{cm}}{\text{d}t}+\frac{\text{d}\unicode[STIX]{x1D734}}{\text{d}t}\times \boldsymbol{r}_{p}+\unicode[STIX]{x1D734}\times \frac{\text{d}\boldsymbol{r}_{p}}{\text{d}t}\right)\right]\nonumber\\ \displaystyle & = & \displaystyle -\mathop{\sum }_{s}\left[\boldsymbol{F}_{p}-m_{p}\left(\frac{\text{d}\boldsymbol{U}_{cm}}{\text{d}t}+\frac{\text{d}\unicode[STIX]{x1D734}}{\text{d}t}\times \boldsymbol{r}_{p}+\unicode[STIX]{x1D734}\times \frac{\text{d}\boldsymbol{r}_{p}}{\text{d}t}\right)\right],\end{eqnarray}$$
where the summation ranges
 $m$
and
 $s$
are used to distinguish the two agglomerate branches that are linked by the bond
 $b$
. If we now use (let
 $\unicode[STIX]{x1D644}$
be the moment of inertia tensor of the agglomerate in the stationary reference frame):
 $$\begin{eqnarray}\unicode[STIX]{x1D644}\frac{\text{d}\unicode[STIX]{x1D734}}{\text{d}t}=\mathop{\sum }_{m\& s}[\boldsymbol{r}_{p}\times \boldsymbol{F}_{p}]-\frac{\text{d}\unicode[STIX]{x1D644}}{\text{d}t}\unicode[STIX]{x1D734}\quad \text{and}\quad \frac{\text{d}\boldsymbol{U}_{cm}}{\text{d}t}=\mathop{\sum }_{m\& s}\left[\frac{\boldsymbol{F}_{p}}{m_{a}}\right].\end{eqnarray}$$
Equation (6.1) can be re-arranged as:
 $$\begin{eqnarray}\boldsymbol{F}_{b}=\mathop{\sum }_{m}\left[\boldsymbol{F}_{p}-m_{p}\left(\mathop{\sum }_{m\& s}\left[\frac{\boldsymbol{F}_{p}}{m_{a}}\right]+\unicode[STIX]{x1D644}^{-1}\left(\mathop{\sum }_{m\& s}[\boldsymbol{r}_{p}\times \boldsymbol{F}_{p}]\times \boldsymbol{r}_{p}\right)+\boldsymbol{C}_{m}\right)\right],\end{eqnarray}$$
where
 $\boldsymbol{C}_{m}$
represents all terms that do not depend on the hydrodynamic force
 $\boldsymbol{F}_{p}$
, but instead are associated with the centripetal acceleration of the solid body motion of the agglomerate.
The cross-products of
 $\boldsymbol{F}_{p}$
and
 $\boldsymbol{r}_{p}$
cross-correlate the individual component of
 $\boldsymbol{F}_{b}$
with all components of
 $\boldsymbol{F}_{p}$
. If we assume, however, that characteristic values of the magnitude of the individual components of
 $\boldsymbol{F}_{p}$
are well represented by the characteristic values of the magnitude of
 $\boldsymbol{F}_{p}$
itself, equation (6.3) can be simplified to the form:
 $$\begin{eqnarray}|\boldsymbol{F}_{b}|\propto N_{m}\left[|\boldsymbol{U}_{f}-\boldsymbol{U}_{p}|_{m}-\frac{N_{m}}{N_{m}+N_{s}}|\boldsymbol{U}_{f}-\boldsymbol{U}_{p}|_{m\& s}\right]+\boldsymbol{C}_{m},\end{eqnarray}$$
where
 $N_{m}$
represents the number of particles in the agglomerate branch
 $m$
and
 $N_{s}$
the number of particles in branch
 $s$
.
The constant term
 $\boldsymbol{C}_{m}$
(and, likewise,
 $\boldsymbol{C}_{s}$
), typically makes a small (
 ${<}$
10 %) contribution to the magnitude of the total induced stress
 $|\boldsymbol{F}_{b}|$
. This is substantially smaller than the results found by Derksen (Reference Derksen2008), who found that the contribution of the centrifugal force to the average force induced in the bond in a sphere doublet is between 35 and 50 %. This discrepancy can be explained by the fact that we consider conditions at break-up (typically at a high of the turbulence contribution) and wall-bounded flows instead of homogeneous turbulence, thereby also including the effect of a mean velocity gradient. Because the constant terms in (6.4) are small, we can assume that the induced stresses inside the agglomerate effectively only depend on the slip velocity of the primary particles for deriving a simplified model for the agglomerate mass. In order to proceed, we further simplify (6.4). We assume that the characteristic values of
 $|\boldsymbol{U}_{f}-\boldsymbol{U}_{p}|$
in branch
 $m$
, in branch
 $s$
, as well as over the entire agglomerate, change by a similar factor if the number of primary particles in the agglomerate changes. Furthermore, we assume that the relative fragmentation of the agglomerates (that is, the ratio of the number of primary particles that end up in the branches
 $m$
and
 $s$
) is independent of the value of
 $F_{L}^{\ast }$
. In that case, the total number of primary particles
 $N_{bu}$
in an agglomerate that is broken at a given value of
 $F_{L}^{\ast }$
is proportional to:
 $$\begin{eqnarray}N_{bu}\propto \frac{F_{L}^{\ast }}{|\boldsymbol{U}_{f}-\boldsymbol{U}_{p}|_{m\& s}}.\end{eqnarray}$$
Similarly, the value of
 $N_{bu}$
for agglomerates that are broken by bending or twisting is expected to scale as:
 $$\begin{eqnarray}N_{bu}\propto \left[\frac{T_{L}^{\ast }}{|\boldsymbol{U}_{f}-\boldsymbol{U}_{p}|_{m\& s}}\right]^{D_{f}/(1+D_{f})},\end{eqnarray}$$
where
 $D_{f}$
is the fractal dimension of the agglomerates.
6.3 Scaling of mean mass of agglomerates at break-up
Given the dependence of the slip velocity shown in figure 5, it is to be expected that for one-way coupling, the mean mass of the agglomerates at break-up scales with
 $F_{L}^{\ast }$
to a power smaller than one. For two-way coupling, larger scaling exponents, which vary with the value of
 $Re_{\unicode[STIX]{x1D6FB}}$
are expected, because
 $|\boldsymbol{U}_{f}-\boldsymbol{U}_{p}|$
is found to vary with the Reynolds number in this case. Finally, because the slip velocities are larger in the pipe than in the channel, the agglomerate mass is expected smaller in the pipe compared to the channel at the same agglomerate strength.
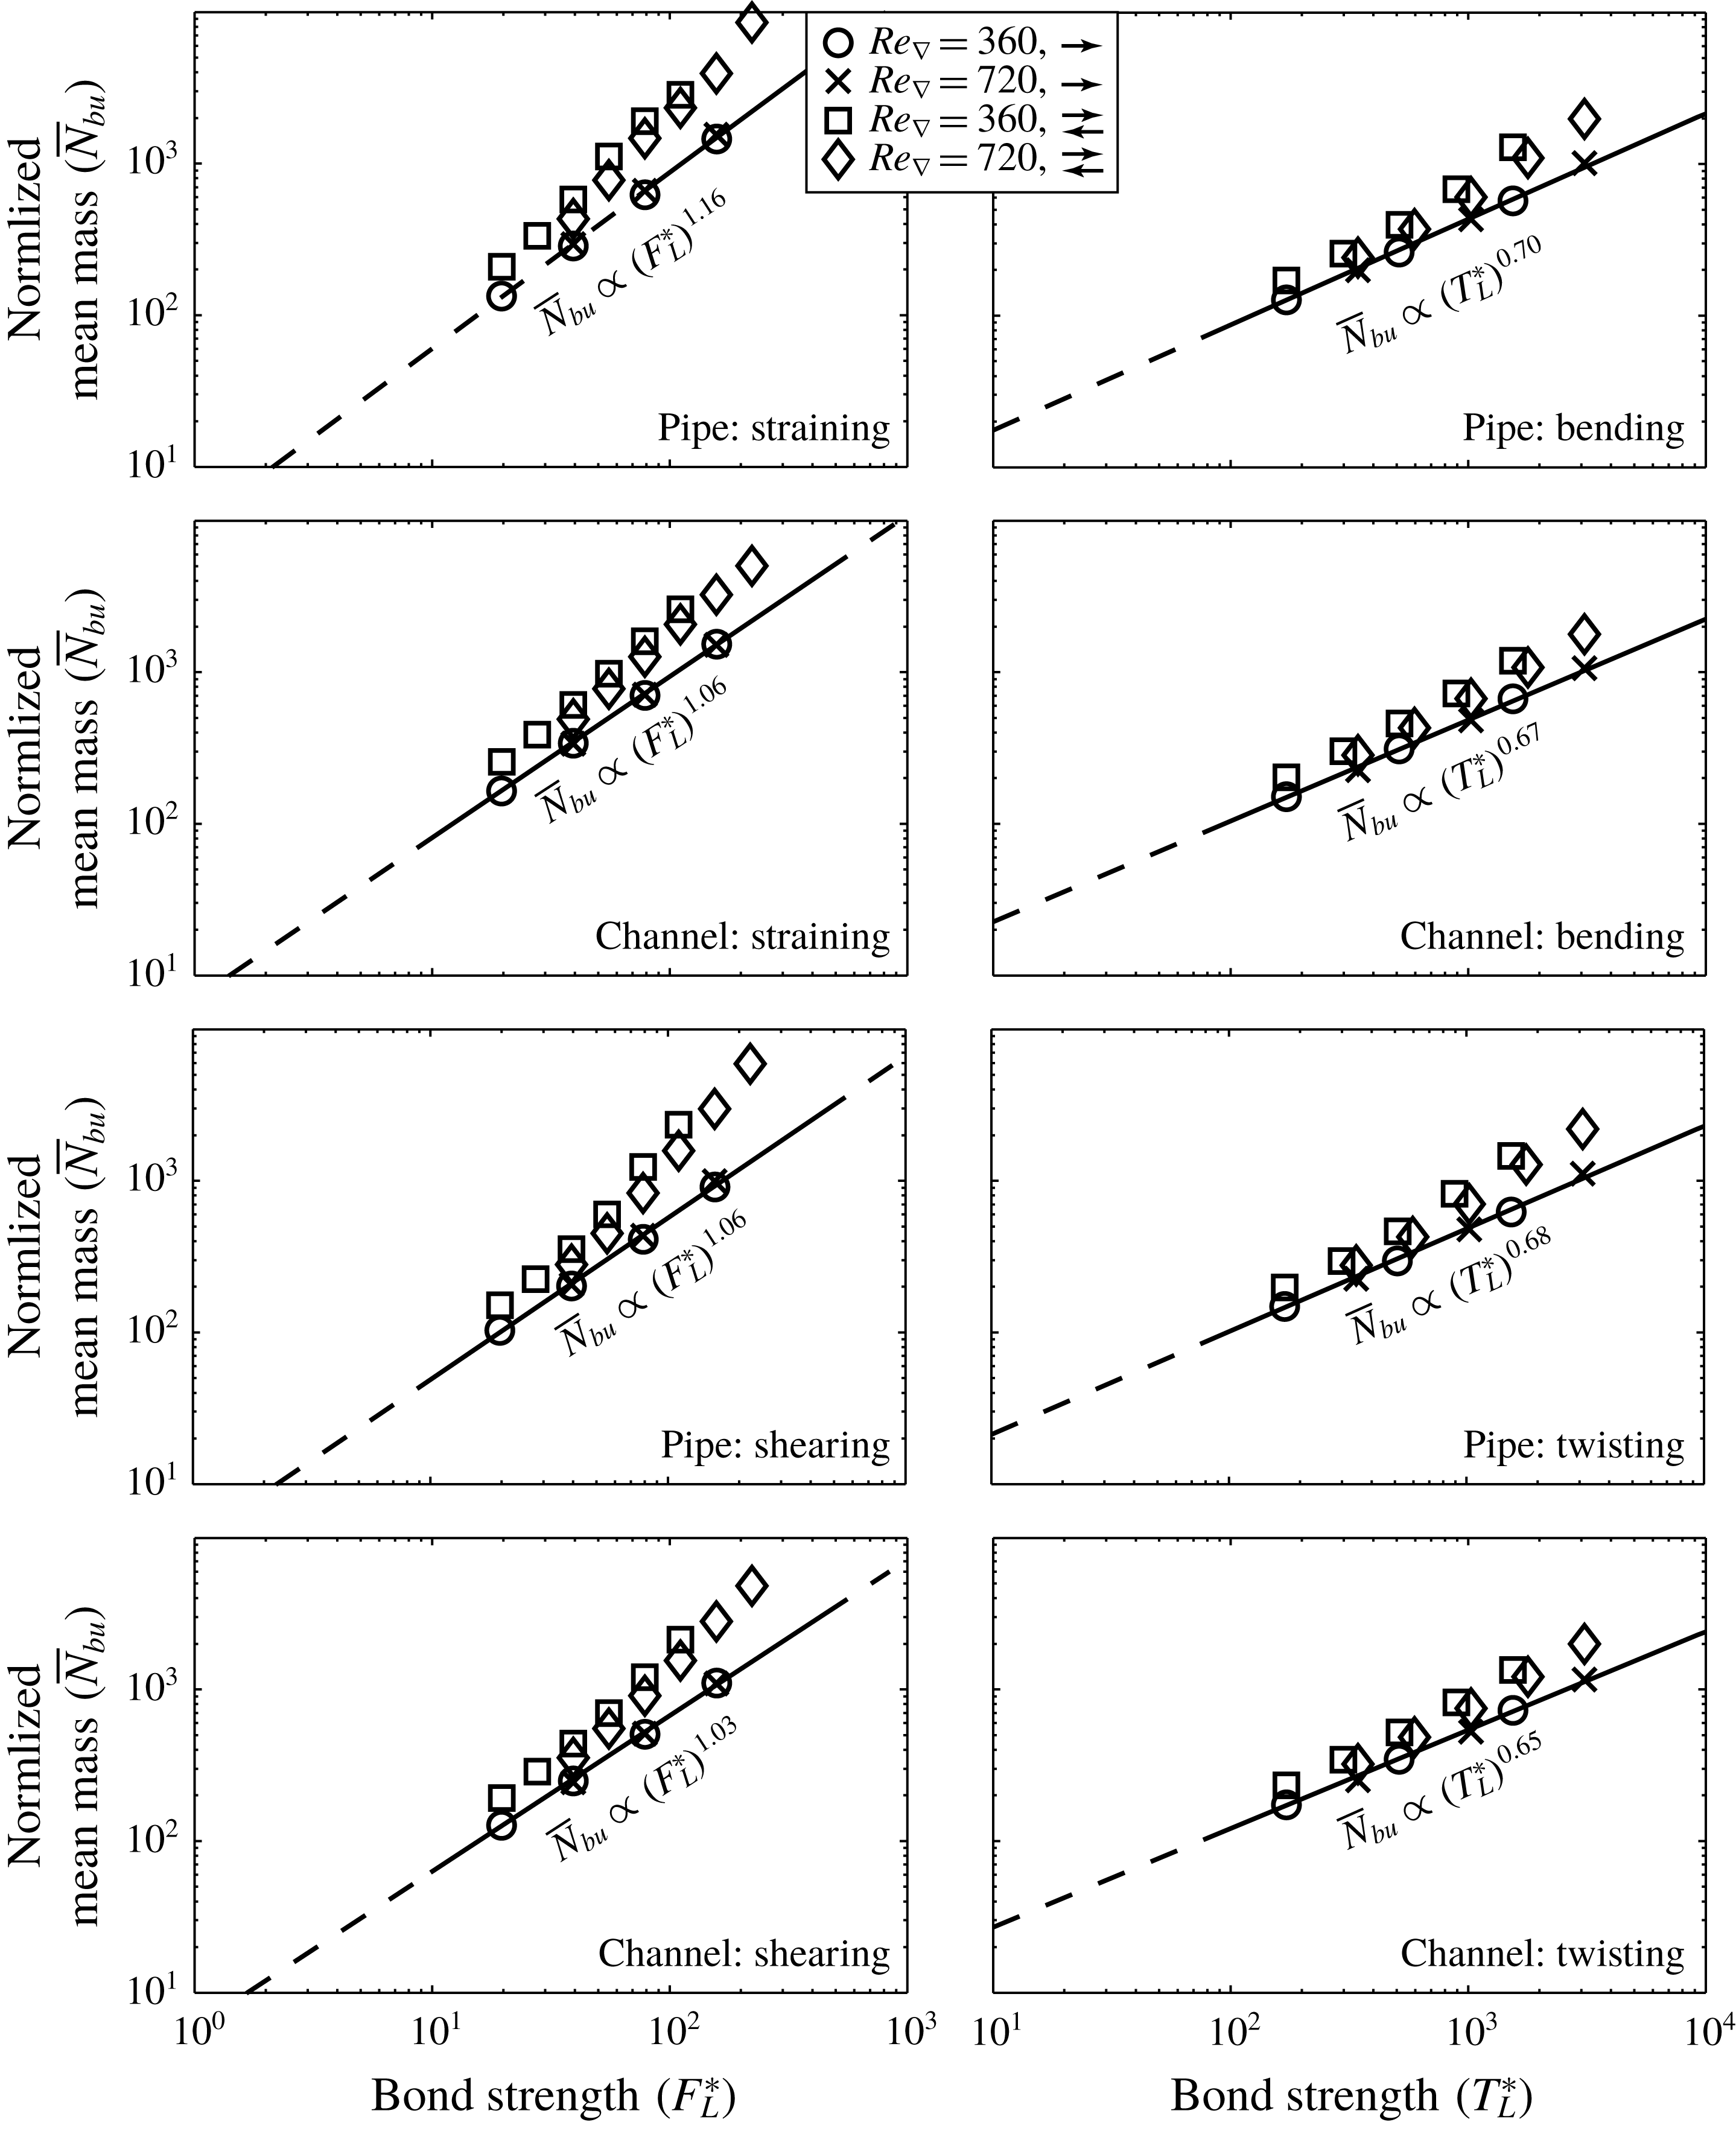
Figure 6 shows the dependence of the mean mass of the agglomerates at the moment that the agglomerates are broken (
 $\bar{N}_{bu}$
) as observed in our simulations. The solid lines in figure 6 are least-square fits that relate the mean mass of the agglomerates to the value of
 $F_{L}^{\ast }$
or
 $T_{L}^{\ast }$
for one-way coupling. As expected, the scaling exponents for two-way coupling are larger than for one-way coupling; also the two-way coupled scaling exponents indeed show some dependence on the Reynolds number. For one-way coupling, the scaling exponents are slightly larger than expected based on expressions (6.5) and (6.6). This discrepancy can be explained by considering that the simplified model does not account for possible variations in the direction of the hydrodynamic force exerted on different primary particles in each of the branches of the broken agglomerate. This variation, which will reduce the ability of the force to constructively contribute to the stress that is induced in the bond, will decrease as the agglomerates become larger. It thus will give rise to a higher scaling exponent between
 $\bar{N}_{bu}$
and
 $F_{L}^{\ast }$
or
 $T_{L}^{\ast }$
compared to the predictions given in expressions (6.5) and (6.6).
Scaling of the mean agglomerate mass at agglomerate break-up (
 $\bar{N}_{bu}$
).
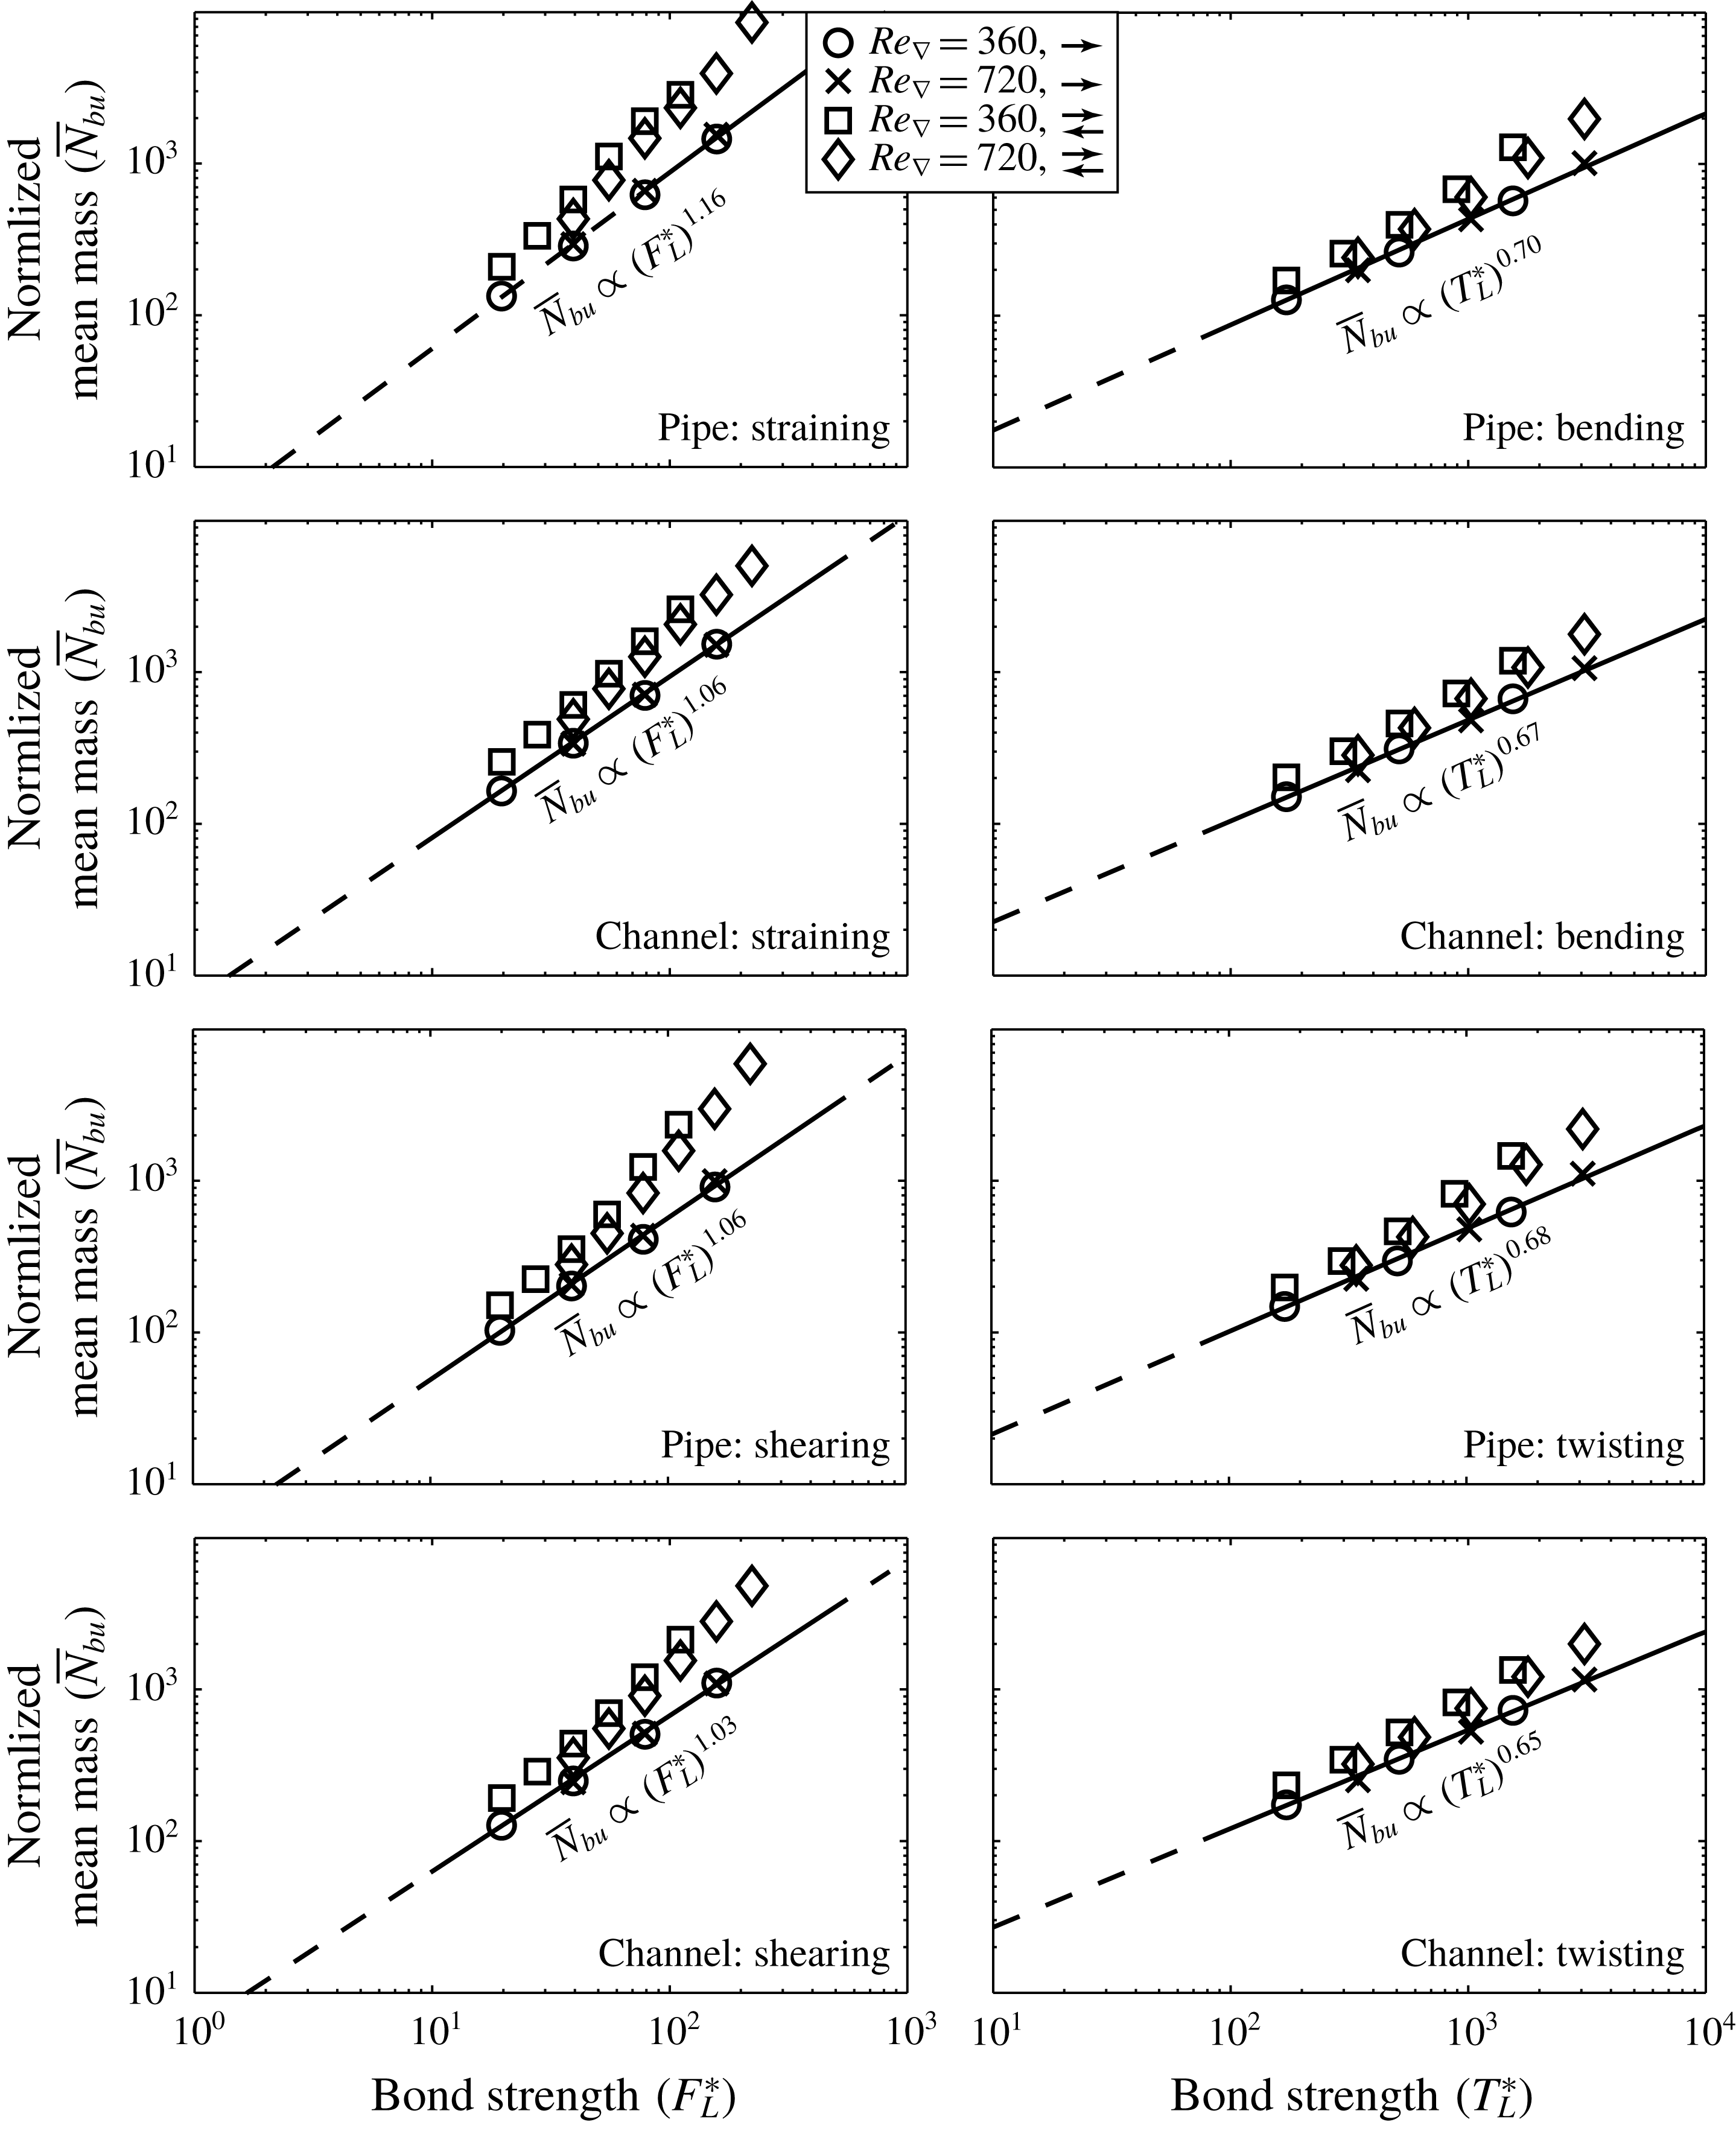
An interesting observation in figure 6 is that even though the mean mass of the agglomerates in general indeed is smaller in the pipe than in the channel, the values of
 $\bar{N}_{bu}$
increase much more strongly at large values of
 $F_{L}^{\ast }$
and
 $T_{L}^{\ast }$
in the pipe. We propose that the wall-normal concentration profile, in conjunction with the fact that the cross-sectional area of centre of the pipe is a lot smaller when compared to the area centred around the midplane of the channel, explains the differences in
 $\bar{N}_{bu}$
. As an example, let us consider an agglomerate that is located at a dimensionless wall-normal coordinate of 0.45 in both geometries (viz. at
 $z=0.45$
or
 $z=0.55$
in the channel, or at
 $r=0.05$
in the pipe). Upon break-up, the agglomerate branches that are moving apart in the transversal direction have the full channel width (
 $2H$
) at their disposal, before possibly touching again at the other side due to the periodic boundary conditions. The equivalent distance in the pipe geometry is
 $0.05\unicode[STIX]{x03C0}$
times the pipe diameter, which is just 8 % of the distance available in the channel. Only from a wall-normal coordinate of 0.18 outwards, the circumference of the pipe becomes larger than the width of the channel. Agglomerates that are present close the centre of the pipe thus have a larger chance of re-colliding shortly after they are being broken, thereby growing to larger dimensions than in the channel.
6.4 Fractal dimension
The agglomerates formed in our simulations have a very open, porous structure. Even though the agglomerates arguably contain too few primary particles
 $O(100{-}1000)$
to qualify as proper fractal objects, attributing a fractal dimension to them is instructive to assess their structure. The mass fractal dimension
 $D_{f}$
is defined as:
 $$\begin{eqnarray}m_{a}\propto R_{g}^{D_{f}},\end{eqnarray}$$
where
 $m_{a}$
represents the mass of an individual agglomerate and
 $R_{g}$
is a representative radius of the agglomerates. In this work, we use the radius of gyration for representing the agglomerate radius, which is defined as:
 $$\begin{eqnarray}R_{g}\equiv \sqrt{\frac{1}{N}\mathop{\sum }_{p}(\boldsymbol{r}_{p}\boldsymbol{\cdot }\boldsymbol{r}_{p})},\end{eqnarray}$$
where the sum runs over all
 $N$
primary particles in the agglomerate.
To determine the fractal dimension of the agglomerates, a large ensemble of (
 $m$
,
 $R_{g}$
) data points is obtained from steady-state agglomerate populations. This ensemble is subsequently divided into 100 sections of increasing agglomerate mass, and for each of these sections, the average value of
 $R_{g}$
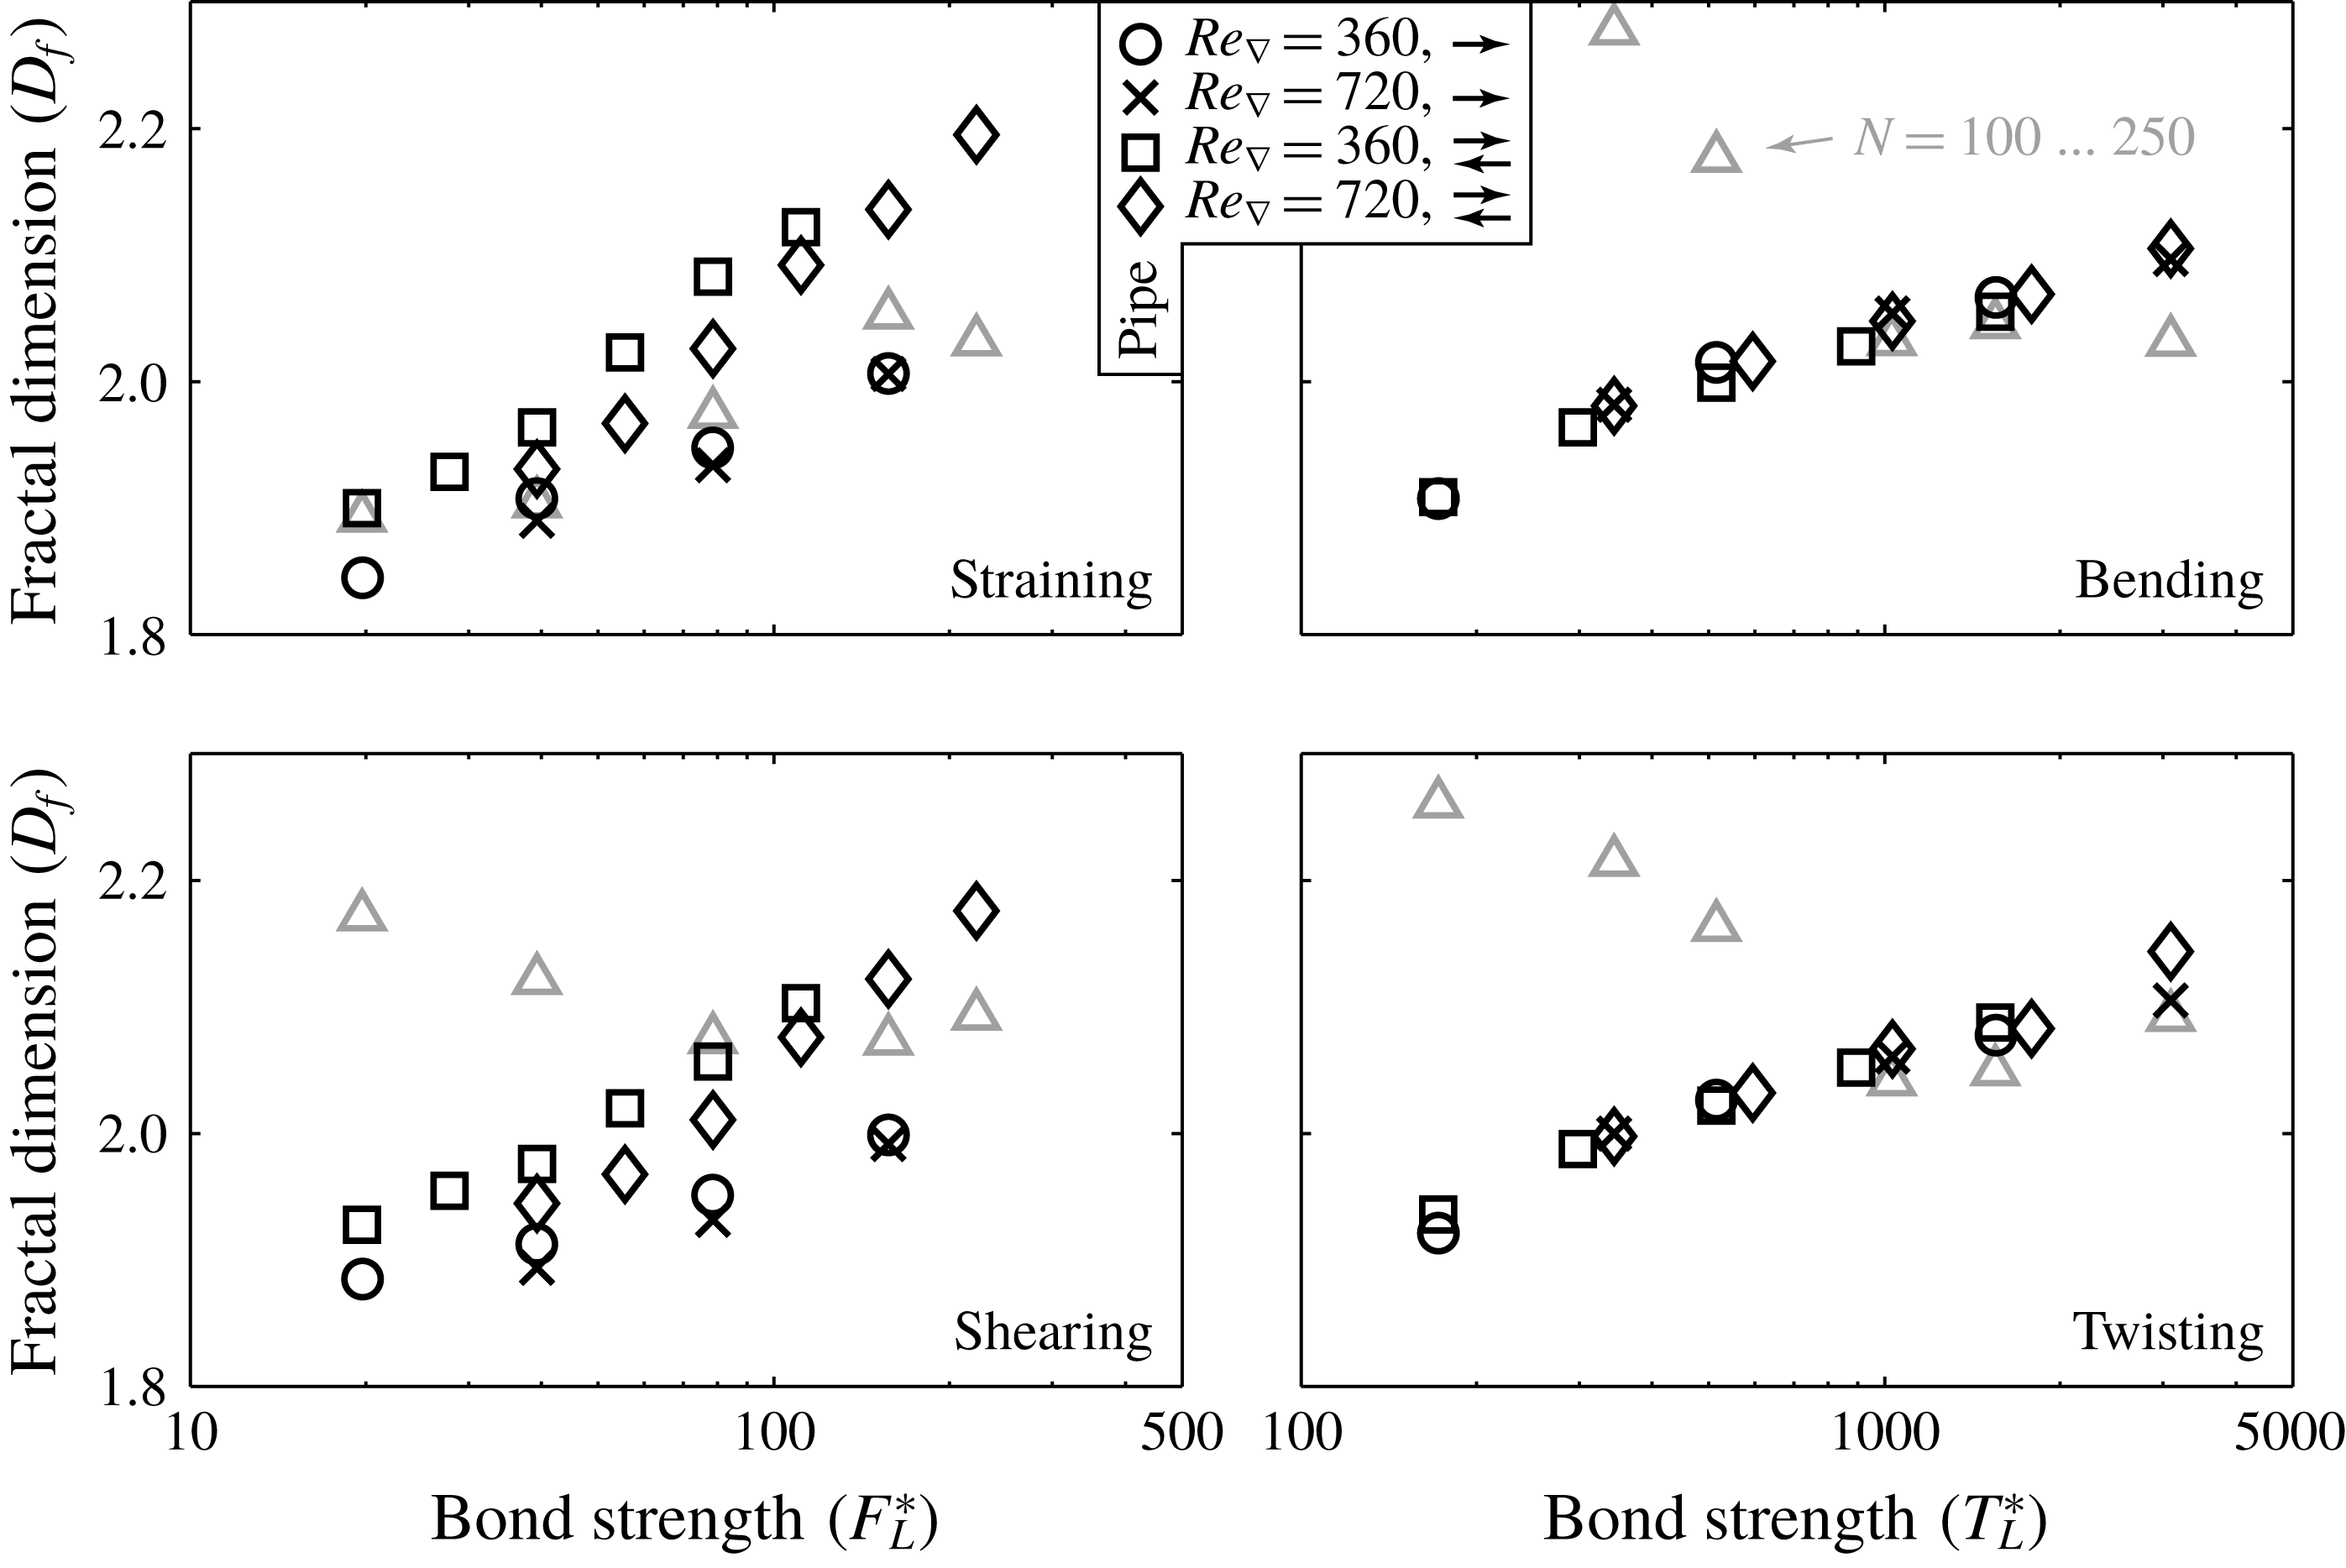
is determined; subsequently expression (6.7) is fit to these data to obtain the fractal dimension of the agglomerates. Figure 7 summarizes the results obtained this way.
Overall fractal dimensions for steady-state agglomerate populations for the different cases considered, amended by average fractal dimensions for a subset of agglomerates (with
 $N=100{-}250$
). The supplementary material shows the same figure, though with inclusion of the channel results.
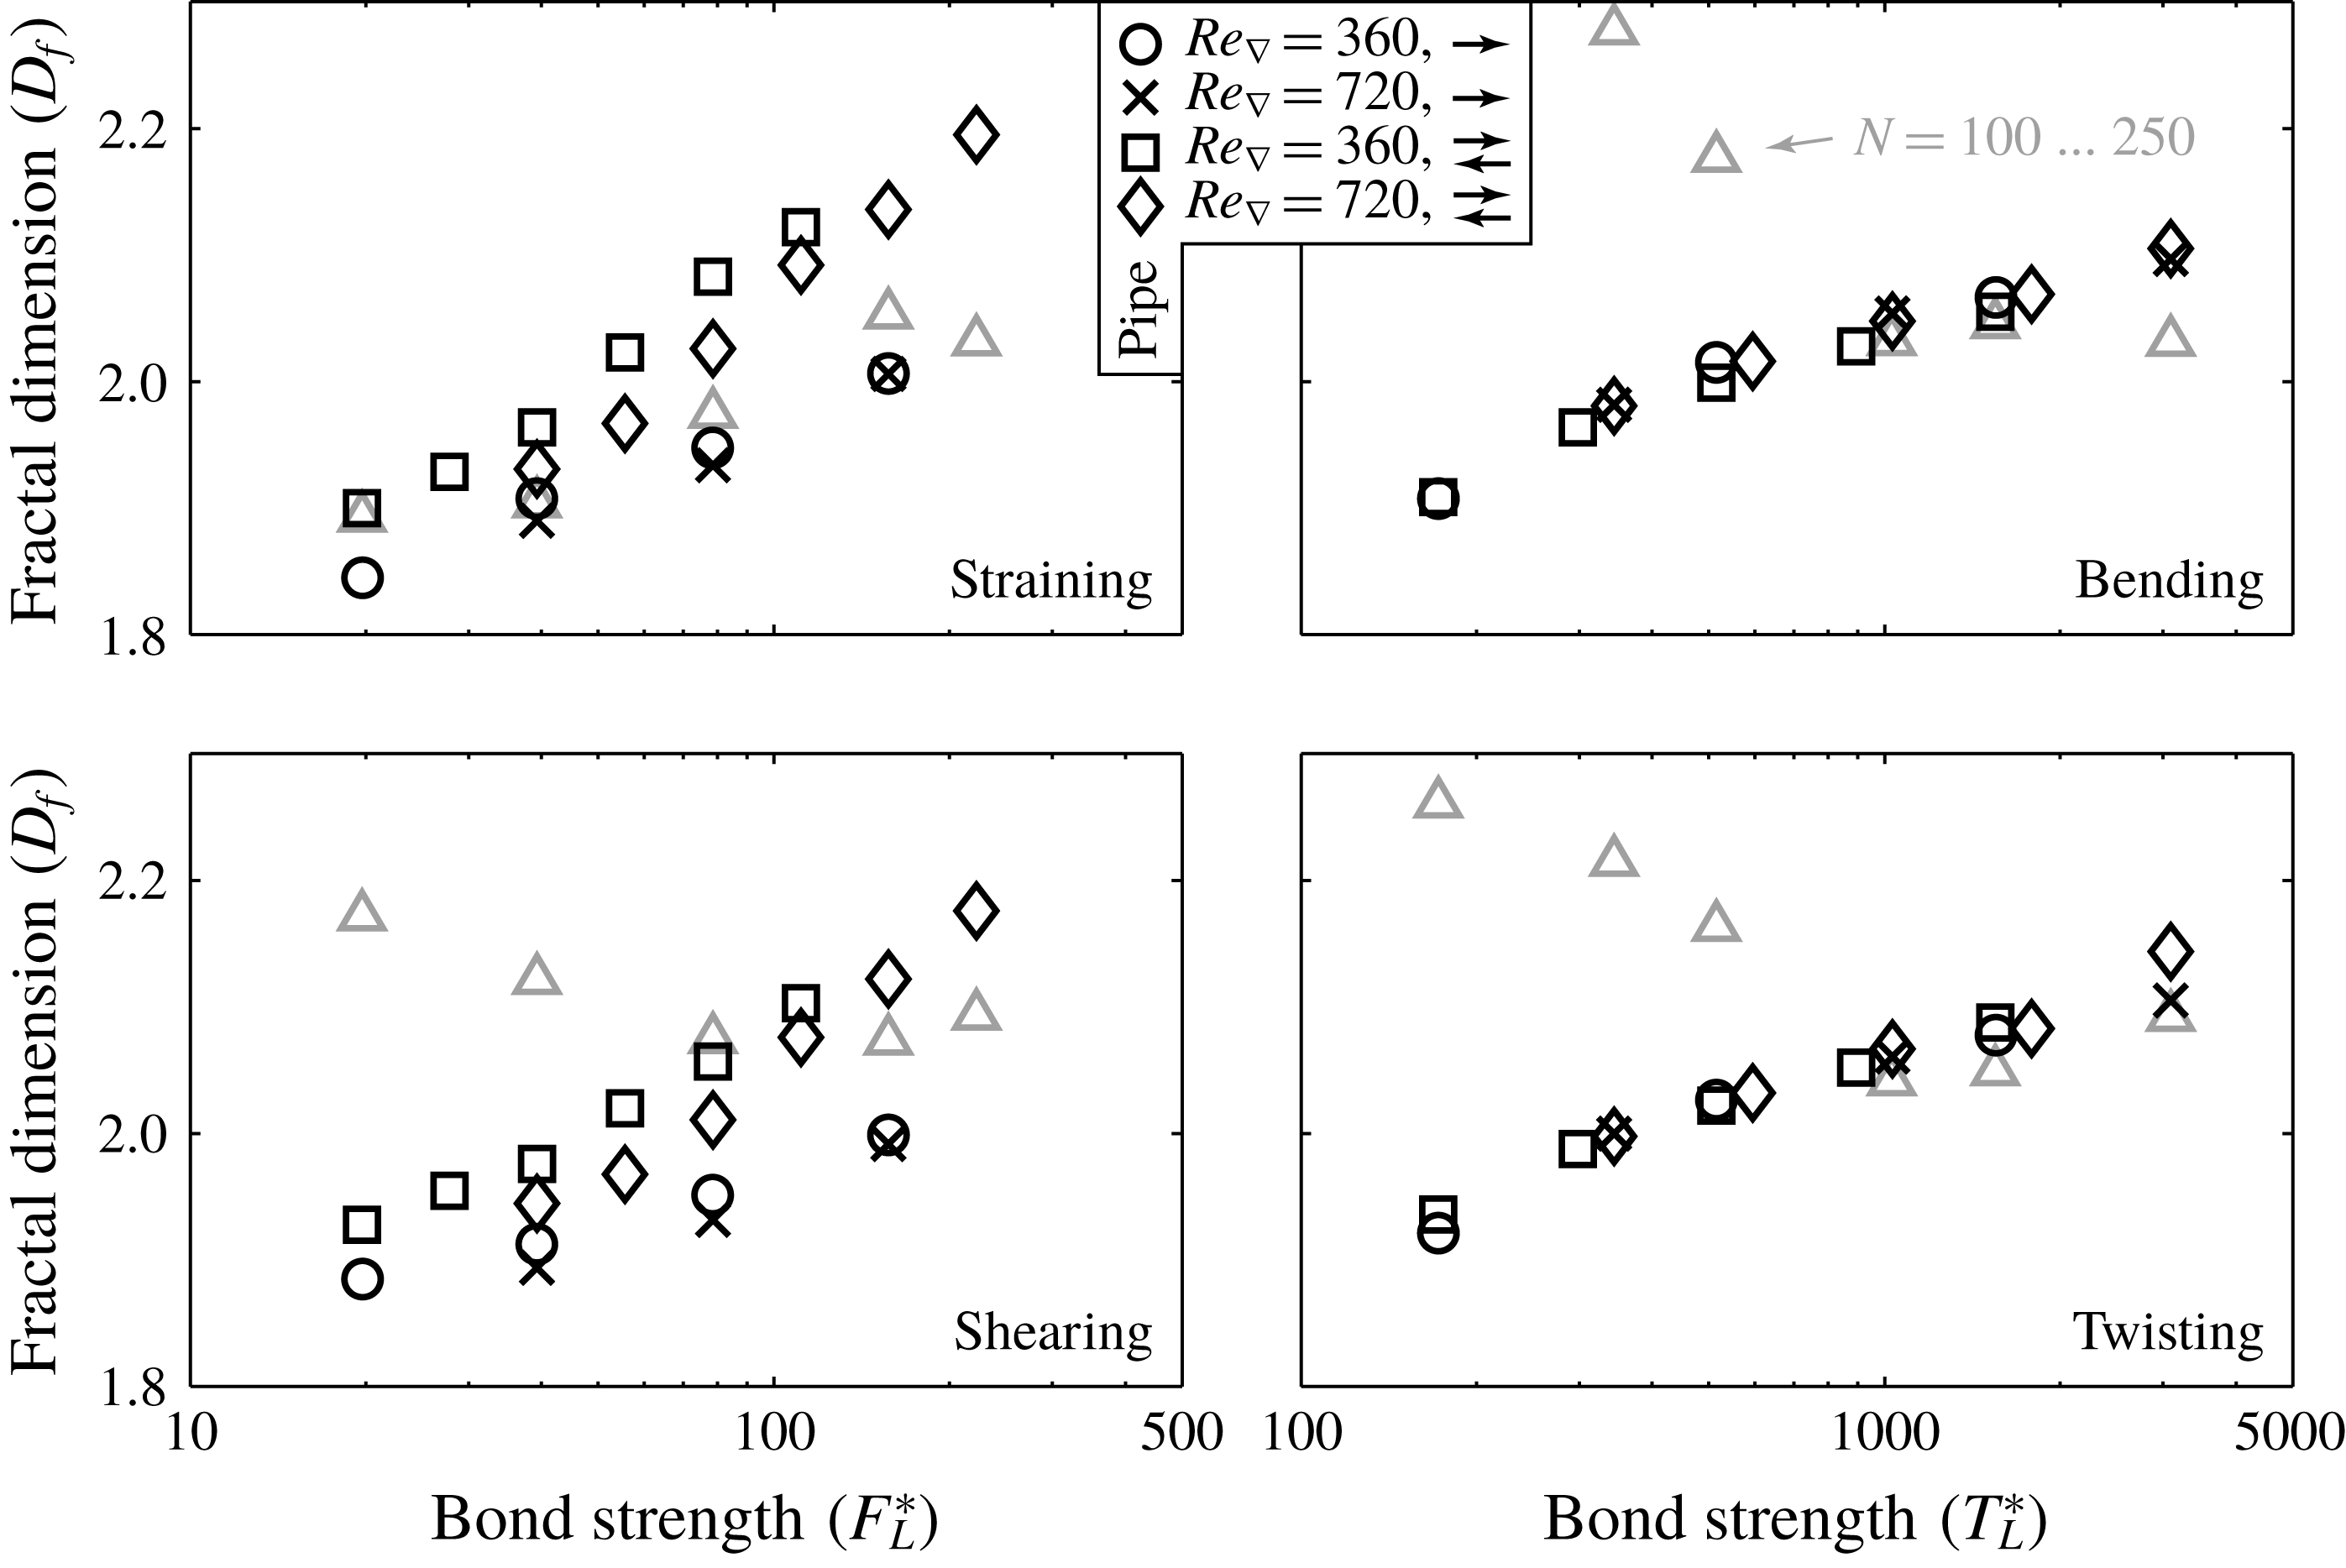
For the overall fractal dimension (putting – for the moment – aside the data points marked with
 $N=100{-}250$
), a general monotonic increase of
 $D_{f}$
is found with increasing values of
 $F_{L}^{\ast }$
and
 $T_{L}^{\ast }$
. Break-up and subsequent re-agglomeration is known to increase the fractal dimension of agglomerates (Lazzari et al.
Reference Lazzari, Nicoud, Jaquet, Lattuada and Morbidelli2016). The overall fractal dimensions span the range reported by Meakin & Jullien (Reference Meakin and Jullien1988) for the mechanism that is closest to our model (diffusion limited aggregation) without and with restructuring (
 $D_{f}=1.80$
and
 $D_{f}=2.18$
, respectively). Confirming visual observations, the range of fractal dimensions obtained indicates that the agglomerates have a very open, porous structure.
Since the fractal dimension is a measure of the degree of compactness of the agglomerates, differences in the fractal dimension are related to the degree of inter-penetration that agglomerates attain before colliding. As the number of primary particles per agglomerate is still relatively small in our simulations, the voids in the agglomerates will become larger with respect to the primary particle size when the agglomerates become larger. Therefore, inter-penetration becomes more easy as agglomerates grow and this way, the general increase of
 $D_{f}$
with
 $F_{L}^{\ast }$
and
 $T_{L}^{\ast }$
can be understood. Agglomerate branches that consist of only a small number of primary particles can easily protrude into the matrix of another, larger agglomerate branch. It therefore may be expected that agglomerate re-structuring, caused by subsequent break-up and collision events within the same agglomerate, is dominated by those break-up events in which one of the branches of the broken agglomerate contains much less primary particles than the other branch. If such an event occurs, the question whether the agglomerate will re-structure into a more compact or a more open form depends on the relative motion of both agglomerate branches after they are broken apart.
Accepting this re-structuring mechanism enables us to explain the influence of two-way coupling and of the Reynolds number on the fractal dimension of the agglomerates. Since the inertia of the agglomerates is relatively low, small agglomerate branches can quickly adapt to the local fluid velocity fluctuations that occur in the turbulent flow. Therefore, the chance that a small agglomerate branch can escape from the vicinity of its large counterpart increases when the intensity of the turbulence increases. Agglomerates will thus become less compact (and have a smaller fractal dimension) when the Reynolds number is increased, and more compact when the turbulence fluctuations (and thus the local fluid velocity differences surrounding both agglomerate branches) are damped due to two-way coupling. Since the impact of two-way coupling compared to one-way coupling is stronger in the pipe than it is in the channel, this effect also explains the stronger increase of the fractal dimension with the strength of the inter-particle bonds found in the two-way coupled pipe flow simulations when compared to the channel flow (as shown in the supplementary material). As the effective turbulence intensity as felt by the dispersed phase is larger in the pipe than in the channel due to the relative expansion of the turbulent inner layer, this effect also contributes to the general decrease of
 $D_{f}$
in the pipe compared to the channel.
To better understand how the fractal dimension of the agglomerates varies within an agglomerate population, results on the fractal dimension of a subset of agglomerates (with
 $N=100{-}250$
) that are present in all simulations are also shown in figure 7. These fractal dimension are averaged over all flow conditions considered and will be denoted by
 $D_{f}^{100{-}250}$
. It is important to appreciate that the
 $N=100{-}250$
subset of the agglomerates comprise some of the largest of the population at small values of
 $F_{L}^{\ast }$
or
 $T_{L}^{\ast }$
. Contrary, at large strengths, this subset comprises the smallest agglomerates present. The larger the value of
 $D_{f}$
is, the smaller are the dimensions of an agglomerate that consists of a given number of primary particles. Large values of
 $D_{f}$
therefore enhance the chance that many primary particles of an agglomerate are surrounded by the same turbulent eddy. In turn, this increases the likelihood that the external force that acts on the particles is directed roughly in the same direction. As the latter may allow a small branch to harvest sufficient external force to break free from its parent agglomerate, large values of
 $D_{f}$
promote the formation of agglomerate branches that are small compared to the total population. On the contrary, having an open structure is beneficial for forming relatively large agglomerates. The relative size of the
 $N=100{-}250$
agglomerates in the total population depending on the agglomerate strength thus explains the relation between
 $D_{f}^{100{-}250}$
and
 $F_{L}^{\ast }$
for straining.
For agglomerates that are broken by bending and twisting, the situation is different. This is because the induced torque scales with the hydrodynamic force per primary particle as well as the linear dimensions of the agglomerate (and thus with
 $R_{g}$
). Small agglomerates at large values of
 $T_{L}^{\ast }$
are more easily formed if they have a small
 $D_{f}$
(and thus a large
 $R_{g}$
), whereas large agglomerates at small values of
 $T_{L}^{\ast }$
require a small
 $R_{g}$
(and a large
 $D_{f}$
) to survive against break-up by the induced torque. This is in line with the findings shown in figure 7. However, we have no explanation for why the relation between
 $D_{f}^{100{-}250}$
and
 $F_{L}^{\ast }$
for shearing is more similar to bending and twisting than straining (despite the induced stress being independent of
 $R_{g}$
in that case).
The disparity between
 $D_{f}$
and
 $D_{f}^{100{-}250}$
for a given value of
 $F_{L}^{\ast }$
and
 $T_{L}^{\ast }$
shows that the agglomerate populations formed in our simulations cannot be characterized by a single fractal dimension. Instead, there is a range of fractal dimensions depending on their relative size compared to the whole agglomerate population.
7 Results: relative fragmentation of agglomerates
A common assumption made in break-up models proposed in the literature is that agglomerates break in two branches of equal mass (binary breakage). de Bona et al. (Reference de Bona, Lanotte and Vanni2014) studied break-up of agglomerates smaller than the Kolmogorov scale in isotropic turbulent flows, and found that agglomerate fragments of all sizes are produced, with an approximately linear relation between the size of the fragments formed and the frequency (hardly any single primary particles on the one hand and binary breakage with the highest probability on the other hand).
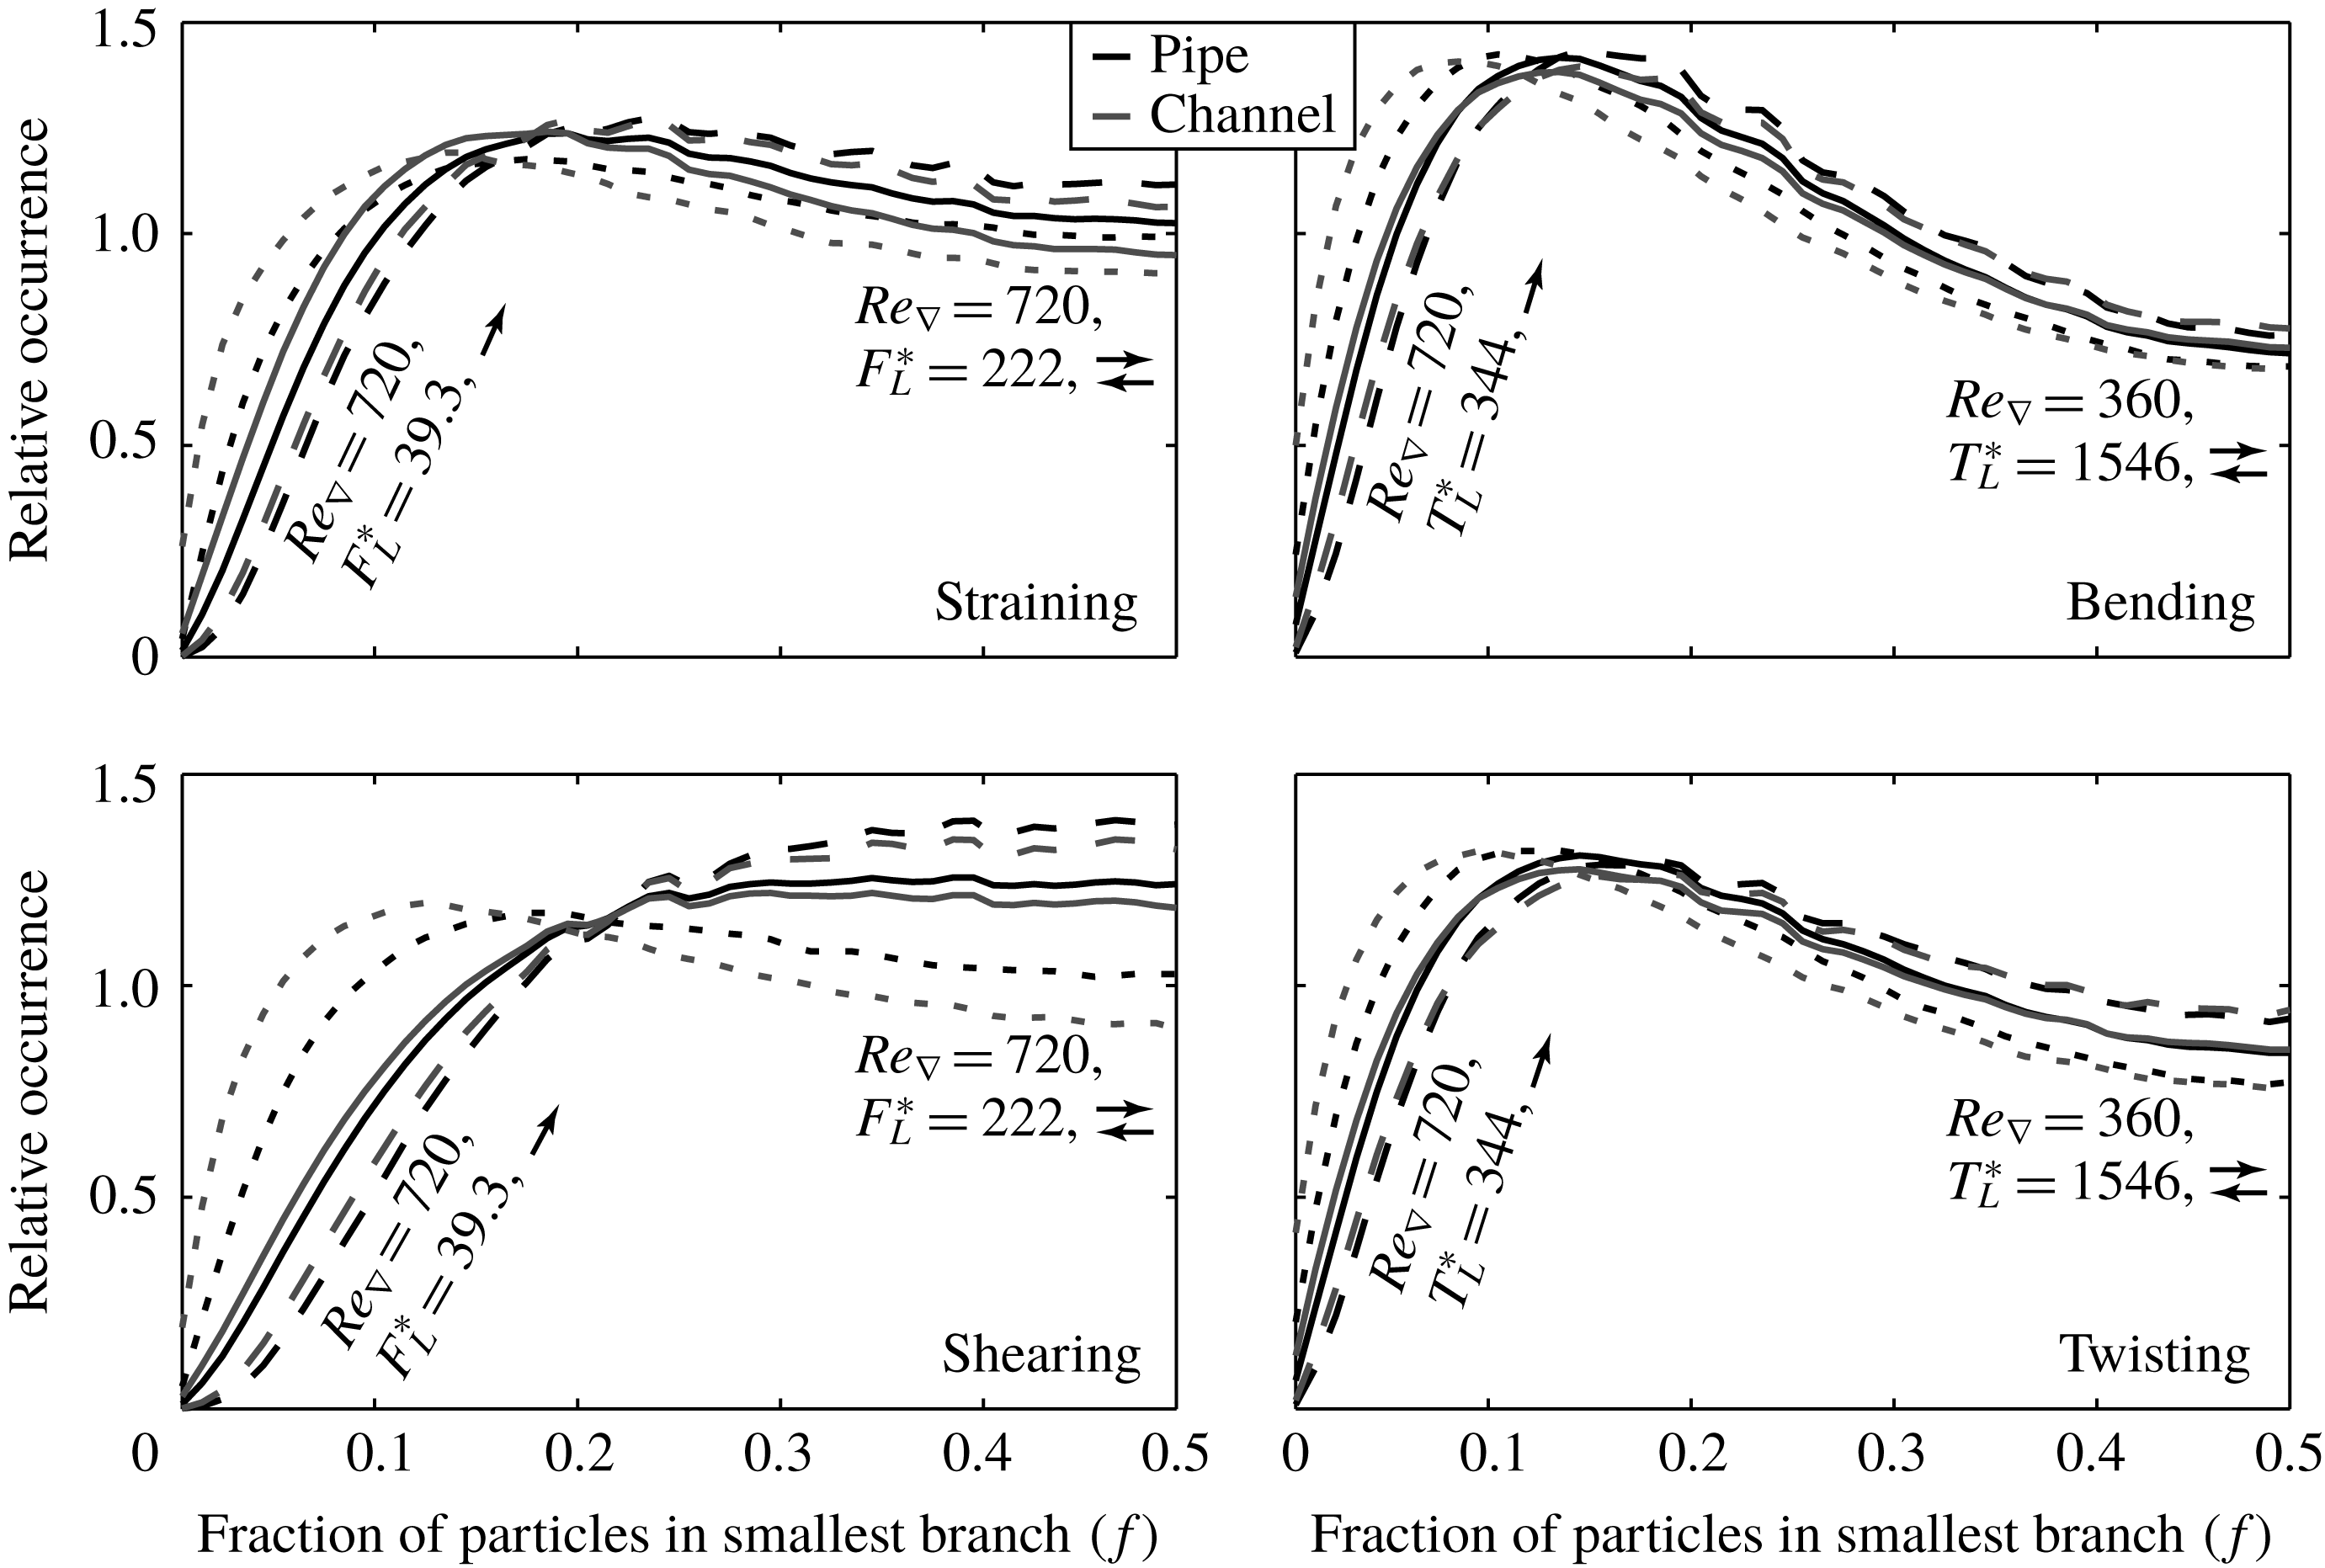
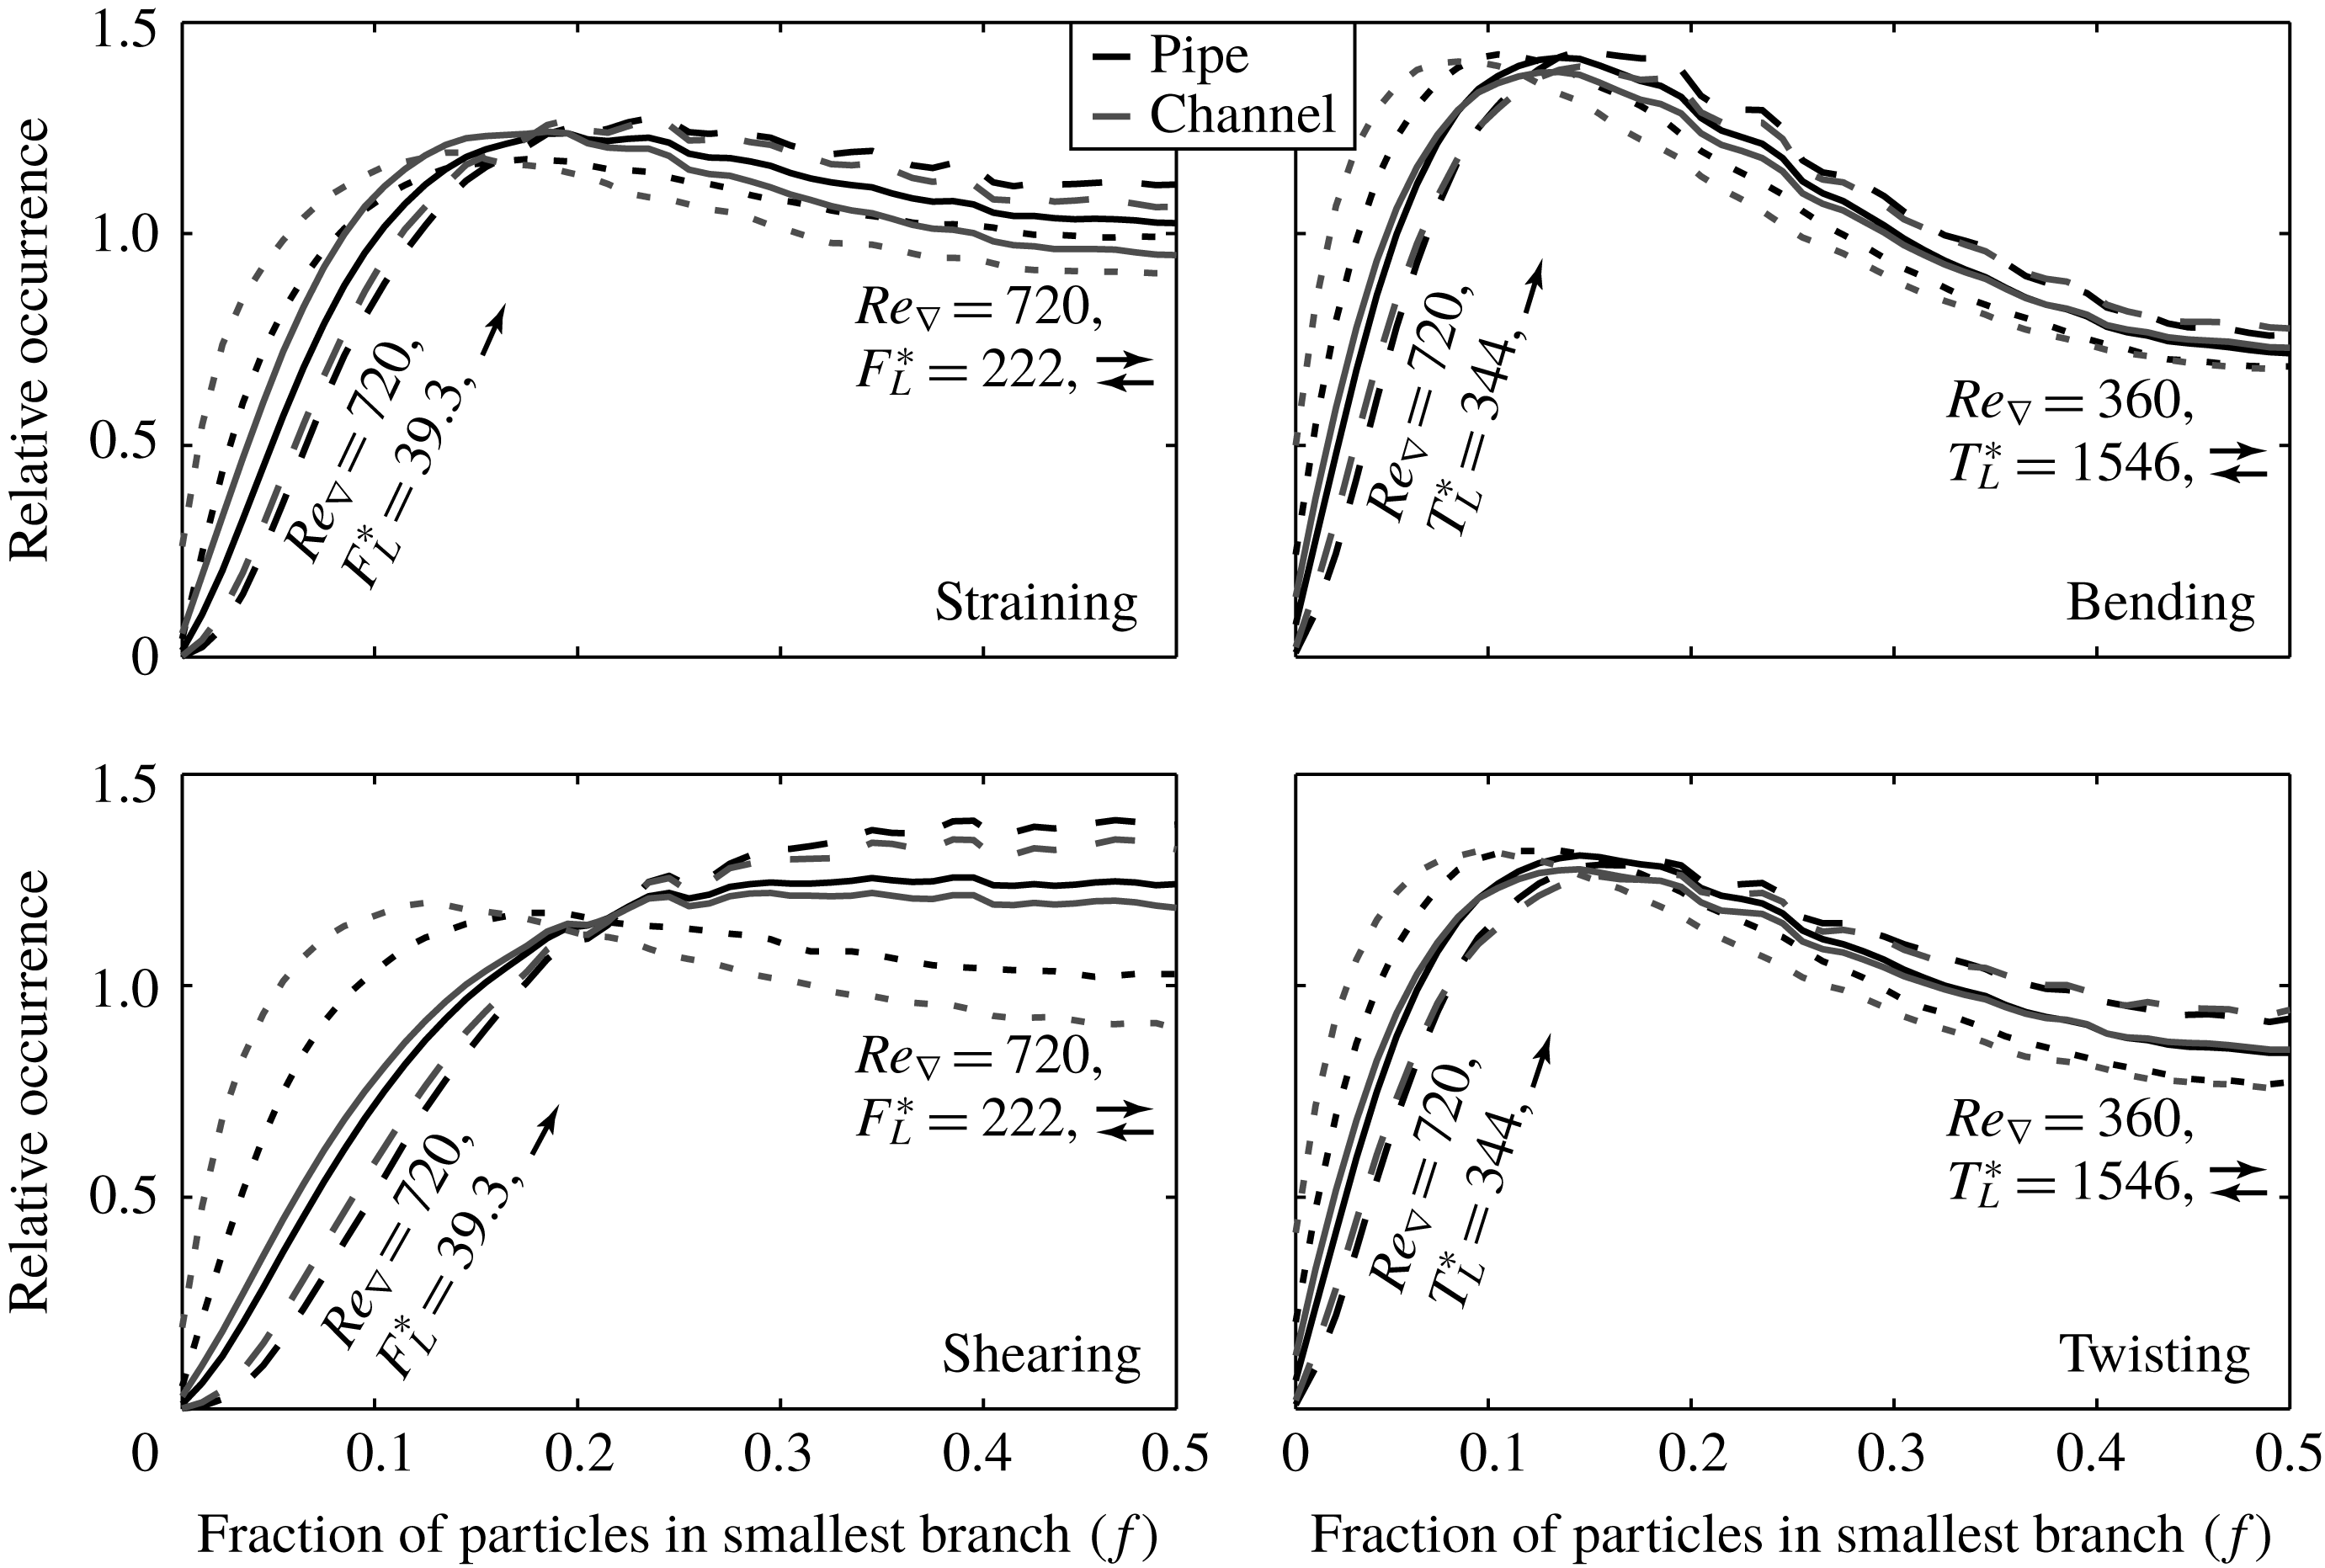
Figure 8 shows a histogram of the fraction of the number of primary particles of the agglomerate that end up in the branch that contains the smallest number of primary particles in our work. The results in figure 8 clearly show that, in our simulations, binary breakage, which would be represented by a
 $\unicode[STIX]{x1D6FF}$
-function at
 $f=0.5$
, is a poor representation of the relative fragmentation of the agglomerates. On average, the distribution is skewed towards forming one branch that contains a minority and one branch that contains the majority of the primary particles of the agglomerate that is being broken. In accordance to these results we find that the most-stressed bonds typically are located in the internal parts of the agglomerate. The same was reported by Gastaldi & Vanni (Reference Gastaldi and Vanni2011).
Histogram of the fraction of the primary particles that end up in the smallest agglomerate branch during a break-up event. Solid lines: averaged results over all cases considered per break-up mechanism, dashed lines: extreme cases as indicated by the labels shown.
Increasing values of
 $F_{L}^{\ast }$
and
 $T_{L}^{\ast }$
are found to produce more asymmetric fragmentation of the agglomerates, as does decreasing the value of the Reynolds number, as well as using two-way coupling instead of one-way coupling. We propose that these effects can be explained by the fact that any of the aforementioned parameters increases the
 $\bar{N}_{bu}$
of the agglomerates. In agglomerates that consist of a large number of primary particles, the number of bonds between primary particles that experience an induced stress that exceeds the strength of the bonds will be larger than in agglomerates that are made up of a smaller number of primary particles. Since, in our break-up model, the actual bond in the agglomerate that is being broken if multiple bonds in an agglomerate are eligible for break-up is selected randomly, the chance that an agglomerate is broken in asymmetric branches can be expected to increase if the number of primary particles inside the agglomerate increases. This is also part of the reason that a different result is found compared to the work of de Bona et al. (Reference de Bona, Lanotte and Vanni2014). In their model, agglomerates were broken at the location where the internal stress is highest. Therefore, the said smoothing of the fragmentation yield found in our model is not present in their work. Furthermore, de Bona et al. studied homogeneous isotropic turbulence instead of wall-bounded flows, thereby also reducing the chance asymmetric agglomerate fragments are formed (e.g. if a relatively small branch of an agglomerate is located in the inner layer of the turbulent flow and the rest of the agglomerate is located in the outer layer).
The fact that break-up by bending and twisting produces more asymmetric break-up fragments than straining and shearing can be understood from the fact that the induced torque in the bonds scales both with the force and the agglomerate radius. A small branch that is located relatively far away from the centre of mass of an agglomerate can more easily induce a large torque in the inter-particle bond that keeps it attached to the agglomerate than it can induce a large force.
8 Conclusions
Dispersed primary particles that undergo agglomeration and break-up have a very different interaction with the turbulent flow compared to non-interacting particles. The interaction between the turbulence and the dispersed phase proceeds by two competing mechanisms that both originate from the fact that the dispersed phase acts as a spatial filter of the fluid velocity field. On the one hand, a reduction of turbulent velocity fluctuations occurs, while on the other hand, a long-range correlation in the fluid velocity field is introduced. Which of these two mechanisms is dominant depends on the size of the agglomerates formed and thereby, a maximum increase in flow rate at intermediate values of the strength of the inter-particle bonds in the dispersed phase is found.
The mass of the agglomerates formed can be predicted quite accurately from the mean value of the slip velocity of the individual primary particles. This slip velocity depends on the coupling mode used, on the flow geometry, as well as on the Reynolds number of the turbulent flow (the latter under two-way coupling only). Little variation as a function of the break-up mode is found, apart from a clear distinction between straining and shearing on the one hand (where masses scale approximately with
 $F_{L}^{\ast }$
to the first order), and bending and twisting on the other hand (where masses scale approximately with
 $T_{L}^{\ast }$
to order two thirds, which is consistent with the fractal dimension of the agglomerates). The fractal dimension of the agglomerates itself is consistent with classical results from the literature, showing that a turbulent flow as the driving force for building the agglomerates does not lead to fundamentally different agglomerate properties. Depending on the mechanism by which agglomerates are broken different relations between the fractal dimension of a fixed-size subset of the agglomerates and the bond strength is found, however, that partly can be explained by the interaction between the agglomerates and the turbulence.
For all break-up mechanisms, the fragmentation yield, measured by the fraction of primary particles that end up in the branches that are formed during break-up events, is asymmetric. Binary breakage, is found to be a poor representation of the actual break-up process, even though it is frequently used as a break-up mechanism in engineering models. Our results show that agglomerates are most likely to break into parts that contain approximately one quarter and three quarters of the primary particles that originally were contained in the agglomerate that is broken.
Acknowledgements
This research was carried out within the context of the ISAPP Knowledge Centre. ISAPP (Integrated Systems Approach to Petroleum Production) is a joint project of the Netherlands Organization for Applied Scientific Research (TNO) and Delft University of Technology, sponsored by Eni, Petrobras and Statoil.
Supplementary material
Supplementary material is available at https://doi.org/10.1017/jfm.2018.716.