
1. Introduction
Granular segregation has been widely studied due to its importance in many areas ranging from geophysics to industrial processes (Ottino & Lueptow Reference Ottino and Lueptow2008; Gray & Kokelaar Reference Gray and Kokelaar2010; Gray & Ancey Reference Gray and Ancey2011; Gray Reference Gray2018; Umbanhowar, Lueptow & Ottino Reference Umbanhowar, Lueptow and Ottino2019). Among the particle properties that drive segregation, size and density are usually the dominant factors (Savage & Lun Reference Savage and Lun1988; Khakhar, McCarthy & Ottino Reference Khakhar, McCarthy and Ottino1997). In dense granular flows of size-disperse particles having the same density (S-systems), large particles tend to rise as small particles fall through voids, a segregation mechanism known as percolation (Williams Reference Williams1968; Drahun & Bridgwater Reference Drahun and Bridgwater1983; Savage & Lun Reference Savage and Lun1988; Ottino & Khakhar Reference Ottino and Khakhar2000). For density-disperse mixtures of equal diameter particles (D-systems), segregation is driven by a buoyant force mechanism in which heavy particles sink and light particles rise (Ristow Reference Ristow1994; Khakhar et al. Reference Khakhar, McCarthy and Ottino1997; Khakhar, McCarthy & Ottino Reference Khakhar, McCarthy and Ottino1999; Pereira et al. Reference Pereira, Sinnott, Cleary, Liffman, Metcalfe and Šutalo2011). Various continuum models have been proposed for segregation in S- or D-system (Gray Reference Gray2018; Umbanhowar et al. Reference Umbanhowar, Lueptow and Ottino2019), but few studies focus on bidisperse mixtures where the constituent species vary in both size and density (i.e. SD-systems) with the notable exceptions of papers by Jenkins & Yoon (Reference Jenkins and Yoon2002), Marks, Rognon & Einav (Reference Marks, Rognon and Einav2012), Tunuguntla, Bokhove & Thornton (Reference Tunuguntla, Bokhove and Thornton2014) and Gray & Ancey (Reference Gray and Ancey2015). Though size and density differences can reinforce each other, e.g. in mixtures of large light (LL) particles and small heavy (SH) particles, a greater challenge is to predict segregation when the two segregation mechanisms oppose each other, e.g. in mixtures of large heavy (LH) particles and small light (SL) particles. The goal here is to model particle segregation in a two-species mixture of particles differing simultaneously in both particle size and density.
Previous studies used experiments and particle-based simulations to determine the crossover condition between percolation and buoyancy for SD-systems. For vibrated granular materials (the Brazil nut problem), segregation occurs as a consequence of periodic dilation and compaction of the particle bed. The tendency of particles to sink or rise in vibrated systems can be characterized by the ratios of large to small particle diameter,  $R_d=d_l/d_s$, and density,
 $R_\rho =\rho _l/\rho _s$ (Hong, Quinn & Luding Reference Hong, Quinn and Luding2001; Jenkins & Yoon Reference Jenkins and Yoon2002; Breu et al. Reference Breu, Ensner, Kruelle and Rehberg2003; Ciamarra et al. Reference Ciamarra, De Vizia, Fierro, Tarzia, Coniglio and Nicodemi2006). These studies show that percolation dominates (i.e. large particles rise) for
 $R_d>R_\rho$. On the other hand, in flowing granular systems segregation is related to the local shear and resulting dilation in the relatively thin gravitationally driven flowing layers that are ubiquitous in industrial settings such as heaps (Fan et al. Reference Fan, Jacob, Freireich and Lueptow2017), chutes (Savage & Lun Reference Savage and Lun1988; Pouliquen Reference Pouliquen1999) and tumblers (Hill et al. Reference Hill, Khakhar, Gilchrist, McCarthy and Ottino1999; Liu, Yang & Yu Reference Liu, Yang and Yu2013), as well as in geophysical flows such as landslides (Johnson et al. Reference Johnson, Kokelaar, Iverson, Logan, LaHusen and Gray2012). For example, free surface flow experiments with an equal-volume mixture of large steel and small glass particles (
 $R_\rho =3$) in a rotating tumbler show that segregation diminishes for
 $R_d>2$ (Jain, Ottino & Lueptow Reference Jain, Ottino and Lueptow2005a,Reference Jain, Ottino and Lueptowb). In addition, several studies employ continuum mixture theory (Atkin & Craine Reference Atkin and Craine1976) to quantitively model SD-segregation. For example, by assuming a species-specific stress proportional to the mean diameter ratio of the species to the bulk, the momentum balance equation indicates that large particles should rise for
 $R_d>R_\rho$ (Marks et al. Reference Marks, Rognon and Einav2012). However, discrete element method (DEM) simulations of equal-volume mixtures flowing down a chute indicate that the species-specific stress is proportional to the mean volume ratio of the species to the bulk, rather than the diameter ratio, leading to the result that large particles should rise for
 $R_d^3>R_\rho$ (Tunuguntla et al. Reference Tunuguntla, Bokhove and Thornton2014). In addition to size and density ratios, the crossover condition for when buoyancy or percolation dominates in rotating tumbler experiments also depends on particle species concentration (Alonso, Satoh & Miyanami Reference Alonso, Satoh and Miyanami1991) such that LH particles sink at low concentrations but float at high concentrations. The observed concentration dependent segregation direction is not predicted in the approaches by Marks et al. (Reference Marks, Rognon and Einav2012) or Tunuguntla et al. (Reference Tunuguntla, Bokhove and Thornton2014), but has been explained in context of the mixture theory by assuming the species-specific stress is a quadratic function of mixture concentration (Gray & Ancey Reference Gray and Ancey2015).
Segregation experiments demonstrate the subtle interactions between particle size and density, and DEM simulations reproduce these results for laboratory-scale geometries (Fan et al. Reference Fan, Schlick, Umbanhowar, Ottino and Lueptow2013, Reference Fan, Schlick, Umbanhowar, Ottino and Lueptow2014; Combarros et al. Reference Combarros, Feise, Zetzener and Kwade2014; Garcia et al. Reference Garcia, Feise, Strege and Kwade2016; Xiao et al. Reference Xiao, Umbanhowar, Ottino and Lueptow2016). However, a first-principles-based predictive theory for combined size and density segregation is lacking. Efforts have been made to extend continuum mixture theory (Atkin & Craine Reference Atkin and Craine1976) beyond segregation in S- and D-systems (Bridgwater, Foo & Stephens Reference Bridgwater, Foo and Stephens1985; Dolgunin & Ukolov Reference Dolgunin and Ukolov1995; Gray & Thornton Reference Gray and Thornton2005; Fan & Hill Reference Fan and Hill2011) to model segregation in SD-systems (Marks et al. Reference Marks, Rognon and Einav2012; Tunuguntla et al. Reference Tunuguntla, Bokhove and Thornton2014; Gray & Ancey Reference Gray and Ancey2015). The fundamental mechanisms on which these models are formulated (i.e. partial stresses, interspecies drag) are not fully understood, and studies show that some assumptions in the theory do not match results obtained from DEM simulations (Weinhart, Luding & Thornton Reference Weinhart, Luding and Thornton2013; Tunuguntla, Weinhart & Thornton Reference Tunuguntla, Weinhart and Thornton2017; Duan et al. Reference Duan, Umbanhowar, Ottino and Lueptow2020). A more fundamental approach is based on interparticle interactions (i.e. kinetic theory of granular flows) (Arnarson & Jenkins Reference Arnarson and Jenkins2004; Larcher & Jenkins Reference Larcher and Jenkins2013, Reference Larcher and Jenkins2015). However, this approach is limited to mixtures that differ little in particle size or mass and it tends to underestimate the segregation rate (Larcher & Jenkins Reference Larcher and Jenkins2015).
As an alternative, we consider a transport equation approach combined with a mixture-specific segregation velocity model that has previously been used to predict either size or density segregation alone (Fan et al. Reference Fan, Schlick, Umbanhowar, Ottino and Lueptow2014; Xiao et al. Reference Xiao, Umbanhowar, Ottino and Lueptow2016). This approach has been successfully applied to various flow geometries as well as multidisperse and polydisperse particle distributions (Umbanhowar et al. Reference Umbanhowar, Lueptow and Ottino2019), but has not yet been applied to SD-systems where the particles species differ in both size and density. In this model, the local segregation velocity of species  $i$ normal to the free surface is defined as
 $w_{seg,i}=w_i-w$, where
 $w$ is the bulk surface-normal velocity,
 $w_i$ is surface-normal velocity of species
 $i$ and concentration-gradient-driven effects are ignored. For bidisperse mixtures of non-cohesive millimetre-sized particles varying in a single property (either size or density), previous studies (Fan et al. Reference Fan, Schlick, Umbanhowar, Ottino and Lueptow2014; Schlick et al. Reference Schlick, Fan, Isner, Umbanhowar, Ottino and Lueptow2015a; Xiao et al. Reference Xiao, Umbanhowar, Ottino and Lueptow2016) show that
 $w_{seg,i}$ (previously referred as
 $w_{p,i}$ where the
 $p$ subscript is a remnant of the initial application to the percolation velocity in size-disperse systems) can be modelled with reasonable fidelity using
 \begin{equation} w_{seg,i}=A d_s\dot\gamma (1-c_i),\end{equation}
where  $d_s$ is the small particle diameter (
 $d_s=d_l$ for D-systems),
 $\dot \gamma$ is the local shear rate,
 $1-c_i$ is the local concentration of the other species comprising the mixture, and the segregation coefficient,
 $A$, is a function of particle size or density ratio for the two species. Equation (1.1) provides an accurate description of the segregation velocity in most situations, but can fall short under certain conditions. First, recent studies indicate that segregation flux,
 $\varPhi _{seg,i}=w_{seg,i}c_i$, has an underlying asymmetry (van der Vaart et al. Reference van der Vaart, Gajjar, Epely-Chauvin, Andreini, Gray and Ancey2015; Jones et al. Reference Jones, Isner, Xiao, Ottino, Umbanhowar and Lueptow2018) that depends on local particle concentration (i.e. small (or heavy) particles among mostly large (or light) particles segregate faster than the other way around), whereas (1.1) predicts a segregation flux dependence on concentration that is symmetric with respect to
 $c_i=0.5$. Second, (1.1) does not consider size and density ratios simultaneously. That is,
 $A$ has been expressed as a function of either the size ratio alone (Schlick et al. Reference Schlick, Fan, Isner, Umbanhowar, Ottino and Lueptow2015a) (or volume ratio for non-spherical particles Jones et al. (Reference Jones, Ottino, Umbanhowar and Lueptow2020)) in S-systems or the density ratio alone (Xiao et al. Reference Xiao, Umbanhowar, Ottino and Lueptow2016) in D-systems, but not both. As granular materials of practical interest can vary in both size and density, a more general segregation velocity model is needed.
To address the observed asymmetry of the segregation velocity at equal concentrations for size segregation in chute flows, Gajjar & Gray (Reference Gajjar and Gray2014) proposed a flux model equivalent to a two-parameter quadratic form for the segregation velocity,
 \begin{equation} w_{seg,i}=A_\kappa(1-c_i)(1-\kappa c_i),\end{equation}
where  $A_\kappa$ is a magnitude coefficient and
 $\kappa$ is an asymmetry coefficient. Jones et al. (Reference Jones, Isner, Xiao, Ottino, Umbanhowar and Lueptow2018) showed that this model characterizes both size- and density-bidisperse mixtures over a wide range of size or density ratios, and expressed (1.2) in a form consistent with the linear segregation velocity model of (1.1) as
 \begin{equation} w_{seg,i}= [A_{i}+B_{i}(1-c_i)]d_s\dot\gamma(1-c_i),\end{equation}
where  $A_i$ and
 $B_i$ can be determined from bidisperse heap flow simulations for a wide range of size or density ratios. Comparison of (1.1) and (1.3) is enlightening. Both forms depend on the product of the small particle diameter, the local shear rate and the concentration of the other species, i.e.
 $d_s\dot \gamma (1-c_i)$. Furthermore, the quadratic model has a two-parameter, concentration dependent term
 $A_{i}+B_{i}(1-c_i)$ instead of the concentration independent coefficient
 $A$ in the linear model.
In order to model combined size and density segregation, it is necessary to find an expression for the segregation velocity in a bidisperse mixture of particles accounting for both particle size and density. To do this, we perform DEM simulations of particle mixtures having a wide range of particle properties, varying in both size and density, in the canonical free surface flow of a quasi-two-dimensional (quasi-2-D) bounded heap flow. The advantage of this flow geometry is that it is simple to implement, is steady in a frame of reference rising with the heap surface, and generates a wide range of segregation velocities, shear rates and concentrations in a single simulation. Because of our previous success with (1.3), we focus on this model for the combined size and density segregation, knowing that this equation accurately reflects the segregation velocity in the limits of pure size-driven or pure density-driven segregation over a range of concentrations.
Discrete element method simulation of quasi-2-D single-sided bounded heap flow for size and density bidisperse mixtures is described in § 2. Based on simulation results, a segregation velocity model analogous to (1.3) is extended to SD-systems in § 3. Using this model, it is possible to predict the combination of size ratio, density ratio and concentration that minimizes segregation, an important result in practical engineering systems to assure that particle mixtures remain mixed. In § 4, the continuum advection–diffusion–segregation transport equation is solved using the combined size and density segregation model to demonstrate that the model predictions match the simulation results for a range of feed rates, feed concentrations and heap geometries. Conclusions are given in § 5.
2. Simulation
We numerically simulate combined size and density segregation of bidisperse mixtures in a single-sided quasi-2-D bounded heap where particles flow in a thin surface layer down a slope much like the flow that occurs when filling a silo. An advantage of heap flows over other flow configurations (e.g. plane shear flows and chute flows) is that the local shear rate and the particle species concentration vary throughout the length and depth of a steady flowing layer but remain constant at a particular location in the flow (when analysed from a reference frame that rises with the heap surface), such that time-averaged segregation data for a wide range of flow conditions can be obtained from just one simulation. Segregation model parameters obtained from the steady single-sided quasi-2-D bounded heap geometry are universal in that they can be applied to unsteady flows and other flow geometries (Schlick et al. Reference Schlick, Fan, Umbanhowar, Ottino and Lueptow2015b; Deng et al. Reference Deng, Umbanhowar, Ottino and Lueptow2019; Xiao et al. Reference Xiao, Fan, Jacob, Umbanhowar, Kodam, Koch and Lueptow2019; Deng et al. Reference Deng, Fan, Theuerkauf, Jacob, Umbanhowar and Lueptow2020; Isner et al. Reference Isner, Umbanhowar, Ottino and Lueptow2020a). In this study, we conduct more than 350 simulations with different combinations of particle size and density ratios in developing the SD-disperse segregation model.
Our in-house DEM code (Isner et al. Reference Isner, Umbanhowar, Ottino and Lueptow2020a,Reference Isner, Umbanhowar, Ottino and Lueptowb) runs on CUDA-enabled GPUs and has been previously validated by heap flow experiments with millimetre-sized particles (Xiao et al. Reference Xiao, Umbanhowar, Ottino and Lueptow2016; Isner et al. Reference Isner, Umbanhowar, Ottino and Lueptow2020b). The bounded heap example shown in figure 1 is confined by two parallel plates in the spanwise (normal to the  $xz$-plane) direction with a gap thickness of
 $T=15$ mm. The heap width between the bounding endwalls is
 $W=0.5$ m. To reduce the number of simulated particles and save computation time, the bottom wall is inclined at an angle
 $\beta =28^\circ$, roughly matching the dynamic repose angle
 $\alpha$ in steady state. To create a rough bottom boundary, particles that contact the bottom wall are immobilized. After the particle bed exceeds 10–15 particle diameters in depth, the velocity and concentration profiles in the flowing layer become steady, indicating that effects of the bottom boundary can be neglected.
Quasi-2-D bounded heap simulation set-up and segregation example. For these conditions, large heavy particles (red,  $d_l=3$ mm,
 $\rho _l=4$ g cm
 $^{-3}$) sink while small, light particles (blue,
 $d_s=1.5$ mm,
 $\rho _s=1$ g cm
 $^{-3}$) rise. Segregation occurs in the flowing layer, which is outlined schematically by the white rectangle (the thickness is exaggerated by a factor of approximately two to make it more visible). Here,
 $R_d=2$,
 $R_\rho =4$,
 $W_f=3.3$ cm,
 $W=50$ cm,
 $L=52$ cm,
 $q=20$ cm
 $^2$ s
 $^{-1}$,
 $\delta =1.5$ cm and large particle feed concentration
 $\hat c_l=0.2$.

For all simulations, particle–particle and particle–wall contacts use a friction coefficient of  $\mu =0.4$, a binary collision time of
 $t_c=0.5$ ms and a restitution coefficient of
 $e=0.2$. Here we choose
 $e=0.2$ to minimize particle bouncing in the DEM simulations, a factor that is not considered in the later analysis. Previous results indicate that the flow kinematics and the particle segregation for free surface flows such as those considered here are largely independent of
 $e$ (Silbert et al. Reference Silbert, Ertaş, Grest, Halsey, Levine and Plimpton2001; Jing, Kwok & Leung Reference Jing, Kwok and Leung2017; Duan et al. Reference Duan, Umbanhowar, Ottino and Lueptow2020; Jing et al. Reference Jing, Ottino, Lueptow and Umbanhowar2020). To fully resolve particle collisions, the DEM simulation time step is
 $t_c/50$ (Silbert et al. Reference Silbert, Ertaş, Grest, Halsey, Levine and Plimpton2001; Duan & Feng Reference Duan and Feng2017, Reference Duan and Feng2019). The particle contact model (Cundall & Strack Reference Cundall and Strack1979; Shäfer, Dippel & Wolf Reference Shäfer, Dippel and Wolf1996; Weinhart et al. Reference Weinhart2020) is detailed in the supplementary material are available at https://doi.org/10.1017/jfm.2021.342.
Flow conditions and particle properties differentiated by subscript  $i$ (
 $i=l$ for large particles and
 $i=s$ for small particles regardless of their densities) are listed in table 1. For a given species, the particle diameter
 $d_i$ is uniformly distributed with a variance of
 $\pm 0.1d_i$ to reduce ordering, except where noted. A well-mixed bidisperse stream of particles with a feed concentration of large particles,
 $\hat c_l$, (and corresponding small particle feed concentration
 $\hat c_s=1-\hat c_l$) is continuously fed into the system from a relatively low height of 4 cm above the rising free surface to reduce bouncing in a
 $3.3$ cm (11
 $d_l$) long feed zone (
 $W_f$). Based on volume conservation, the free surface rises at a vertical rise velocity of
 $v_r=Q/WT$, where
 $Q$ is the volumetric feed rate. The flowing layer length is
 $L=W/\cos (\alpha )$, and an effective 2-D feed rate is defined as
 $q=Q/T$.
Simulation parameters.

In a reference frame rising with the flowing layer, the origin of the coordinate system is located on the free surface at the front wall at the downstream (right) edge of the vertical feed region with  $x$,
 $y$ and
 $z$ oriented in the streamwise, spanwise and normal directions, respectively. To characterize the flow, the velocity field,
 $\pmb u=u \hat x +v \hat y +w \hat z$ (noting that no subscript is used for variables representing the mixture) and species concentration,
 $c_i$, are calculated from spatial and temporal averages of simulation data in the flowing layer. To compute the spatial average, we use a volume-weighted binning method (Fan et al. Reference Fan, Schlick, Umbanhowar, Ottino and Lueptow2013) with right cuboid bins oriented with two faces parallel to the free surface, two faces perpendicular to the free surface and two faces parallel to the sidewalls. Each bin has a streamwise length of
 $1$ cm (3.33
 $d_l$) and a height (normal to the free surface) of
 $1$ mm (0.33
 $d_l$). Since particles can overlap multiple bins, the partial volumes of particles are applied to the appropriate bin for averaging purposes. As such, the species concentration is defined as
 \begin{equation} c_i=\frac{\displaystyle\sum _{k\in i}^{N_i} V_{k} }{\displaystyle\sum _{k=1}^{N} V_k },\end{equation}
where  $N_i$ and
 $N$ are the number of particles of species
 $i$ and the total number of particles in the bin, respectively and
 $V_{k}$ is the volume of particle
 $k$ in the bin. The mean velocity of species
 $i$ is calculated as the sum of volume-weighted velocities,
 \begin{equation} \pmb u_{i}=\frac{\displaystyle\sum_{k\in i}^{N_i} \pmb u_{k} V_{k} }{\displaystyle\sum_{k\in i}^{N_i} V_k},\end{equation}
where  $\pmb u_{k}$ is the vector velocity of particle
 $k$. The bulk flow velocity,
 $\pmb u$, is determined as
 $\pmb u=\sum \pmb u_ic_i$. To perform the temporal average, the concentration and velocity values of each bin are averaged over 5 s at intervals of
 $0.01$ s after flow reaches steady state. Note that an alternative expression for the bulk velocity,
 $\pmb u=\sum \pmb u_i \rho _i c_i/\sum \rho _i c_i$, can be calculated based on the sum of mass-weighted velocities instead of volume-weighted velocities in (2.2). In previous research utilizing the framework of mixture theory (Gray & Ancey Reference Gray and Ancey2015), the segregation velocity was derived from mass and momentum conservation, which requires an evolving bulk density along with mass-weighted mean velocities for density disperse mixtures. Here we assume that volume is approximately conserved, which is equivalent to assuming a nearly constant volume fraction. This allows us to use
 $\pmb u=\sum \pmb u_i c_i$ instead of mass-weighted velocities. And because heap flow kinematics are nearly independent of particle size and density and species concentration as shown in § 4, it is possible to use a volume-based transport equation to model the segregation.
In quasi-2-D bounded heap flow, segregation mainly occurs in the  $z$-direction (normal to the free surface), as noted in previous studies (Fan et al. Reference Fan, Schlick, Umbanhowar, Ottino and Lueptow2014; Schlick et al. Reference Schlick, Fan, Umbanhowar, Ottino and Lueptow2015b; Xiao et al. Reference Xiao, Umbanhowar, Ottino and Lueptow2016; Deng et al. Reference Deng, Umbanhowar, Ottino and Lueptow2018). Furthermore, an advection–diffusion transport equation has been successfully used to model the segregation (Bridgwater et al. Reference Bridgwater, Foo and Stephens1985; Dolgunin & Ukolov Reference Dolgunin and Ukolov1995; Gray Reference Gray2018; Umbanhowar et al. Reference Umbanhowar, Lueptow and Ottino2019). Within this continuum framework, the concentration of species
 $i$ can be expressed as
 \begin{equation} \frac{\partial c_i}{\partial t} + {\boldsymbol{\nabla} \boldsymbol{\cdot} (\pmb u^*_i c_i)}={\boldsymbol{\nabla} \boldsymbol{\cdot} (D\boldsymbol{\nabla} c_i)}.\end{equation}
Here, the local collisional diffusion coefficient  $D$ is a scalar, although in general it is a tensor. This approximation is accurate for flows with a single dominant shear direction (Umbanhowar et al. Reference Umbanhowar, Lueptow and Ottino2019). Here,
 $\pmb u^*_i$ represents the diffusionless mean velocity of species
 $i$, which differs from the overall mean velocity,
 $\pmb u_i$, determined from simulation according to (2.2). Since there is no net motion of species in the spanwise (
 $y$) direction (i.e. zero spanwise velocity
 $v_i=0$), the other velocity components of species
 $i$ are written most generally as
 $u^*_i= u + u_{seg,i}$ and
 $w^*_i=w+w_{seg,i}$, where
 $u_{seg,i}$ and
 $w_{seg,i}$ are the components of the gravity-driven segregation velocity of species
 $i$ relative to the mean flow velocity. However, for the quasi-2-D bounded heap and most other free surface flows,
 $u_{seg,i} \ll u$ so that
 $u^*_i$ can be accurately approximated by
 $u$ (Deng et al. Reference Deng, Umbanhowar, Ottino and Lueptow2018). With these assumptions, (2.3) can be written as
 \begin{equation} \frac{\partial c_i}{\partial t} + \frac{\partial{u c_i}}{\partial x}+\frac{\partial (w+w_{seg,i})c_i}{\partial z}=\frac{\partial}{\partial x} \left( D\frac{\partial c_i}{\partial x} \right)+\frac{\partial}{\partial z} \left( D\frac{\partial c_i}{\partial z} \right),\end{equation}
or, rearranging, as
 \begin{equation} \frac{\partial c_i}{\partial t} + \frac{\partial{u c_i}}{\partial x}+\frac{\partial \left[wc_i+w_{seg,i}c_i-D\dfrac{\partial c_i}{\partial z} \right]}{\partial z}=\frac{\partial}{\partial x} \left( D\frac{\partial c_i}{\partial x} \right). \end{equation}
When the normal component of flux for species  $i$ is measured from DEM simulation, it is the entire quantity within the brackets of (2.5) that is measured. In other words, the measured normal flux
 $\varPhi _{i}=w_{i}c_i$ is driven by three distinct mechanisms: advection (
 $\varPhi _{adv,i}=wc_i$), segregation (
 $\varPhi _{seg,i}=w_{seg,i}c_i$) and diffusion (
 $\varPhi _{D,i}=-D\partial c_i/\partial z$), and can be written as
 \begin{equation} w_{i}c_i=wc_i+w_{seg,i}c_i-{D}\frac{\partial c_i}{\partial z}.\end{equation}
Previous studies indicate that  $\varPhi _{D,i}$ is typically small compared with the segregation flux,
 $\varPhi _{seg,i}$ (i.e.
 $\varPhi _{D,i}<0.1\varPhi _{seg,i}$) for size (or density) only segregation (Jones et al. Reference Jones, Isner, Xiao, Ottino, Umbanhowar and Lueptow2018). As such, the segregation velocity is expressed simply as
 $w_{seg,i}\approx w_{i}-w$ (Fan et al. Reference Fan, Schlick, Umbanhowar, Ottino and Lueptow2014; Schlick et al. Reference Schlick, Fan, Isner, Umbanhowar, Ottino and Lueptow2015a; Jones et al. Reference Jones, Isner, Xiao, Ottino, Umbanhowar and Lueptow2018). However, for the combined size and density segregation considered here, the opposing effects of size and density differences can result in very weak segregation. As a result, the concurrent concentration gradient driven diffusion flux,
 $\varPhi _{D,i}$, can be similar in magnitude to the segregation flux,
 $\varPhi _{seg,i}$. Thus, it is necessary to include all three terms when calculating the segregation velocity. Using (2.1) and (2.2),
 $w_i$,
 $w$ and
 $c_i$ can be readily calculated from simulations, so the segregation velocity can be determined as
 \begin{equation} w_{seg,i}=w_{i}-w+\frac{1}{c_i} D\frac{\partial c_i}{\partial z}.\end{equation}
Like all the other variables on the right-hand side of (2.7), the diffusion coefficient  $D$ is determined directly from simulation as the mean-square displacement (
 $MSD$) in the normal direction of every particle in a bin over a period
 ${\rm \Delta} t$ (Utter & Behringer Reference Utter and Behringer2004; Wandersman, Dijksman & Van Hecke Reference Wandersman, Dijksman and Van Hecke2012; Fan et al. Reference Fan, Umbanhowar, Ottino and Lueptow2015),
 \begin{equation} MSD_z({\rm \Delta} t)=\frac{1}{N}\sum_{k=1}^{N}[z_k(t+{\rm \Delta} t)-z_k(t)-L({\rm \Delta} t)]^2. \end{equation}
Here,  $z_k(t+{\rm \Delta} t)-z_k(t)$ is the displacement of particle
 $k$ in the bin in a time interval
 ${\rm \Delta} t$, and
 $L({\rm \Delta} t)$ is the mean cumulative displacement of particles in the bin due to the bulk flow in the
 $z$-direction. The
 $MSD_z$ values of each bin for
 ${\rm \Delta} t$ are averaged over 200 distinct times
 $t$ at intervals of 0.25 s, consistent with the 5 s sampling window for calculating the concentration and velocity fields. Similar to previous results (Fan et al. Reference Fan, Umbanhowar, Ottino and Lueptow2015),
 $MSD_z$ data are linear in
 ${\rm \Delta} t$ for
 $0.05\ \text {s}<{\rm \Delta} t<0.3$ s, indicating diffusive behaviour. The diffusion coefficient
 $D$ is then estimated as one half the slope of a linear fit of
 $MSD_z$ versus
 ${\rm \Delta} t$ (Utter & Behringer Reference Utter and Behringer2004; Fan et al. Reference Fan, Umbanhowar, Ottino and Lueptow2015). Further details are provided in the supplementary material.
3. Segregation velocity
To illustrate the interplay between size and density, consider a bidisperse mixture of particles with  $R_d=2$ and
 $R_\rho =4$. Since in this case the large particles are also heavier particles, size and density segregation oppose one another. It is also a case in which the rising and sinking behaviour of each species has been shown to depend on the relative concentration of the two species based on experiments in a rotating tumbler (Alonso et al. Reference Alonso, Satoh and Miyanami1991). In their experiments, LH particles segregate to the core of the tumbler bed at low global (mixture) concentrations and segregate to the periphery of the bed at high concentrations.
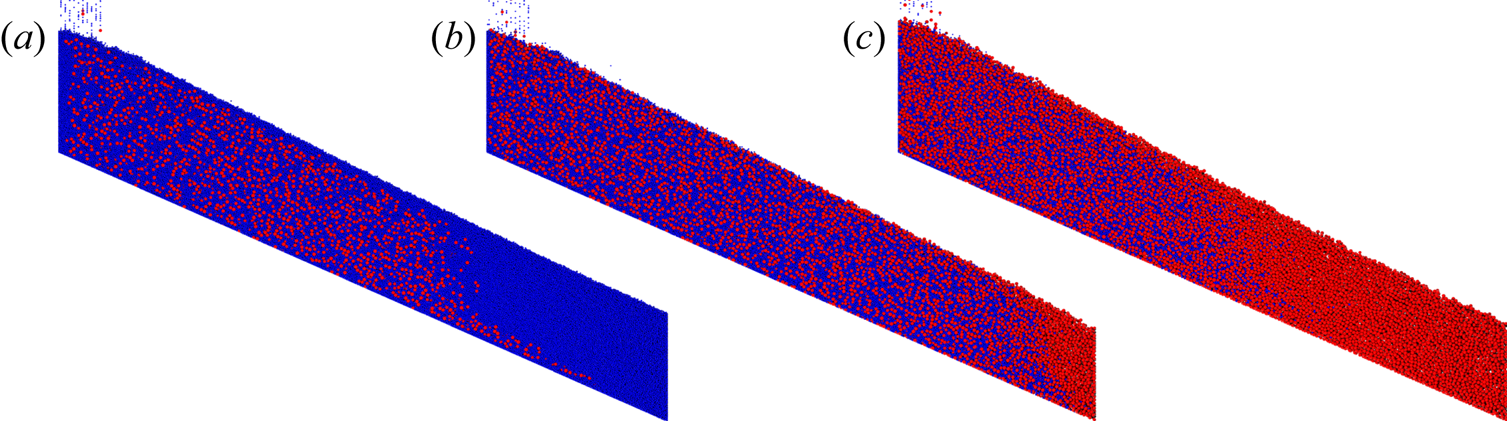
Figure 2 shows the analogous situation in DEM simulations of the same bidisperse particle mixture in bounded heap flow. Varying the feed concentration of large particles  $\hat c_l$ significantly alters the composition of the mixture deposited on the heap just as it does for the rotating tumbler experiments. Specifically, LH particles deposit in the upstream portion of the heap for low feed concentrations (analogous to segregating to the core of the tumbler) and deposit in the downstream portion of the heap at high feed concentrations (analogous to segregating to the tumbler periphery). As is shown below in more detail, this reversal in behaviour occurs because the local segregation flux of the two species depends on their local concentrations. This dependence of the segregation flux on concentration is different from that in either S- or D-systems. In S-systems, the greatest segregation flux occurs for large particle concentrations of approximately 0.6 for this diameter ratio (
 $R_d=2$). Likewise, for D-systems, the greatest segregation flux occurs for heavy particle concentrations of approximately 0.4 for this density ratio (
 $R_\rho =4$) (Jones et al. Reference Jones, Isner, Xiao, Ottino, Umbanhowar and Lueptow2018). For the cases shown in figure 2 the direction of the segregation flux depends on concentration. The LH particles segregate downward at low concentrations and segregate upward at high concentrations. Hence, in figure 2(a) the low concentration LH particles segregate downward and deposit along with fewer SL particles on the upstream portion of heap until LH particles are depleted, leaving only SL particles. In figure 2(c), the high concentration LH particles segregate upward so that the SL particles deposit along with fewer LH particles on the upstream portion of the heap until the SL particles are depleted. Figure 2(b) shows an intermediate case where percolation is only slightly stronger than buoyancy.
Heap flow segregation for large particle feed concentration  $\hat c_l$ of (a) 0.2, (b) 0.5 and (c) 0.8. Large heavy particles (red,
 $d_l=3$ mm,
 $\rho _l=4$ g cm
 $^{-3}$) sink while small light particles (blue,
 $d_s=1.5$ mm,
 $\rho _s=1$ g cm
 $^{-3}$) rise for
 $\hat c_l=$0.2, as buoyancy overcomes percolation. In contrast, for
 $\hat c_l=$0.5 and 0.8 segregation reverses as percolation dominates over buoyancy. Here,
 $R_d=2$,
 $R_\rho =4$,
 $W=50$ cm,
 $q=20$ cm
 $^2$ s
 $^{-1}$.

To quantify the segregation for the cases shown in figure 2, it is necessary to use (2.7) to find the segregation velocity, which requires knowledge of  $c_i$,
 $w_i$,
 $w$ and
 $D$ found as functions of position using (2.1), (2.2) and (2.8). Segregation occurs in the surface layer having length
 $L=W/\cos (\alpha )$ and local thickness
 $\delta (x)$, which is defined here as the depth at which the streamwise velocity is 1/10th its surface value, i.e.
 $u(x,-\delta )=0.1u(x,0)$. The location of the flow surface at each streamwise position is estimated based on a cutoff value of solids fraction
 $\phi _c=0.35$ (Fan et al. Reference Fan, Schlick, Umbanhowar, Ottino and Lueptow2013) to exclude bouncing particles near the free surface.
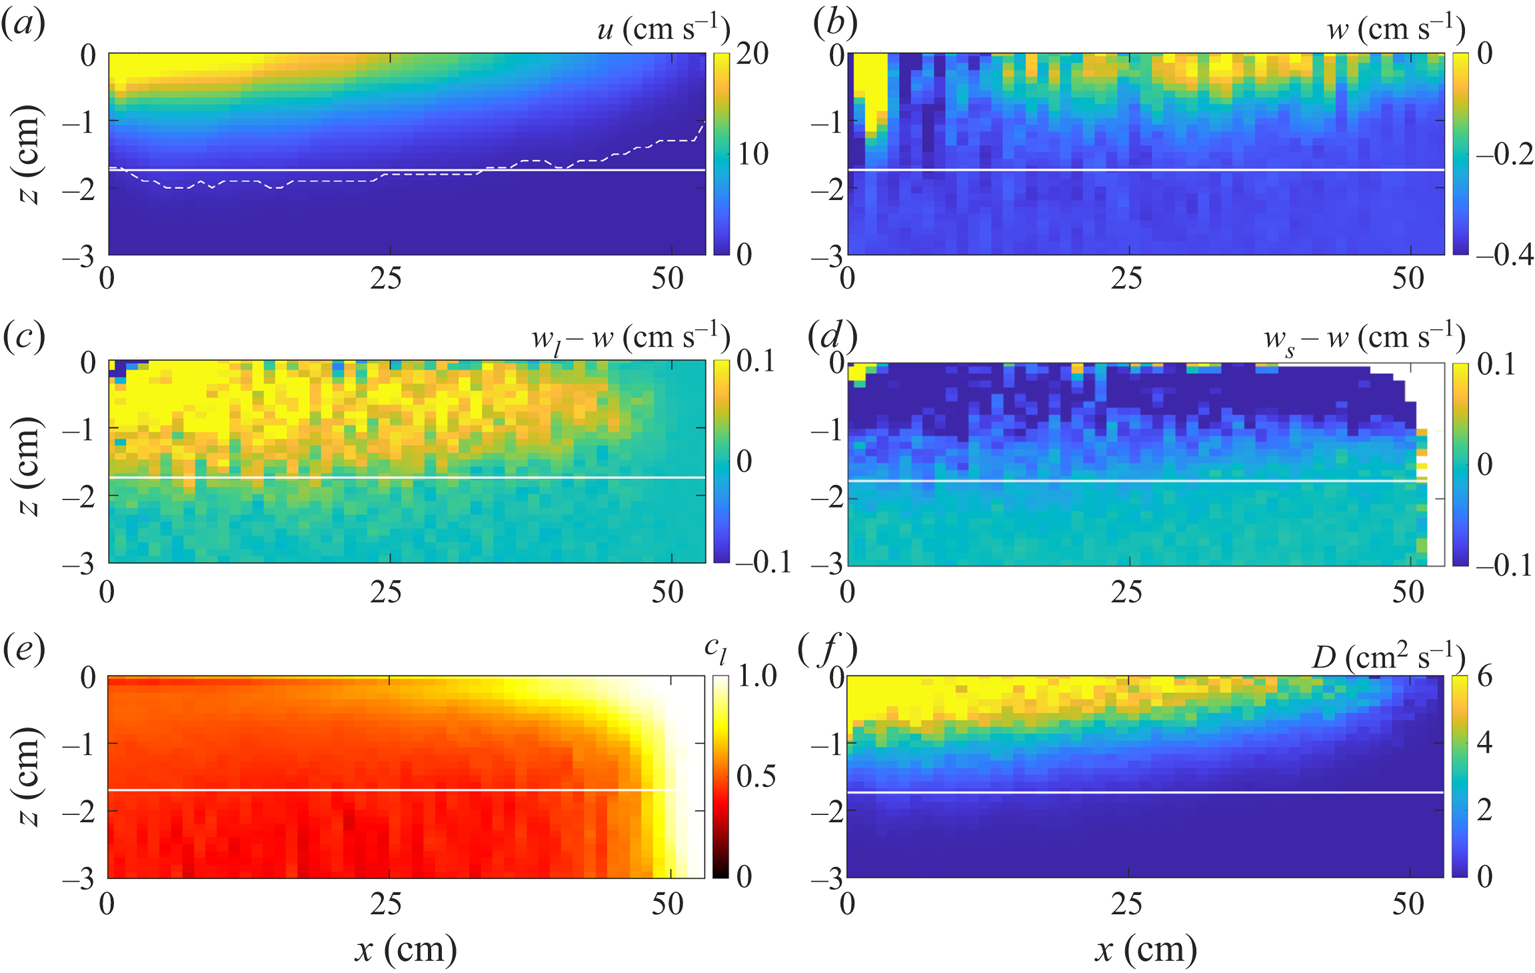
The streamwise velocity, surface-normal velocity, species-specific velocity relative to the bulk, large particle concentration and collisional diffusion coefficient, which are needed to calculate and model the segregation, are shown in figure 3. The rectangular region above the white line corresponds to the flowing layer shown schematically in figure 1. Figure 3(a) shows the local streamwise velocity, which is greatest at the surface and decreases moving downstream and deeper in the flow. The local flowing layer depth,  $\delta (x)$, shown by the dashed curve, remains almost constant for most of the length of flowing layer, except near the downstream bounding endwall where it decreases slightly. Although a varying flowing layer thickness can be implemented in the continuum segregation model (Isner et al. Reference Isner, Umbanhowar, Ottino and Lueptow2020a), a constant flowing layer depth
 $\delta =\langle \delta (x)\rangle$ is assumed later in this paper, as the spatial average is easier to implement and provides sufficient accuracy to successfully apply the theory for the quasi-2-D heap flows considered here (Fan et al. Reference Fan, Schlick, Umbanhowar, Ottino and Lueptow2014; Xiao et al. Reference Xiao, Umbanhowar, Ottino and Lueptow2016). Figure 3(b) shows that the normal velocity at the bottom of the flowing layer in the rising reference frame is opposite and approximately equal to the rise velocity of the surface of the heap,
 $v_r\cos (\alpha )=0.35$ cm s
 $^{-1}$, except for the upstream portion near the feed zone, where the kinematics are affected by falling particles from the vertical feed. Figure 3(c) shows that large particles rise to the surface as their normal relative velocity is positive over most of the flowing layer. The normal relative velocity of the large particles is zero for the downstream portion of the flowing layer corresponding to the region devoid of small particles and hence no relative velocity between the large particles and the bulk flow. On the other hand, the relative velocity is negative for small particles shown in figure 3(d) except very near the downstream endwall where no small particles are present. In other words, in the limit of
 $c_i=0$, the definition of segregation velocity loses its physical meaning. To account for this deficiency in the mathematical description, only data for
 $0.01< c_i<0.99$ are considered in the later analysis. The concentration of large particles, shown in figure 3(e), is close to 1 at the surface of the flowing layer and downstream where the entire flowing layer thickness is made up of large particles. As shown in figure 3(f), the diffusion coefficient is largest near the surface in the upstream portion of the flowing layer and decreases moving downstream and deeper into the flowing layer.
Spatial distributions of various quantities for an example simulation with  $R_d=2$,
 $R_\rho =4$,
 $\hat c_l=0.5$ (i.e. data from figure 2b rotated by repose angle
 $\alpha$). Average fields of (a) streamwise velocity, (b) normal velocity (note that particles deposited on the bed have a velocity of
 $-v_r\cos {\alpha }=-0.35$ cm s
 $^{-1}$ due to the rising reference frame), relative normal velocities of (c) large and (d) small particles, (e) large particle concentration and (f) diffusion coefficient. Dashed curve in panel (a) represents
 $\delta (x)$ using the criterion
 $u(x,-\delta )=0.1u(x,0)$. Region above solid white line in panels (a–f) corresponds to the constant depth flowing layer defined by the average flowing layer depth
 $\delta =\langle \delta (x)\rangle$.

The local values of the velocities, concentrations and diffusion coefficients shown in figure 3 are used to determine the local segregation velocity using (2.7) for different values of the feed concentration of large particles,  $\hat c_l$. An example of the resulting dimensionless segregation velocity data scaled by
 $d_s$ and shear rate,
 $\dot \gamma$, plotted against the concentration of the other species is shown in figure 4 for
 $R_d=2$ and
 $R_\rho =4$. Different colours in figure 4(a) represent simulations with different values for
 $\hat c_l$, which ensures a full range of local concentrations (
 $0.01< c_i<0.99$) in the plot. Because the data come from different depths and positions along the flowing layer of the bounded heap, a wide range of shear rates, concentrations and segregation velocities are represented in the figure. Although there is substantial scatter in the data due to the stochastic nature of granular flows, it is clear that there are two distinct curves represented in figure 4(a), an upper one for the LH particles and a lower one for the SL particles. It is also clear that
 $w_{seg,l}$ (upper set of data) changes from positive (upward segregation) to negative (downward segregation), depending on concentration. For
 $1-c_l<0.6$ (circles at the top left of figure 4a)
 $w_{seg,l}$ is positive, indicating that LH particles tend to rise in the flowing layer for small values of
 $1-c_l=c_s$; for
 $1-c_l>0.6$ (circles at the top right of figure 4a)
 $w_{seg,l}$ is negative, indicating that LH particles sink deeper in the flowing layer. Results are analogous for SL particles, i.e. for small values of
 $1-c_s=c_l$ (
 $1-c_s<0.4$) SL particles rise, albeit at a smaller segregation velocity than LH particles, while for larger values of
 $1-c_s$, SL particles sink. The overlap between the data shown in figure 4(a) for separate simulations with seven different feed concentrations indicates the robustness of the results.
Segregation velocity dependence of large heavy ( $\circ$) and small light (
 $\times$) particles on local concentration of the other species,
 $1-c_i$, for
 $R_d=2$ and
 $R_\rho =4$. (a) Local segregation velocity for different feed concentrations
 $\hat c_l$ (symbol colours) calculated in each bin throughout the entire flowing layer averaged over 500 frames corresponding to 5 s of simulated time. (b) Data from panel (a) averaged over 0.02 increments of
 $1-c_i$ to reduce scatter and more clearly show the data trend. Error bars represent the standard deviation for each increment of
 $1-c_i$. Solid curves are fits to (1.3).

To more clearly show trends, figure 4(b) averages the data in figure 4(a) over 0.02 increments of  $1-c_i$. Here the small positive segregation velocity for both species at small values of
 $1-c_i$ and the negative segregation velocity for both species at large values of
 $1-c_i$ is evident. The segregation velocity of both species is zero at
 $1-c_i=0$, which corresponds to the limit of no particles of the other species being present (monodisperse flow with no segregation possible). However, the segregation velocity as
 $1-c_i$ approaches 1 is finite, as would be expected since this corresponds to a very low concentration of species
 $i$ amongst many particles of the other species (a single intruder particle in the limit). However, this low concentration leads to large variability in the measurement of
 $w_{seg,i}$ and correspondingly large error bars.
Returning to the expressions for the segregation velocity discussed in § 1, it is clear that the linear relation of (1.1) is inappropriate for the data in figure 4, even though it works well under many other circumstances, particularly for mixtures of particles having similar concentrations (Schlick et al. Reference Schlick, Fan, Isner, Umbanhowar, Ottino and Lueptow2015a; Xiao et al. Reference Xiao, Umbanhowar, Ottino and Lueptow2016). However, since previous studies have shown that the segregation velocity can be more accurately modelled using a quadratic polynomial, (1.3) (Gajjar & Gray Reference Gajjar and Gray2014; van der Vaart et al. Reference van der Vaart, Gajjar, Epely-Chauvin, Andreini, Gray and Ancey2015; Jones et al. Reference Jones, Isner, Xiao, Ottino, Umbanhowar and Lueptow2018), particularly for values of  $1-c_i$ near 0 or 1, we consider that form here. Figure 4(b) shows that fits to (1.3) match well with the segregation velocity data. In particular, the fitted curves intersect the dashed horizontal line corresponding to
 $w_{seg,i}=0$ at
 $c_l\approx 0.35$ and
 $c_s\approx 0.65$. At these concentrations, which sum to 1 as they should, particles no longer segregate, apparently due to the balance between percolation and buoyancy.
The measurement uncertainty for the segregation velocity increases with  $1-c_i$ resulting in a mismatch between the data and the curve for large
 $1-c_i$ shown in figure 4. To reduce uncertainty, particularly near the single particle intruder limit, the segregation velocity data in figure 4 can be recast as the species segregation flux
 $\varPhi _{seg,i}=w_{seg,i}c_i$. As is evident for both the entire data set in figure 5(a) and the averaged data in figure 5(b), the two measured species segregation fluxes are always equal and opposite at any particular local value of the large particle concentration,
 $c_l$, as expected. It is also evident that the segregation flux direction reverses at
 $c_l=0.35$ where the segregation velocity in figure 4 is zero. The data in figure 5 are well-fitted by the quadratic-in-concentration segregation velocity given in (1.3), which corresponds to a cubic in
 $c_i$ segregation flux,
 \begin{equation} \varPhi_{seg,i}=d_s\dot\gamma c_i [A_{i}+B_{i}(1-c_i)](1-c_i),\end{equation}
where  $A_i$ and
 $B_i$ are coefficients that we will show depend on both the size and density ratios. Equation (3.1) automatically satisfies the requirement that the flux is 0 at
 $c_l=0$ and 1.
Segregation flux dependence of large heavy ( $\circ$) and small light (
 $\times$) particles on local concentration of large heavy particles,
 $c_l$, for
 $R_d=2$ and
 $R_\rho =4$. (a) Local segregation flux for different feed concentrations
 $\hat c_l$ (symbol colours) calculated in each bin throughout the entire flowing layer and averaged over 500 frames corresponding to 5 s of simulation time. (b) Data from panel (a) averaged over 0.02 increments of
 $c_l$. Error bars represent the standard deviation for each averaging interval of
 $c_l$. Red dashed curves are quadratic fits of (3.1) using only the data for large heavy particles (
 $\circ$) in the plot, while black solid curves (which appear dashed because they are behind the red dashed curves) are fits to the data for small light particles (
 $\times$) in the plot.

Although (3.1) can be made to fit the data in figure 5 quite well, it is a phenomenological model that lacks a physical basis. An alternative approach for considering the segregation is to solve the momentum equation supplied with species-specific stresses and an interspecies drag (Gray & Thornton Reference Gray and Thornton2005) such that the reversed segregation flux can be justified from the standpoint of force balance. However, both approaches require empirical fits, either of the coefficients  $A_i$ and
 $B_i$ in the segregation flux model (3.1) or through the force models related to species-specific stresses (Tunuguntla et al. Reference Tunuguntla, Weinhart and Thornton2017) or drag (Duan et al. Reference Duan, Umbanhowar, Ottino and Lueptow2020) in momentum-based models. In fact, Gray & Ancey (Reference Gray and Ancey2015) assume a simple stress partitioning function and a linear interspecies drag and mathematically prove that the segregation can reverse direction for different values of concentration in SD-systems. This is different from the other momentum-based models (Marks et al. Reference Marks, Rognon and Einav2012; Tunuguntla et al. Reference Tunuguntla, Bokhove and Thornton2014), in which the segregation direction is determined purely by size and density ratios. Hence, neither of these two models account for dependence of the segregation direction on concentration that is inherent in the data in figure 5 and later figures in this paper. An extended discussion of why these models cannot account for concentration dependence is included in Appendix A. On the other hand, though an explicit expression for the segregation flux as a function of size and density ratios is not given, the model of Gray & Ancey (Reference Gray and Ancey2015) utilizes a segregation flux that is quadratic in concentration. Although there is qualitative similarity between the quadratic segregation model in (3.1) and the segregation model by Gray & Ancey (Reference Gray and Ancey2015) in certain parameter regions, their model does not quantitively capture the observed concentration dependent segregation, as described in detail in Appendix A. In addition, their model does not account for the asymmetric concentration dependence of size segregation (Gajjar & Gray Reference Gajjar and Gray2014; van der Vaart et al. Reference van der Vaart, Gajjar, Epely-Chauvin, Andreini, Gray and Ancey2015; Jones et al. Reference Jones, Isner, Xiao, Ottino, Umbanhowar and Lueptow2018).
Of the four empirical coefficients of the model described by (3.1) (equivalently (1.3)),  $A_l$,
 $B_l$ and
 $A_s$,
 $B_s$ (two for each species), only two are independent due to the constraint of volume conservation at all local concentrations, i.e.
 $\varPhi _{seg,l}+\varPhi _{seg,s}=0$. For example, if
 $A_l$ and
 $B_l$ are determined for the large species, then the coefficients for the small species are
 $A_s = -(A_l + B_l)$ and
 $B_s=B_l$. Consequently, although there are two sets of data in figure 5(b), either curve fit can be used to determine the values of
 $A_i$ and
 $B_i$ for the other curve fit. For example, the segregation flux data for large particles in figure 5(b) (red circles) are used to find
 $A_l$ and
 $B_l$ first, and then
 $A_s$ and
 $B_s$ are calculated based on volume conservation. As shown in figure 5(b), the dashed red curves, which are based on the large particle data, also agree well with the small particle data. Fitting (3.1) to small particle flux instead of large particle flux results in nearly identical fits as is evident in figure 5(b) where the solid black curves (appearing as dashed because they are plotted behind the overlying red dashed curves) are fits to the small particle flux. That the segregation velocities for large and small particles are calculated independently in each bin in the DEM simulation, and that the curves for the segregation fluxes match not only the data but also each other, whether calculated from small or large particle data, demonstrates the robust nature of the approach for modelling the segregation ((1.3) and (3.1)) and calculating
 $w_{seg,i}$,
 $c_i$,
 $\dot \gamma$ and
 $D$ as described in § 2.
Having shown that the segregation direction is concentration dependent for a specific pair of size and density ratios ( $R_d=2$,
 $R_\rho =4$), we now illustrate how the segregation flux varies with concentration for different size and density ratios. Figure 6 shows four different cases for four distinct (
 $R_d$,
 $R_\rho$) pairs. The
 $R_d=1$ and
 $R_\rho =4$ case in figure 6(a) reduces to density only segregation, for which light particles rise and heavy particles sink. Figure 6(a) also indicates that the heavy particle concentration is always less than 1 (no data for
 $c_l>0.94$ in figure 6(a); here, subscript
 $l$ refers to heavy particles in D-systems) while the light particle concentration (
 $1-c_l$) reaches 1, consistent with previous studies on plane shear flows for D-systems (Fry et al. Reference Fry, Umbanhowar, Ottino and Lueptow2019). This is likely caused by asymmetric concentration dependence of density segregation in which a single heavy particle (
 $c_l\approx 0$) can move through surrounding light particles but light particles get stuck among heavy particles at low concentration (
 $c_l\approx 1$). Figure 6(b) shows an enhanced segregation case for
 $R_d=2$ and
 $R_\rho =1/2$, in which the particles quickly segregate and remain fully segregated for most of the flowing layer. The measurement uncertainties in figure 6(b) are larger than those of the other three cases, especially for
 $0.3< c_l<0.7$, because the strong segregation reduces the number of data points in this concentration range.
Segregation flux data for large ( $\circ$) and small particles (
 $\times$) averaged over 0.02 increments of
 $c_l$ (subscript
 $l$ refers to heavy particles for D-system in panel (a)) for different size and density ratios. Solid curves are fits of (3.1) to the data for large particles (
 $\circ$). Error bars represent the standard deviation for each averaging interval of
 $c_l$.

Unlike the two ‘unidirectional’ segregation cases in figure 6(a,b) in which percolation and buoyancy act in the same direction, percolation and buoyancy compete with each other for  $R_d=1.5$ and
 $R_\rho =4$ in figure 6(c) and
 $R_d=2$ and
 $R_\rho =2$ in figure 6(d). In these cases, the segregation direction is concentration dependent. For
 $R_d=1.5$ and
 $R_\rho =4$ the overall segregation flux is small due to the near balance between the two segregation mechanisms. For
 $R_d=2$ and
 $R_\rho =2$ the concentration of LH particles at which segregation flux reverses is approximately 0.2, and the two segregation mechanisms are nearly balanced for
 $c_l\le 0.2$, so particles remain mixed. As a result, simulation data are only available for
 $c_l\ge 0.2$ in figure 6(d).
Similar to figure 5(b), fits to (3.1) accurately capture the segregation flux data for all four cases in figure 6. The applicability of the segregation model for various size and density ratios is demonstrated by the close agreement between the model predictions and the segregation flux data for not only opposing segregation mechanisms in figure 6(c,d) but also unidirectional segregation mechanisms in figure 6(b) or density only segregation in figure 6(a).
To illustrate how density ratio alone affects segregation in SD-systems, fits of (3.1) to the simulation data for  $R_d=2$ with
 $R_\rho$ varying from 1/4 to 4 are plotted in figure 7(a) (the simulation data and error bars are omitted for clarity). The segregation flux for the two species is always symmetric about
 $\varPhi _{seg,i}=0$ due to volume conservation, and it increases for both species with decreasing
 $R_\rho$ at all concentrations as would be expected as the large particles become lighter. For
 $R_\rho <1$ the segregation is unidirectional regardless of concentration because the particle size and density segregation mechanisms are in the same direction. On the other hand, reversed segregation is possible when the two segregation mechanisms oppose each other for
 $R_\rho >1$, and in such cases the concentration at which the segregation flux reverses increases with
 $R_\rho$. In addition, the segregation flux is nearly independent of density ratio as
 $c_l$ approaches 1 for
 $R_\rho \ge 1$, indicating that buoyancy has little influence on segregation flux near the single SL intruder particle limit.
Segregation flux versus large particle concentration,  $c_l$, from fits of (3.1) to segregation flux data from simulations with (a)
 $R_d=2$ and various
 $R_\rho$ and (b)
 $R_\rho =4$ and various
 $R_d$. Red–teal colour pairs represent simulations with different combinations of
 $R_d$ and
 $R_\rho$. Simulation data and error bars as plotted in figures 5 and 6 are omitted for clarity.

Figure 7(b) plots similar results for constant density ratio  $R_\rho =4$ and different values of the size ratio
 $R_d$, where the situation is more complicated. For similar size particles (
 $R_d$ near 1), the flux decreases as
 $R_d$ increases until the flux reverses between
 $R_d=1.1$ and
 $R_d=1.3$. Increasing
 $R_d$ further increases the magnitude of the flux so that by
 $R_d=2$ the upward flux of the LH particles is substantially larger than the downward flux of heavy particles of the same size (
 $R_d=1$). The curves overlap for
 $c_l<0.1$, indicating that the segregation flux is nearly independent of size ratio (i.e. percolation is negligible in situations approaching the single LH particle limit). Similar behaviour is evident for the SL particles but in the opposite direction.
As expected, segregation goes to zero at the limits of  $c_l=0$ and
 $c_l=1$. One might hypothesize that the segregation behaviour of a SD-system at these two limits is similar to that of a S-system of the same size ratio or a D-system of the same density ratio. To test this hypothesis for the segregation behaviour at the two concentration limits, figure 8 plots segregation flux of large particles for a S-system of
 $R_d=2$, heavy particles for a D-system of
 $R_\rho =4$, and LH particles for a SD-system of
 $R_d=2$ and
 $R_\rho =4$. Solid curves are fits to the simulation results and symbols represent the segregation flux data for LH particles. The segregation flux of LH particles at
 $c_l \lessapprox 0.2$ (blue coloured area) nearly equals that of heavy particles in the D-system having the same
 $R_\rho$, indicating that buoyancy dominates. Likewise, for values of
 $c_l>rapprox 0.8$ (red coloured area) the segregation flux of LH particles matches that of large particles in the S-system having the same
 $R_d$, indicating percolation dominates at this limit. Between these two limits, for
 $0.2 \lessapprox c_l \lessapprox 0.8$, the LH curve deviates substantially from both the
 $R_d=2$ curve and the
 $R_\rho =4$ curve. One might speculate that the combined effect of size and density is simply a linear combination of the size effect and the density effect. To test this, consider the dashed curve which represents the sum of segregation fluxes for the S- and the D-systems. The mismatch between the data and the dashed curve clearly demonstrates that segregation model in an SD-system is not a simple linear combination of that for the corresponding S- and D-systems.
Fits of (3.1) to the segregation flux data for large particles in S-system ( ${\text {red}}$), heavy particles in D-system (
 ${\text {blue}}$), and large heavy particles in SD-system (
 ${\text {black}}$). Data for LH particles (
 $\circ$) in SD-system are identical to those in figure 5(b). Dashed curve is the sum of segregation fluxes for S- and D-systems. Blue and red coloured areas indicate the concentration ranges where buoyancy and percolation dominate, respectively.

Figures 4–8 show that the quadratic functional form of the segregation velocity in (1.3) and, equivalently, the cubic functional form of segregation flux in (3.1) are generally applicable to different combinations of size and density ratios. The segregation behaviour can be predicted for arbitrary  $R_d$ and
 $R_\rho$ combinations once the model coefficients
 $A_i$ and
 $B_i$ are known. To more fully characterize the dependence of
 $A_i$ and
 $B_i$ on particle size and density ratios, 126 simulations were performed (three simulations per case) for
 $R_d=1$, 1.1, 1.3, 1.5, 1.8, 2 and
 $R_\rho =$ 1/4, 1/3, 1/2, 1, 2, 3, 4. Here we focus on
 $R_d\le 2$ because outside this range the segregation velocity in S-systems changes its dependence on
 $R_d$, suggesting the possibility of a change in the size segregation mechanism (Golick & Daniels Reference Golick and Daniels2009; Schlick et al. Reference Schlick, Fan, Isner, Umbanhowar, Ottino and Lueptow2015a). Furthermore, computational requirements increase substantially with increasing size ratio because of the increasing burden of contact detection with increasing
 $R_d$. Figure 9 plots fitted values of the corresponding coefficients
 $A_l$ and
 $B_l$. Independent of
 $R_\rho$,
 $A_l$ increases with
 $R_d$ as shown in figure 9(a). For fixed
 $R_d$,
 $A_l$ decreases with increasing
 $R_\rho$. Figure 9(b) shows that
 $B_l$ becomes more negative with increasing
 $R_d$, and in all cases the magnitude of
 $B_l$ is smallest near
 $R_\rho =1$. Using an ad hoc approach described in the supplementary material, we provide empirical expressions for
 $A_l$ and
 $B_l$ for
 $1\le R_d\le 2$ and
 $1\le R_\rho \le 4$ (
 $A_l=0.35e^{-2R_\rho }+f_1$ and
 $B_l=(0.43e^{-0.2R_\rho }-0.2)R_d-A_l+f_2$, where
 $f_1=0.4R_d-0.4474$ and
 $f_2=-0.1342R_d^2+0.3514R_d-0.3646$). As noted earlier, finding
 $A_s$ and
 $B_s$ using small particle data should be equivalent to finding
 $A_l$ and
 $B_l$ using large particle data due to the segregation flux of one being the negative of the segregation flux of the other. Indeed, the values for
 $A_s$ and
 $B_s$ are within 5 % of those for
 $A_l$ and
 $B_l$ for all of the cases considered in figure 9.
Quadratic segregation velocity model coefficients: (a)  $A_l$ and (b)
 $B_l$ versus density ratio
 $R_\rho$ for various
 $R_d$ as indicated in panel (a). Filled symbols for
 $R_d=1$ and 1.5 represent simulations with no intraspecies variation in particle diameter in contrast to simulations with 10 % size polydispersity (open symbols). Error bars represent 95 % confidence bounds based on the fit to the data.

Though the segregation coefficients  $A_l$ and
 $B_l$ are derived from DEM simulations with heap width
 $W=0.5$ m and flow rate
 $q=20$ cm
 $^2$ s
 $^{-1}$, they are independent of global flow configurations. Consequently,
 $A_l$ and
 $B_l$ are generally applicable to any free surface flow as they are determined for each combination of
 $R_d$ and
 $R_\rho$ from a local flow parameter, specifically the local segregation velocity, over a wide range of values for the local shear rate
 $\dot \gamma$ and local particle concentration
 $c_i$.
One further consideration is that for the simulations up to this point, each particle species has a  $\pm$10 % variation in particle diameter, which is a common approach in DEM simulations to avoid ordered packing structures that can occur for identically sized particles. However, variation in particle size can create variations in segregation properties, particularly for
 $R_d$ close to 1 because the size distributions for the two species may overlap (Gao et al. Reference Gao, Ottino, Umbanhowar and Lueptow2021). To assess the impact of a narrow range of particle sizes in combination with differences in particle densities, simulations are also conducted for particle species of uniform size (filled data points in figure 9 for
 $R_d=1$ and 1.5). As shown in figure 9, the distribution of particle sizes has no effect on the resultant model coefficients for
 $R_d=1.5$. However, for
 $R_d=1$, the magnitude of
 $A_l$ for two particle species of uniform size is less than that for species with a narrow range of particle diameters, while
 $B_l$ remains nearly the same, indicating that the slight polydispersity promotes segregation for simulations where
 $R_\rho \ne 1$ as expected.
To more clearly convey the physical implications of the fitting parameters, consider that the segregation flux model in (3.1) is cubic with fixed zeros (roots) at  $c_l=0$ and
 $c_l=1$ independent of
 $A_l$ and
 $B_l$. A third zero exists at
 $c_l=1+A_l/B_l$ which is physical when
 $0\le 1+A_l/B_l\le 1$. Figure 10 plots
 $1+A_l/B_l$ as a function of
 $R_\rho$ for all cases except
 $R_d=1$, 1.1, because those results are affected by size dispersity of the two species. For mixtures with
 $1+A_l/B_l\le 0$, segregation flux of large particles,
 $\varPhi _{seg,l}$ from (3.1), is always greater than zero regardless of species concentration, indicating that the segregation is unidirectional. However, for
 $0<1+A_l/B_l<1$, the segregation direction is concentration dependent, with the segregation direction reversing at an equilibrium concentration,
 $c_{l,eq}=1+A_l/B_l$. It is evident that unidirectional segregation always occurs for
 $R_\rho \lessapprox 1.8$, while the direction of segregation is concentration dependent for
 $R_\rho >rapprox 1.8$.
Plot of  $1+A_l/B_l$ versus density ratio
 $R_\rho$ for various
 $R_d$. Uncertainties are calculated as
 $\sqrt {({{\rm \Delta} A}/{A})^2+({{\rm \Delta} B}/{B})^2 }({A}/{B})$. For mixtures with
 $0<1+A_l/B_l<1$ (shaded area), segregation reverses at an equilibrium concentration
 $c_{l,eq}=1+A_l/B_l$ where
 $\varPhi _{seg,l}=0$ (equation (3.1)). Filled inverted triangles for
 $R_d\approx 1.5$, 1.8 (hidden behind the blue triangle for
 $R_d\approx 2$), 2 (Félix & Thomas Reference Félix and Thomas2004) and stars for
 $R_d\approx 1.3$ and 2 (Alonso et al. Reference Alonso, Satoh and Miyanami1991) represent experimental results in rotating tumblers. Filled diamond is from heap flow experiments in Appendix B.

To validate this claim, the rise–sink transition predicted in figure 10 is compared with free surface flow experiments in a rotating tumbler in which LH tracer particles ( $c_l\approx 0$) with
 $R_d\approx 1.5$, 1.8 and 2.0 maintain an intermediate radial position in the flow for
 $R_\rho \approx 1.8$ (Félix & Thomas Reference Félix and Thomas2004). This corresponds to the size and density ratios where curves for
 $R_d\approx 1.5$, 1.8 and 2.0 intersect the
 $1+A_l/B_l=0$ (
 $c_{l,eq}=0$) horizontal line in figure 10. All three of these experimental data points for a rotating tumbler (inverted triangles, one of which is hidden behind the others) are indeed on the
 $1+A_l/B_l$ horizontal line at
 $R_\rho \approx 1.8$, thereby confirming the predicted transition from unidirectional segregation to a concentration dependent segregation direction. Similar experiments for mixtures of large glass and small plastic particles in a tumbler with
 $R_d\approx 1.3$ and
 $R_\rho \approx 2.4$ (Alonso et al. Reference Alonso, Satoh and Miyanami1991) show that the segregation direction changes at
 $c_{l,eq}=0.31$, and, again, a close match between the data point (green star) and the curve (green) is observed. However, a mixture of large steel and small glass particles with
 $R_d\approx 2.3$ and
 $R_\rho \approx 3.1$ (Alonso et al. Reference Alonso, Satoh and Miyanami1991) has an equilibrium concentration at which the segregation direction changes of
 $c_{l,eq}=0.65$ (blue star), which is significantly larger than the predicted value (
 $c_{l,eq}\approx 0.25$) for
 $R_d=2$. To further test the model for this particular combination of particle size and density ratios, a few simple experiments with similar large steel and small glass particles (
 $R_d\approx 2$ and
 $R_\rho \approx 3$) are conducted in a bounded heap flow (see Appendix B) similar to our previous experiments (Fan et al. Reference Fan, Boukerkour, Blanc, Umbanhowar, Ottino and Lueptow2012). Based on these experiments, it is clear that the concentration at which segregation changes direction is between 0.11 and 0.26 (blue diamond), which is consistent with the predicted value of 0.25.
A practical concern for many industrial situations is assuring that a mixture of two species of particles remains mixed. Figure 7 shows that mixtures of particles having certain combinations of size and density ratios have a segregation flux of zero at the equilibrium concentration and therefore remain mixed. The question is how to use this information to intentionally design the particles making up the mixture to minimize segregation and remain mixed? In many practical situations the material of each particle species is fixed, thereby fixing the density ratio. Likewise, the relative concentrations of the two species is typically specified to maintain certain properties of the overall mixture. However, frequently the sizes of the particles of each species can be altered as desired. This opens the possibility of specifying particle sizes to avoid segregation at a certain mixture concentration.
The dependence of the equilibrium concentration  $c_{l,eq}$ on particle size and density ratios is shown in figure 11, where isoconcentration curves for values of
 $c_{l,eq}=1+A_l/B_l$ are interpolated based on values of
 $A_l$ and
 $B_l$ for 77 different combinations of size and density ratios. The curves are cubic fits to the interpolated data forced to pass through (
 $R_\rho =1$,
 $R_d=1$), where segregation is necessarily zero. Particles remain mixed along the curve for
 $c_l=c_{l,eq}$ for the corresponding
 $R_d$ and
 $R_\rho$. Large particles rise if
 $c_l$ is greater than
 $c_{l,eq}$, whereas if
 $c_l$ is less than
 $c_{l,eq}$ large particles sink. Segregation is unidirectional for
 $R_d$ and
 $R_\rho$ combinations in the hatched regions of figure 11. For
 $R_d$ and
 $R_\rho$ combinations to the left of
 $c_{l,eq}=0$, large particles rise, while large particles sink for combinations below
 $c_{l,eq}=1$, regardless of the mixture concentration.
Equilibrium (no segregation) concentration of large particles  $c_{l,eq}$ as a function of particle size and density ratios. Symbol (
 $\circ$) diameter is proportional to
 $c_{l,eq}$ in the range 0 to 1. Isoconcentration curves for values of
 $c_{l,eq}$ are interpolated between data points. Particles stay mixed along the curve for
 $c_l=c_{l,eq}$ for the corresponding
 $R_d$ and
 $R_\rho$. Large particles rise if
 $c_l$ is greater than
 $c_{l,eq}$, whereas if
 $c_l$ is less than
 $c_{l,eq}$ large particles sink. Segregation is unidirectional (hatched regions) for
 $c_{l,eq}=0$ (large particles rise) and
 $c_{l,eq}=1$ (large particles sink).

To demonstrate the practical use of figure 11, consider a  $20\,:\,80$ mixture of large steel and small glass particles (
 $c_{l}=0.2$) with
 $R_d=2$ and
 $R_\rho =3$. The steel particles sink because the mixture concentration is less than the interpolated equilibrium concentration of
 $c_{l,eq}\approx 0.25$ at this combination of
 $R_d$ and
 $R_\rho$. On the other hand, large steel particles would rise if their concentration is greater than
 $c_{l,eq}\approx 0.25$.
Perhaps more importantly, figure 11 can be used to intentionally design a particle system so that the particles remain mixed by specifying the optimal size ratio  $R_d$ to minimize segregation (i.e. optimize the particles remaining mixed) for any given density ratio
 $R_\rho$ and desired mixture concentration. For example, a
 $50\,:\,50$ mixture (
 $c_{l}=0.5$) of small glass and large steel particles, corresponding to a density ratio
 $R_\rho = 3$, requires a size ratio of
 $R_d\approx 1.35$ to minimize segregation according to figure 11. A more detailed description of this approach is described in a separate publication (Duan, Umbanhowar & Lueptow Reference Duan, Umbanhowar and Lueptow2021).
Note that for low concentrations of LH particles ( $c_l<0.3$), the segregation behaviour is more complicated than at higher concentrations as the isoconcentration curves are non-monotonic. For example, to minimize segregation for a mixture with
 $R_\rho =2$ and
 $c_l=0.1$, there are two size ratios (i.e.
 $R_d\approx 1.4$ and 2) for which the particles remain mixed. This is consistent with previous studies on intruder particles under uniform shear, in which the lift-like force varies non-monotonically with size ratio having a maximum value near
 $R_d=2$ (Jing et al. Reference Jing, Ottino, Lueptow and Umbanhowar2020).
4. Continuum modelling of segregation
Previous studies show that a segregation velocity model combined with a transport equation can predict the segregation of an S- or D-system in quantitative agreement with experiments and simulations for different flow geometries (Wiederseiner et al. Reference Wiederseiner, Andreini, Épely-Chauvin, Moser, Monnereau, Gray and Ancey2011; Fan et al. Reference Fan, Schlick, Umbanhowar, Ottino and Lueptow2014; Schlick et al. Reference Schlick, Fan, Umbanhowar, Ottino and Lueptow2015b; Xiao et al. Reference Xiao, Umbanhowar, Ottino and Lueptow2016, Reference Xiao, Fan, Jacob, Umbanhowar, Kodam, Koch and Lueptow2019; Isner et al. Reference Isner, Umbanhowar, Ottino and Lueptow2020b; Barker et al. Reference Barker, Rauter, Maguire, Johnson and Gray2021). With the quadratic segregation velocity model presented here ((1.3) and (3.1)), we extend this approach to SD-systems and compare the model predictions with simulation results for a range of bidisperse heap flows. This also further validates the coefficient values  $A_i$ and
 $B_i$ determined in § 3, since the model predictions are compared with different flows than those from which
 $A_i$ and
 $B_i$ are determined.
Similar to previous studies (Fan et al. Reference Fan, Schlick, Umbanhowar, Ottino and Lueptow2014), we assume that flow kinematics and segregation are uncoupled and apply a modified advection–diffusion equation to predict the segregation of bidisperse granular heap flows like that shown in figure 1. Rearranging (2.4), utilizing conservation of volume, and noting that diffusion is significant for segregation only in the normal direction (Fan et al. Reference Fan, Schlick, Umbanhowar, Ottino and Lueptow2014), results in
 \begin{equation} \frac{\partial c_i}{\partial t} + u \frac{\partial{c_i}}{\partial x}+w\frac{\partial c_i}{\partial z}+\partial\frac{w_{seg,i}c_i}{\partial z}=\frac{\partial}{\partial z} \left( D\frac{\partial c_i}{\partial z} \right).\end{equation}
The transient term  ${\partial c_i}/{\partial t}$ is zero in a reference frame rising with the surface for the steady state heap flow segregation considered here, and the segregation velocity
 $w_{seg,i}$ is given by (1.3). Previous studies of quasi-2-D heap flow kinematics (Fan et al. Reference Fan, Schlick, Umbanhowar, Ottino and Lueptow2013) show that the streamwise velocity in the flowing layer is well approximated by
 \begin{equation} u(x,z)=\frac{kq}{\delta (1-e^{{-}k})} \left( 1-\frac{x}{L} \right) e^{kz/\delta}. \end{equation}
Here,  $k$ is a scaling constant set to
 $\ln (10)\approx 2.3$, so that
 $u(x,-\delta )=0.1u(x,0)$, consistent with the definition for
 $\delta$ earlier in this paper. Based on (4.2) and the continuity equation the normal velocity is (Fan et al. Reference Fan, Schlick, Umbanhowar, Ottino and Lueptow2013)
 \begin{equation} w(z)=\frac{q}{L(1-e^{{-}k})} (e^{kz/\delta}-1). \end{equation}
Equations (4.2) and (4.3) are for the bulk flow and are independent of the local concentration. These functional forms have been validated by experiments and simulations for size (Fan et al. Reference Fan, Schlick, Umbanhowar, Ottino and Lueptow2013) and density (Xiao et al. Reference Xiao, Umbanhowar, Ottino and Lueptow2016) bidisperse granular materials in quasi-2-D bounded heap and should be readily extended to particle mixtures that differ in both size and density. We demonstrate the validity of this assumption for an example SD-disperse mixture with  $R_d=2$,
 $R_\rho =4$ and
 $\hat c_l=0.5$ (see supplementary material). Note that other studies have used the
 $\mu (I)$-rheology model to determine the flow field analytically or numerically (Tripathi & Khakhar Reference Tripathi and Khakhar2013; Barker et al. Reference Barker, Rauter, Maguire, Johnson and Gray2021). However, applying the
 $\mu (I)$-rheology model requires determining additional fitting parameters. In addition, for the heap flows considered here the local rheology assumption may not be appropriate (GDR-MiDi 2004), since modifications to the
 $\mu (I)$-rheology model are needed to account for the creeping zone and non-local effects.
In dense granular flows, experimental (Bridgwater Reference Bridgwater1980; Utter & Behringer Reference Utter and Behringer2004) and computational (Fan et al. Reference Fan, Umbanhowar, Ottino and Lueptow2015; Cai et al. Reference Cai, Xiao, Zheng and Zhao2019; Fry et al. Reference Fry, Umbanhowar, Ottino and Lueptow2019) studies indicate that the diffusion coefficient,  $D$, is proportional to the product of the local shear rate and the square of the local mean particle diameter,
 \begin{equation} D=C_{diff} \dot\gamma \bar d^{\,2},\end{equation}
where  $\bar d=\sum c_id_i$ and
 $C_{diff}$ is a constant. Values for
 $C_{diff}$ have been reported in the range 0.01 to 0.1 (Savage & Dai Reference Savage and Dai1993; Hsiau & Shieh Reference Hsiau and Shieh1999; Utter & Behringer Reference Utter and Behringer2004; Fan et al. Reference Fan, Schlick, Umbanhowar, Ottino and Lueptow2014, Reference Fan, Umbanhowar, Ottino and Lueptow2015; Cai et al. Reference Cai, Xiao, Zheng and Zhao2019; Fry et al. Reference Fry, Umbanhowar, Ottino and Lueptow2019). In this study,
 $C_{diff}$ is approximated as a constant equal to 0.046 based on the diffusion coefficient data measured from the heap flow simulations using (2.8). This value is also consistent with a previous study on uniform shear flows, where
 $C_{diff}= 0.042$ (Fry et al. Reference Fry, Umbanhowar, Ottino and Lueptow2019). We further note that although the diffusion coefficient plays a role in the accurate determination of the segregation velocity (2.7), the continuum segregation model is insensitive to the precise value (Fan et al. Reference Fan, Schlick, Umbanhowar, Ottino and Lueptow2014). The local shear rate
 $\dot \gamma$ in (4.4) is calculated from the velocity profile in (4.2),
 \begin{equation} \dot\gamma=\frac{\partial u}{\partial z}=\frac{k^2q}{\delta^2 (1-e^{{-}k})} \left( 1-\frac{x}{L} \right) e^{kz/\delta}. \end{equation}
With the bulk velocity  $\pmb u$, the segregation velocity
 $w_{seg,i}$, and the diffusion coefficient
 $D$ determined, the continuum segregation model of (4.1) can be used to obtain the local concentration of each species in the flowing layer. Similar to previous studies (Fan et al. Reference Fan, Schlick, Umbanhowar, Ottino and Lueptow2014; Schlick et al. Reference Schlick, Fan, Isner, Umbanhowar, Ottino and Lueptow2015a; Xiao et al. Reference Xiao, Umbanhowar, Ottino and Lueptow2016), (4.1) is non-dimensionalized using
 \begin{equation} \tilde x=\frac{x}{L}, \quad \tilde z=\frac{z}{\delta},\quad \tilde u=\frac{u}{2q/\delta}\quad \text{and}\quad \tilde w=\frac{w}{2q/L}. \end{equation}
By substituting the segregation velocity (1.3) and the diffusion coefficient (4.4) into (4.1), the non-dimensional transport equation during steady filling takes the form
 \begin{equation} \tilde u \frac{\partial c_i}{\partial \tilde x}+\tilde w \frac{\partial c_i}{\partial \tilde z} + \frac{\partial }{\partial \tilde z} \{ \tilde{\dot\gamma} [A_i+B_i(1-c_i) ](1-c_i) c_i \} = \frac {\partial}{\partial \tilde z}\left( C_{diff} \tilde{\dot\gamma} \frac{\bar d^2}{d_s\delta} \frac{\partial c_i}{\partial \tilde z} \right),\end{equation}
where  $\tilde {\dot \gamma }={Ld_s\dot \gamma /2q}$ is the non-dimensional shear rate. Note that the local mean particle diameter
 $\bar {d}$ depends on local concentration,
 $c_i$. Values of
 $A_l$ and
 $B_l$ for the combination of
 $R_d$ and
 $R_\rho$ can be either found in figure 9 or estimated using expressions provided in the supplementary material. Note that
 $A_s = -(A_l + B_l)$ and
 $B_s=B_l$ due to volume conservation.
Equation (4.7) is solved numerically as an initial-boundary value problem using the pdepe solver in MATLAB with global parameters matching the simulation input ( $d_s$,
 $d_l$,
 $q$,
 $\hat c_l$) and measured directly from the simulations results (
 $\delta$,
 $L$) (Xiao et al. Reference Xiao, Umbanhowar, Ottino and Lueptow2016; Deng et al. Reference Deng, Umbanhowar, Ottino and Lueptow2018). For accurate model predictions, the boundary conditions for (4.7) need to match those in the DEM simulations. Following previous studies (Fan et al. Reference Fan, Schlick, Umbanhowar, Ottino and Lueptow2014; Xiao et al. Reference Xiao, Umbanhowar, Ottino and Lueptow2016), a well-mixed inlet boundary condition with local concentration independent of depth at the upstream end of the flowing layer is assumed, i.e.
 $c_{i} ({\tilde x=0,\tilde z})=\hat c_i$. At the top and bottom boundaries of the flowing layer, the segregation flux equals the diffusive flux, which are identical to those for size (or density) only segregation (Gray & Chugunov Reference Gray and Chugunov2006), and is expressed as
 \begin{equation} [A_i+B_i(1-c_i) ](1-c_i) c_i=C_{diff} \frac{\bar d^2}{d_s\delta} \frac{\partial c_i}{\partial \tilde z} (\tilde z=0,-1).\end{equation}
No boundary condition is needed at  $\tilde x=1$ since both segregation and diffusion act in the
 $z-$direction and the streamwise velocity is zero.
The predicted concentration profiles using a well-mixed inlet boundary concentration,  $c_{i}({\tilde x=0,\tilde z})=\hat c_i$, are compared with the simulation results for
 $R_d=2$ and
 $R_\rho =4$ for three different inlet concentrations in figure 12 (corresponding to the simulations for the three inlet concentration examples shown in figure 2). Each of the panels in figure 12(a–f) depicts the local concentration of large particles,
 $c_l$, in flowing layer corresponding to the rectangular box in figure 1 (inlet is the left edge of each panel, free surface is the top edge, bottom of the flowing layer where particles are deposited on the heap is the bottom edge, and downstream endwall is the right edge). The continuum model results for the large particle concentration throughout the flowing layer shown in the second row of figure 12 are nearly identical to that for DEM simulation in the first row, demonstrating how the model matches simulation results. Most significantly, the continuum segregation model captures the reversed segregation for different feed concentrations. For
 $\hat c_l= 0.2$ (figure 12a,d) LH particles quickly segregate to the bottom of the flowing layer in the upstream portion of the heap, while SL particles rise to the surface of the flowing layer and are advected farther downstream. Increasing
 $\hat c_l$ to 0.5 reverses the segregation direction, such that LH particles rise toward the free surface and are advected downstream, as shown in figure 12(b,e). Further increasing
 $\hat c_l$ to 0.8 results in an enlarged LH particle region in figure 12(c,f) with SL particles only in the lower part of the upstream portion of the flowing layer.
Large heavy particle concentration for different feed concentrations:  $\hat c_l= 0.2$ (a,d,g),
 $\hat c_l= 0.5$ (b,e,h) and
 $\hat c_l= 0.8$ (c,f,i). Here,
 $c_l$ from (a–c) simulation and (d–f) continuum model with inlet boundary condition
 $c_{i}({\tilde x=0,\tilde z})=\hat c_i$; (g–i)
 $c_l$ for LH particles (
 $\circ$) and
 $c_s$ for SL particles (
 ${\triangle }$) from simulation compared with model predictions using (4.7) at the bottom of the flowing layer (curves), (i.e.
 $z/\delta =-1$ or
 $\tilde z=-1$) versus streamwise position,
 $x/L$ for inlet boundary condition set to feed concentration
 $c_{i}({\tilde x=0,\tilde z})=\hat c_i$ (dashed) or mean concentration of particles deposited on the heap outside the feed zone
 $c_{i} (\tilde x=0,\tilde z)=\langle c_{i}(\tilde x,\tilde z=-1)\rangle$ (solid). Inset: concentration fields corresponding to the model predictions of solid curve in (i). Here,
 $R_d=2$,
 $R_\rho =4$,
 $q=20$ cm
 $^2$ s
 $^{-1}$,
 $\delta \approx 1.5$ cm and
 $L=52$ cm.

Figure 12(g–i) compare the streamwise concentration profiles from the simulations (data points) and continuum model predictions (dashed curves) at the bottom of the flowing layer ( $z/\delta =-1$), which corresponds to the concentration of particles deposited on the heap. Again the reversal of the direction of the segregation is evident. For
 $\hat c_l=0.2$ the concentration of LH particles is highest for
 $x/L<0.6$ as they deposit on the upstream portion of the heap along with SL particles. Pure SL particles deposit on the downstream end of the heap. The situation reverses for
 $\hat c_l=0.5$ and 0.8 where SL particles deposit on the upstream portion of the heap along with a lower concentration of LH particles, and pure LH particles deposit on the downstream portion. Moreover, that the continuum segregation model can predict the combined size and density segregation for different inlet concentrations as shown in figure 12 further validates the quadratic functional form of the segregation velocity in (1.3).
The difference between the continuum model predictions (dashed curves) and the simulations (data points) is small (less than 7 % on average) for  $\hat c_l=0.2$ and 0.5. The slight deviations between simulation and model predictions in these two cases could be the result of many factors including bouncing particles near the free surface and the decreasing flowing layer thickness near the bounding endwall, neither of which are included in the model. In contrast, the discrepancy between the continuum model prediction and simulation results for
 $\hat c_l=0.8$ is relatively large in the middle portion of the heap, see figure 12(i). In addition, it is evident in figure 12(i) that the large particle concentration integrated over the length of the heap is larger for the simulations than for the continuum model and the small particle concentration is smaller. This is a result of strong segregation combined with deposition in the feed zone for
 $\hat c_l=0.8$, noting that the segregation flux is maximum near
 $c_l=0.8$ in figure 5 for these particular values of
 $R_d$ and
 $R_\rho$. Thus, small particles segregate to the bottom of the flow in the feed zone to deposit on the heap before they start to flow down the heap. As a result, the inlet of the flowing layer has a higher large particle concentration and a lower small particle concentration than the feed concentration (i.e. mixture falling onto the heap).
To account for segregation in the feed zone, we use a corrected inlet concentration for the model,  $c_{i} (\tilde x=0,\tilde z)=\langle c_{i}(\tilde x,\tilde z=-1)\rangle$, which is the mean concentration at the bottom of the flowing layer outside of the feed zone as determined from the simulation. Alternatively, the mean inlet particle concentration at the inlet boundary where particles enter the flowing layer (
 $\langle c_{i}(\tilde x=0, \tilde z)\rangle$) could be used. However, because the rise velocity varies slightly near the feed zone, particles deposited on the bed through the bottom of the flowing layer more accurately reflect the mean particle concentration entering the upstream end of the flowing layer in the simulations. The corrected inlet concentrations measured from the three simulations in figure 12 are
 $\langle c_{i}(\tilde x,\tilde z=-1)\rangle = 0.19$, 0.49, and 0.83 rather than the actual values of feed concentration of
 $\hat c_l= 0.17$, 0.47 and 0.79, respectively.
Model predictions using the corrected inlet concentration (solid curves) match the simulation results more closely for  $\hat c_l=0.8$ in figure 12(f) (inset) and figure 12(i), significantly reducing the discrepancy for
 $0.3< x/L<0.6$. For the other two cases with
 $\hat c_l=0.2$ and 0.5 in figure 12(g,h), the corrected inlet concentration has limited influence on the model predictions, which is expected since the segregation flux is less than half of that for
 $\hat c_l=0.8$, and the particles entering the flowing layer are relatively well mixed.
A more rigorous test of the continuum segregation model and the quadratic form of the segregation velocity of (1.3) is to consider flows with different combinations of size and density ratios ( $R_d=1-2$ and
 $R_\rho =1/2-4$), a different heap width (
 $W=0.4$ m), and a different feed rate (
 $q=15$ cm
 $^2$ s
 $^{-1}$) than those used to obtain the parameters of the segregation model, i.e.
 $A_i$ and
 $B_i$ in figure 9. Similar to figure 12(g–i), the predicted concentration profiles (curves) for particles deposited on the heap are compared with the simulation results (data points) in figure 13, but only for the large particle concentration so that three different feed concentrations can be more clearly shown for each case. Among the four different cases, the
 $R_d=1$ and
 $R_\rho =4$ case reduces to density only segregation, for which the continuum segregation model works well, as shown in figure 13(a). A more interesting case occurs when size and density differences enhance one another, as shown in figure 13(b) for
 $R_d=2$ and
 $R_\rho =1/2$. Again, the model predictions match the simulation results reasonably well despite some discrepancies for
 $\hat c_l=0.5$ and 0.8 due to significant segregation in the feed zone similar to that in figure 12(i). Using the corrected inlet concentration determined from the simulations significantly reduces these discrepancies (solid curves).
Streamwise large particle concentration profiles at  $z/\delta =-1$ for different feed concentrations with a variety of size and density ratios from simulation (symbols) and model (curves). Solid curves are model predictions with the inlet boundary condition
 $c_i(\tilde x=0)=\hat c_i$ while dashed curves are model predictions with a corrected inlet boundary condition measured from simulation,
 $c_{i} (\tilde x=0,\tilde z)=\langle c_{i}(\tilde x,\tilde z=-1)\rangle$. Here,
 $q=15$ cm
 $^2$ s
 $^{-1}$,
 $\delta \approx 1.5$ cm and
 $L=43$ cm.

For  $R_d=1.5$ and
 $R_\rho =4$ in figure 13(c) and
 $R_d=2$ and
 $R_\rho =2$ in figure 13(d), the size and density segregation mechanisms oppose one another. In figure 13(c), the shape of the curves depends strongly on the inlet concentration, particularly at the downstream end of the heap (large
 $x/L$) where the large particle concentration goes to 1 for large
 $\hat c_l$ and 0 for small
 $\hat c_l$ in figure 13(c). According to figure 11, the equilibrium concentration is
 $c_{l,eq}\approx 0.5$, and the results for
 $\hat c_l=0.5$ in figure 13(c) indeed show that the particles remain mixed throughout the entire length of the flowing layer. Figure 13(d) corresponds to a case where
 $c_{l,eq}\approx 0.1$ (see figure 7(a) and 11). Again, particles remain mixed at
 $\hat c_l=0.2$ for almost the entire length of the flowing layer, as would be expected for this concentration that is very close to the equilibrium concentration. On the other hand, for other values of
 $\hat c_l$, the particles segregate. Again the use of a corrected inlet concentration improves the match between the continuum model and the simulation results. However, even without this correction, the agreement for all four cases in figure 13 is remarkable given the wide range of
 $R_d$,
 $R_\rho$ and
 $\hat c_l$, not to mention the simplifying assumptions for the velocity profile and uniform flowing layer thickness. This shows that with appropriate model coefficients, the quadratic segregation velocity model of (1.3) can accurately predict bidisperse heap flow segregation not only for different feed concentrations, but also for different particle size and density ratios.
5. Conclusions
When two segregation driving mechanisms (i.e. percolation and buoyancy) compete with each other, the segregation flux varies non-monotonically with particle concentration such that the segregation direction can reverse, depending on the relative concentration of the two species. This is different from size or density segregation alone, where the segregation velocity and flux never change sign (Schlick et al. Reference Schlick, Fan, Isner, Umbanhowar, Ottino and Lueptow2015a; Xiao et al. Reference Xiao, Umbanhowar, Ottino and Lueptow2016; Jing et al. Reference Jing, Kwok and Leung2017; Jones et al. Reference Jones, Isner, Xiao, Ottino, Umbanhowar and Lueptow2018).
Although the segregation behaviour of SD-systems is more complicated than S- or D-systems alone, it is possible to model the local concentration dependent rising and sinking behaviour in free surface flows. To do so, we extend a predictive model for either size or density segregation alone to bidisperse granular materials where particles can differ simultaneously in both size and density using a segregation velocity model that is quadratic in particle concentration (1.3). The two model coefficients can be determined from DEM simulations of quasi-2-D bounded heap flow for a range of combinations of particle size and density ratios. Our segregation velocity model, which is quadratic in particle concentration, is qualitatively similar to the model derived within the framework of mixture theory (Gray & Ancey Reference Gray and Ancey2015). By incorporating the quadratic segregation velocity model into an advection–diffusion–segregation transport equation, the model predictions match well with simulation results.
The theoretical framework presented here is consistent with previous studies, which means the extended segregation velocity model of (1.3) should be applicable to not only quasi-2-D bounded heap flow but also other 2-D (Schlick et al. Reference Schlick, Fan, Umbanhowar, Ottino and Lueptow2015b; Xiao et al. Reference Xiao, Fan, Jacob, Umbanhowar, Kodam, Koch and Lueptow2019) and three-dimensional (Isner et al. Reference Isner, Umbanhowar, Ottino and Lueptow2020a,Reference Isner, Umbanhowar, Ottino and Lueptowb) geometries with known flow kinematics. Moreover, continuous size distributions could be considered in this same framework for polydisperse segregation (Schlick et al. Reference Schlick, Isner, Freireich, Fan, Umbanhowar, Ottino and Lueptow2016; Deng et al. Reference Deng, Umbanhowar, Ottino and Lueptow2019; Gao et al. Reference Gao, Ottino, Umbanhowar and Lueptow2021). However, more research is needed to validate the model for a wider range of particle properties, particularly with respect to the effect of particle size and density ratios on the coefficients  $A_i$ and
 $B_i$. Some progress has been made in this direction for single intruder particles in SD-systems (Jing et al. Reference Jing, Ottino, Lueptow and Umbanhowar2020), but connecting single intruder results to mixtures of particles like those considered here is not yet possible. Nevertheless, the results in figures 12 and 13 indicate that the extended segregation velocity model can accurately predict combined size and density segregation.
An interesting implication of the concentration dependent segregation direction is the stability of particle mixtures at the equilibrium concentration indicated in figure 11. For heap flows like those in figure 5, reduced segregation flux near the equilibrium concentration increases the segregation time scale to be much greater than the time scale of heap flow kinematics. In such cases, particles deposit onto the heap without significant segregation occurring. Intentionally designing non-segregating particle systems based on appropriate values for particle size, density and concentration is explored in detail elsewhere (Duan et al. Reference Duan, Umbanhowar and Lueptow2021). Or, in another interesting situation, segregation occurs until the local concentration reaches the equilibrium concentration,  $c_{l,eq}$, and then stops. Evidence of this appears in figure 5(a) where the data points reach a limit near the equilibrium concentration (
 $c_{l,eq}\approx 0.4$) when approached from either side of the equilibrium concentration. For example, blue data points for
 $\hat c_l=0.3$ fall in the range of
 $0\leq c_l \lessapprox 0.4$ because once the local concentration reaches
 $c_{l,eq}\approx 0.4$ the particles no longer segregate and remain mixed. As a result, only a small fraction of the data points are for a local concentration that exceeds
 $c_{l,eq}$. A similar result occurs when
 $c_{l,eq}$ is approached from a higher concentration, although it is not clearly evident in figure 5(a) because of how data points overlay one another. This could have interesting implications for other flow configurations such as rotating tumblers, where particle mixtures initially near the equilibrium concentration can evolve for sufficient time that an instability occurs in which a small perturbation of concentration results in segregation that pushes the local mixture concentration farther away from the equilibrium concentration and further segregation continues. This is beyond the scope of this study but deserves further investigation.
The problem of segregation in granular materials is too expansive to ever be declared fully solved for all possible mixtures and flows. Advances in direct simulations will continue and then become routine, and new conceptual breakthroughs will occur that yield new insights into the physics of the problem. However, we seem to have reached a stable rung on the ladder of modelling segregation in terms of continuum models. Models describing size or density driven segregation have been shown to capture – in three way comparisons – both experimental and computational results. And now, in what may be regarded as nearly the last step in the evolution of such continuum models, we have shown that it is possible to simultaneously model size and density segregation.
Supplementary material
Supplementary material is available at https://doi.org/10.1017/jfm.2021.342.
Acknowledgements
We thank Y. Fan, J. Hecht, A. Thornton, H. Xiao and L. Jing for valuable discussions. We are also grateful for helpful comments from the reviewers.
Funding
This material is based upon work supported by the National Science Foundation under Grant no. CBET-1929265.
Declaration of interests
The authors report no conflict of interest.
Appendix A. Comparison with previous models
Unlike the segregation velocity model developed in this work, previous models by Marks et al. (Reference Marks, Rognon and Einav2012), Tunuguntla et al. (Reference Tunuguntla, Bokhove and Thornton2014) and Gray & Ancey (Reference Gray and Ancey2015) are based on mixture theory, in which partial pressure and interspecies drag models are needed to close the momentum equation and solve for the segregation velocity. We compare each of these models to the present model below. Marks et al. (Reference Marks, Rognon and Einav2012) propose a partial pressure  $P_i$ for constituent
 $i$ proportional to the mean diameter ratio of constituent particle species to the bulk, i.e.
 $P_i/P=d_i/\sum {d_ic_i}$. Using a linear drag model, the segregation velocity for large particles is
 \begin{equation} w_{seg,l}=\dot\gamma\frac{g\cos\alpha}{C_{drag}}\left( \frac{d_l}{\bar d}- \frac{\rho_l}{\bar\rho} \right). \end{equation}
Substituting  $\bar d=\sum {d_ic_i}$ and
 $\bar \rho =\sum \rho _ic_i$ into the equation above gives
 \begin{equation} w_{seg,l}=\dot\gamma\frac{g\cos\alpha}{C_{drag}}\frac{(1-c_l)(R_d-R_\rho) }{(R_dc_l+1-c_l)(R_\rho c_l+1-c_l)}. \end{equation}
Regardless of the values of the drag coefficient  $C_{drag}$ (a fitting parameter based on simulation results), local shear rate
 $\dot \gamma$ and local concentration
 $c_l$, the segregation direction is only determined by
 $R_d-R_\rho$ in the numerator. Hence, the model is unable to predict the observed concentration dependent segregation direction.
The model by Tunuguntla et al. (Reference Tunuguntla, Bokhove and Thornton2014) differs from the model of Marks et al. (Reference Marks, Rognon and Einav2012) in two key points. First, the volume ratio of the species to the bulk is used for calculating the partial pressure:  $P_i/P=d_i^3/\sum {d_i^3c_i}$. Second, a mass-weighted bulk velocity,
 $w=\sum {\rho _ic_iw_i}/\sum \rho _ic_i$, is used in contrast to the volume-weighted bulk velocity,
 $w=\sum {c_iw_i}/\sum c_i$, in the Marks et al. (Reference Marks, Rognon and Einav2012) model as well as our model. The mass-weighted relative velocities of the two species are expressed as
 \begin{equation} w_{l}-w=\dot\gamma\frac{g\cos\alpha}{C_{drag}} \frac{1}{R_\rho} \left[ \frac{c_l(R_d^3-R_\rho) }{c_l+(1-c_l)R_d^3} \right] \end{equation}
and
 \begin{equation} w_{s}-w={-}\dot\gamma\frac{g\cos\alpha}{C_{drag}} \left[ \frac{(1-c_l)(R_d^3-R_\rho) }{c_l+(1-c_l)R_d^3} \right]. \end{equation}
Since  $w$ is mass-weighted rather than volume-weighted, it is unclear how to determine the segregation direction based on the segregation velocity. However, we can relate the segregation direction to the relative velocity between the two species:
 \begin{equation} w_{l}-w_s=\dot\gamma\frac{g\cos\alpha}{C_{drag}} \frac{1}{R_\rho} \left[ \frac{[c_l+(1-c_l)R_\rho](R_d^3-R_\rho) }{c_l+(1-c_l)R_d^3} \right]. \end{equation}
In this expression, the segregation direction depends only on  $R_d^3-R_\rho$ in the numerator, which is independent of
 $c_l$. Again, similar to the Marks et al. (Reference Marks, Rognon and Einav2012) model, the Tunuguntla et al. (Reference Tunuguntla, Bokhove and Thornton2014) model is unable to predict the observed dependence of the segregation direction on species concentration.
For further comparison with our model, figure 14(a) overlays the rise–sink transition predicted by Marks et al. (Reference Marks, Rognon and Einav2012) and Tunuguntla et al. (Reference Tunuguntla, Bokhove and Thornton2014) on figure 11. Both models can be represented by a single curve in the  $(R_d,R_\rho )$ space in figure 14(a), because the predicted rise–sink transition does not depend on the mixture concentration. Neither model can predict the observed rise–sink transition over a range of mixture concentrations. The predictions of the Marks et al. (Reference Marks, Rognon and Einav2012) model, which is independent of
 $c_{l,eq}$ (or, equivalently, valid for
 $0< c_{l,eq}<1$), clearly differ from our model (which is based on and matches DEM simulation results), except perhaps in a qualitative sense for
 $c_{l,eq}\approx 0$. The non-segregating condition predicted by Tunuguntla et al. (Reference Tunuguntla, Bokhove and Thornton2014), which is also independent of
 $c_{l,eq}$ (valid for
 $0< c_{l,eq}<1$), is similar to that of the present model only for
 $c_{l,eq}=0.5$, but differs substantially for other values of
 $c_{l,eq}$. Interestingly, to support their model, Tunuguntla et al. (Reference Tunuguntla, Bokhove and Thornton2014) measured the equilibrium condition for chute flows of equal volume mixtures (
 $c_l=c_s=0.5$). These results (data points with error bars in figure 14a) are consistent with the present model and DEM simulations for
 $c_{l,eq}=0.5$, further supporting the present model. For completeness, we also include in figure 14(a) the Jenkins & Yoon (Reference Jenkins and Yoon2002) model that is derived from the kinetic theory of granular flows (known as KTGF) for
 $c_{l,eq}=0.5$. Despite the success of this model in predicting the rise–sink behaviour of equal volume mixtures in fluidized particle beds (Hong et al. Reference Hong, Quinn and Luding2001), this granular temperature based approach, while appropriate for dilute granular flows, does not directly apply to the dense flow regime considered here. As a result, its prediction does not match our DEM validated model for
 $c_{l,eq}=0.5$, as shown in figure 14(a).
(a) Equilibrium (no segregation) concentration of large particles  $c_{l,eq}$ versus particle size and density ratios. Black circles and solid curves are identical to those in figure 11 of the paper. Here,
 $c_{l,eq}=0.5$ is highlighted as a bold black curve. Coloured curves show the rise–sink prediction from previous studies. Blue data points represent neutral segregation conditions for mixtures with
 $c_l=0.5$ in chute flow DEM simulations (Tunuguntla et al. Reference Tunuguntla, Bokhove and Thornton2014). (b) Segregation flux data for
 $R_d=2$ and
 $R_\rho =4$. Bold curves overlaying the data are predictions of the present model identical to those in figure 5. Thin curves are predictions of (A6) by Gray & Ancey (Reference Gray and Ancey2015) in the appropriate
 $C_{10}$ parameter range assuming
 $C_{drag}=30/\dot \gamma d_s$ for
 $B_{ls}=0.75$ and 1, respectively. Gray & Ancey's model prediction does not match the DEM simulation results for segregation reversal,
 $c_{l,eq}$, regardless of the values of
 $B_{ls}$.

The model by Gray & Ancey (Reference Gray and Ancey2015) is functionally capable of predicting the concentration dependent segregation direction, in contrast to the models of Marks et al. (Reference Marks, Rognon and Einav2012) and Tunuguntla et al. (Reference Tunuguntla, Bokhove and Thornton2014), because the partial pressure takes a different form,  $P_i/P=[1+B_{ij}(1-c_i)]c_i$, where
 $|B_{ij}|\le 1$ is a coefficient dependent on particle size ratio
 $R_d$. The quadratic form of partial pressure substituted into the momentum equation leads to a concentration dependent segregation direction for certain values of
 $B_{ij}$. Following their approach, the particle segregation fluxes are expressed as
 \begin{equation} \varPhi_l=\frac{g\cos\alpha}{C_{drag}}\left[ \frac{1}{R_\rho}-1+ \left( c_l+\frac{1-c_l}{R_\rho} \right)B_{ls} \right] c_l(1-c_l)+w_{diff}c_l\end{equation}
and
 \begin{equation} \varPhi_s=\frac{g\cos\alpha}{C_{drag}}\left[ R_\rho-1- \left( R_\rho c_l+{1-c_l} \right)B_{ls} \right] c_s(1-c_s)+w_{diff}c_s,\end{equation}
where
 \begin{equation} w_{diff}={-}\frac{g\cos\alpha}{C_{drag}}\left[ \frac{1}{R_\rho}+R_\rho-2 + \left( 2c_l+\frac{1-c_l}{R_\rho}-R_\rho c_l-1 \right)B_{ls} \right] c_l(1-c_l), \end{equation}
is the difference between mass-weighted and volume-weighted mean velocities. Though an explicit expression for  $B_{ls}$ as a function of
 $R_d$ is not provided, we can make some reasonable assumptions to quantitatively compare the measured segregation flux in figure 5 and the prediction of Gray & Ancey (Reference Gray and Ancey2015) for specific values of
 $B_{ls}$ and
 $R_\rho$ (based on values for
 $C_4$,
 $C_5$ and
 $C_{10}$ in figure 4 in their paper). However, they do not provide information about the functional form of
 $C_{drag}$, and the dependence of segregation flux on shear rate
 $\dot \gamma$ and particle size
 $d_i$ are not explicitly considered. In order to accomplish a comparison with our results, we assume
 $C_{drag}=C'_{drag}/\dot \gamma d_s$ and a value for
 $C'_{drag}$ such that the magnitude of the segregation flux is similar to what we measure, noting that different values of
 $C'_{drag}$ only change the amplitude of the segregation flux curve, not the equilibrium concentration
 $c_{l,eq}$ at which segregation reverses. Figure 14(b) compares our segregation flux data for
 $g=9.81$ m s
 $^{-2}$,
 $\alpha =28^o$,
 $R_d=2$ and
 $R_\rho =4$ with the prediction of the model of Gray & Ancey (Reference Gray and Ancey2015) with
 $C'_{drag}=30$ for
 $B_{ls}=0.75$ and 1, which are the extremes of the
 $C_{10}$ parameter region (i.e.
 $0.75< B_{ls}\le 1$ for
 $R_\rho =4$ in which the segregation reverses for
 $0< c_{l,eq}<1$). These values for
 $C'_{drag}$ and
 $B_{ls}$ result in segregation flux magnitudes qualitatively similar to those from our DEM simulations and which our model accurately describes. More important, however, are the values for
 $c_{l,eq}$, where the segregation flux reverses. Results for the model of Gray & Ancey (Reference Gray and Ancey2015) differ significantly from our data. Their model indicates a large value of the concentration where the segregation reverses,
 $0.67\le c_{l,eq}\le 1$, for the valid range of
 $B_{ls}$ that they specify. This differs considerably from the value of
 $c_{l,eq}\approx 0.35$ from our DEM simulations. This is mainly because a symmetric form for the partial pressure fails to capture the asymmetric concentration dependence in size segregation. In another approach to apply the model of Gray & Ancey (Reference Gray and Ancey2015), we empirically determine the value of
 $C'_{drag}$ by performing a least squares fit between their model and our flux data using
 $B_{ls}=0.75$, 1 and
 $R_\rho =4$. However, this does not change the value of
 $c_{l,eq}$ in their model, so just like the approach of simply specifying a value for
 $C'_{drag}$, the predicted value for the concentration at which the segregation reverses is far from the measured value. Thus, like the three models considered in figure 14(a), it is clear that the Gray & Ancey (Reference Gray and Ancey2015) model does not accurately predict the concentration dependence of the segregation flux found in the DEM simulation results.
Equations (A1)–(A8) from Marks et al. (Reference Marks, Rognon and Einav2012), Tunuguntla et al. (Reference Tunuguntla, Bokhove and Thornton2014) and Gray & Ancey (Reference Gray and Ancey2015) also indicate that the segregation flux depends linearly on the gravitational constant  $g$ and the cosine of the repose angle
 $\alpha$. This differs from our model for free surface flows in which the segregation model coefficients
 $A_i$ and
 $B_i$ in (3.1) are essentially independent of
 $g$ or
 $\alpha$, as is discussed in more detail in the supplementary material.
Appendix B. Experiment
To validate the concentration dependent segregation direction observed in DEM simulations and predicted by the model, experiments were performed with large steel and small glass particles. The experimental set-up is similar to that in the simulation. The heap width between the bounding endwalls is  $W=0.4$ m. The gap between the two parallel glass plates is
 $T=1$ cm. Particle mixtures are fed into the system by an auger feeder at a rate of
 $Q=12$ cm
 $^3$ s
 $^{-1}$. The width of the feed zone is
 $W_f=4$ cm. With the particle properties given in table 2, the size ratio of large steel to small glass particles is
 $R_d\approx 2$ and the density ratio is
 $R_\rho \approx 3$. Figure 15 shows images for different feed concentrations. The segregation direction reverses as the feed concentration of steel particles,
 $c_{steel}$, is increased from 0.11 to 0.26.
Heap flow segregation for mixtures of large steel (dark) and small glass (light) particles with  $R_d\approx 2$ and
 $R_\rho \approx 3$. Steel particles sink while glass particles rise for
 $c_{steel}=0.11$, as buoyancy overcomes percolation, leading to more glass particles depositing at the downstream end. In contrast, for
 $c_{steel}=0.26$ segregation reverses as percolation dominates over buoyancy. Particles remain relatively mixed for
 $c_{steel}=0.13$.

Particle properties in experiments.