Introduction
There is no debate in this day and age about the importance of political appointments in affecting policy and politics.Footnote 1 Those serving in the executive branch and independent agencies play key roles in determining both the ideological direction of public policy and the efficiency of implementation and appointed judges utilise lifetime tenures to interpret the nature of acceptable policy, levels of delegated discretion, as well as the Constitution itself. Understanding each step of who is chosen, and when we go from vacancy to appointee, is crucial in the quest to understand performance and accountability.
Not surprisingly, the appointments process is often highly conflictual. The intensity of battles has risen in recent decades, with increasingly gridlocked parties and the post-Bork era breakdown of norms resulting in historically high executive branch and judicial vacancy rates (O’Connell Reference O’Connell2009).Footnote 2 Seemingly highly qualified individuals who have had to wait an inordinate amount of time, such as former Environmental Protection Agency head Gina McCarthy – who took a record 136 days for approval in 2013 despite having worked for Republican Mitt Romney as well as for Democrats – became symbols of such intransigence. So too have those whose nominations have been stalled to the point where time simply runs out, such as Merrick Garland, where claimed rights associated with the so-called “Thurmond Rule” – that nominations did not need to be brought up when elections are looming (e.g. Smith Reference Smith2014; Wheeler Reference Wheeler2012) – were invoked to block consideration of his nomination as a Supreme Court justice in 2016. These and many other examples have generated both widespread concern over the possible effects of prolonged vacancies and increasing scholarly attention into the myriad factors influencing who is nominated, nomination and confirmation duration (the length of time until a nomination is sent to the Senate or final Senate action occurs), and final disposition (whether a nomination is confirmed, rejected or withdrawn).
However, in two ways empiricists and theoreticians have taken somewhat different paths in the quest to understand executive nominations: the choice analysed and the appointment process studied. Empiricists have largely concentrated on explaining how long it takes from Presidential nomination to Senatorial disposition. Theorists have generally centred on predicting the ideological orientation of those who are chosen, with a focus on the period from vacancy occurrence to nominee choice.
Numerous factors might help explain these discrepancies. One possible reason empiricists analyse time from nomination to disposition might be ease of measurement.Footnote 3 Both the dependent variable, the period from Presidential nomination to Senate disposition (as well as the disposition itself), and independent variables, such as nominee background, Presidential and legislative ideologies, and other political constructs, are readily accessible. Conversely, until recently (Bonica, Chen and Johnson Reference Bonica, Chen and Johnson2015), estimates for bureaucratic nominees’ ideologies were not widely available – leaving empirical scholars either unable to assess the determinants of ideologies or examining them for very particular nominee types – and ascertaining time from vacancy to nomination was difficult (O’Connell Reference O’Connell2009; Hollibaugh and Rothenberg Reference Hollibaugh and Rothenberg2017).Footnote 4
Analogously, theorists’ proclivities to highlight a nominee’s ideology once a vacancy occurs are intuitively sensible. Theorists are inclined to model policy preferences of political decision-makers, be they organised interests, legislators, executives or bureaucrats, on an ideological dimension. In the context of appointments, this translates into investigating the type of appointee the President might prefer once a vacancy opens and how choices might be adjusted as a function of the preferences of those who must approve the nominee (i.e. the filibuster pivot and, at present, the Senate median).Footnote 5
Recently, scholars have begun reconciling the discrepancies between empirical and theoretical approaches, with those on each side of the divide incorporating the others’ concerns. As implied, empiricists have started developing new ideological measures situating nominees in the same space as other key political actors (Nixon Reference Nixon2004; Bailey Reference Bailey2007; Bertelli and Grose Reference Bertelli and Grose2009; Clinton et al. Reference Clinton, Bertelli, Grose, Lewis and Nixon2012; Bonica, Chen and Johnson Reference Bonica, Chen and Johnson2015; Chen and Johnson Reference Chen and Johnson2015) and, as we will discuss, data on the time from vacancy to nomination have become more available. Theorists, at the cost of considerable added complexity, have begun constructing models explicitly incorporating the trade-off between waiting for an appointee’s approval with settling for a less ideologically desirable but more easily confirmable bureaucrat (Chiou and Rothenberg Reference Chiou and Rothenberg2014; Hollibaugh Reference Hollibaugh2015b; Jo Reference Jo2017).
Nevertheless, to date no empirical study of executive nominations investigates the relationship between these temporal and ideological concerns. Yet, this is a key step toward informing theory and reconciling it with data. It can furnish insights into important empirical relationships and shed light on whether those writing theories incorporating the many choices underlying appointments are on the right track or need to make adjustments.
Here, we provide this empirical linkage. Specifically, we take the most appropriate recent theoretical model integrating ideology and time to ultimate disposition (Hollibaugh Reference Hollibaugh2015b) – in that it begins from a vacancy’s rather than a nomination’s occurrence – and empirically explore several of its key results. In particular, we focus on its predictions that nominees put forth later in vacancies should be more ideologically aligned with the President and less with the Senate. Additionally, in the spirit of this model’s logic, we examine how nomination timing within a Congress might impact ideological alignment.
Our analysis spans 1999–2011 (the 106th–111th Congresses), the period jointly covered by our data sources.Footnote 6 Our findings are intriguing if not quite in synch with extant theory. Empirically, nominees’ ideological preferences are conditioned by temporal concerns; the longer Presidents take to nominate someone postvacancy, or within a particular Congress, the greater the ideological divergence between themselves and their nominees, suggesting that time’s passage disadvantages executives. Theoretically, these results are at odds with hypotheses deduced from Hollibaugh (Reference Hollibaugh2015b). Thus, we show a relationship between timing and ideology in the appointment process, but one providing reason to rethink the theoretical foundations of the underlying dynamics – for example, by accounting for Presidential term limits and attributing higher discount rates to Presidents versus Senators, given the former’s shorter expected time in office relative to the latter’s.
Ideology and the nominations process
Formal models of the appointments process typically proceed with elements of the following sequence, with not all models including each step or every decision therein: (1) a position requiring an executive appointment opens; (2) the executive either makes a nomination to fill the vacancy or fails to do so (and the game ends); (3) if a nomination is made, the legislature either confirms or rejects; and (4) the agency or court in which the vacancy arose implements policy, and payoffs are allocated to all players (Epstein and O’Halloran Reference Epstein and O’Halloran1999; Gailmard Reference Gailmard2002; Bendor and Meirowitz Reference Bendor and Meirowitz2004; Asmussen Reference Asmussen2011; Hollibaugh, Horton and Lewis Reference Hollibaugh, Horton and Lewis2014; Jo and Rothenberg Reference Jo and Rothenberg2014; Hollibaugh Reference Hollibaugh2015a, Reference Hollibaugh2015b, Reference Hollibaugh2017; Jo Reference Jo2017). Such models are typically made context-specific by altering the relevant institutional constraints (e.g. a filibuster rule versus majoritarian choice versus committee chair agenda control), the executive’s ability to make unilateral nominations (e.g. through Schedule C or recess appointments), the relevant ideological space (e.g. if there is a single dimension or multiple dimensions) and germane informational assumptions (e.g. whether the nominee’s ideology or other traits are known).
Whatever the specifics, such models normally restrict the role of time and concentrate on nominees’ ideologies. The executive decides the moment a vacancy arises, and the legislature then chooses (which can include inaction); given the structure of the nominations process, the executive typically conditions his or her choice based on expected legislative opposition (or acquiescence). While some recent models capture temporal dynamics vis-à-vis either the executive or the legislature (Jo Reference Jo2017; Jo, Primo and Sekiya Reference Jo, Primo and Sekiya2017), only Hollibaugh’s (Reference Hollibaugh2015b) model integrates delay between vacancy onset and executive nomination and then between nomination and disposition.Footnote 7 As such, of existing models, it is best suited to guide our empirical analysis, though our present focus is on the ideological orientations of nominees.Footnote 8
Fundamentally, the model suggests that, while executive-legislature ideological divergence generally reduces ideological convergence between the executive and nominees, the time since vacancy onset typically advantages the nominating executive in terms of ideological outcomes. The reasons for this are twofold: (1) the President’s greater time to find a nominee to his or her liking increases the likelihood of an ideological match;Footnote 9, Footnote 10 and (2) the costs to the Senate of an appointee about whom it is unhappy are typically reduced, as many executive appointees resign after (or anticipating) a new President’s inauguration or are replaced by the new President.Footnote 11, Footnote 12 As such, among the model’s results are that, with increased time since vacancy onset, there will be waning legislative opposition and the confirmation of ideologically divergent nominees is more likely, and there is a greater likelihood of the President submitting even more extreme nominees.Footnote 13
That said, we should reiterate that this model assumes that the temporal frame of reference is the time since vacancy onset. But our discussion – as well as the empirical literature – suggests that when in a particular Congress a nomination occurs might also be relevant. Indeed, empirically, nominations are more likely early in a Congress (Hollibaugh and Rothenberg Reference Hollibaugh and Rothenberg2017) and confirmations occur more slowly and are less likely when nominations are made later (Krutz, Fleisher and Bond Reference Krutz, Fleisher and Bond1998; Martinek, Kemper and Van Winkle Reference Martinek, Kemper and Van Winkle2002; Shipan and Shannon Reference Shipan and Shannon2003). These patterns indicate that Presidents may “triage” nominees with limited time remaining in a Congress, such that Presidential nominations late in a Congress may be more moderate than those made earlier.Footnote 14 Even then, however, this compromise may be insufficient to compensate for the higher workloads and more limited amount of time available to vet nominees as Congresses near their conclusions.
Thus, we investigate four empirical hypotheses, two explicitly grounded in theory and two modestly extending this theoretical logic, linking duration and ideology:Footnote 15
Hypothesis 1: Increased vacancy length should be associated with greater ideological convergence between nominees and the President.
Hypothesis 2: Increased vacancy length should be associated with lessened ideological convergence between nominees and the Senate.
Hypothesis 3: Less time remaining in a Congress at the time of nomination should be associated with less ideological convergence between nominees and the appointing President.
Hypothesis 4: Less time remaining in a Congress at the time of nomination should be associated with more ideological convergence between nominees and the Senate.
Data, methods and results
Analysing our hypotheses requires data on ideology, vacancy length and other claimed determinants of nominee choices. As mentioned, available data cover 1999–2011, which spans the final two years of the Clinton administration, the subsequent Bush administration and the first two years of the Obama presidency.
For ideology, we employ Bonica’s CFscores (Bonica Reference Bonica2013, Reference Bonica2014; Bonica, Chen and Johnson Reference Bonica, Chen and Johnson2015), which are ideological estimates utilising campaign finance records, to measure the spatial positions of Presidents (Clinton, Bush and Obama), Senators, and, most notably, nominees (whether approved or not by the Senate). The CFscores’ appeal, in contrast to alternative ideology measures – such as those based on roll-calls and/or survey responses (Aldrich and McKelvey Reference Aldrich and McKelvey1977; Poole and Rosenthal Reference Poole and Rosenthal1997; Nixon Reference Nixon2004; Bailey Reference Bailey2007; Bertelli and Grose Reference Bertelli and Grose2009; Clinton, Jackman, and Rivers Reference Clinton, Jackman and Rivers2004; Clinton et al. Reference Clinton, Bertelli, Grose, Lewis and Nixon2012) – is that it puts nearly all individuals who either made or received campaign contributions between early 1979 and mid-2012 on a common ideological scale (though whether donors are in the dataset is subject to reporting requirements that may suppress publication of an individual’s name and/or amount donated if the latter is sufficiently small). As such, we have preference estimates in the same space for Presidents, Senators, and the roughly two-thirds of executive appointees whose names we can match to the database.Footnote 16, Footnote 17 Overall, we have scores for 849 of 1,290 nominations for which we have vacancy data and, as some individuals are nominated to multiple vacancies at different times, for 793 of 1,157 unique individuals.
For duration, the biggest issue is ascertaining when a vacancy arises. As mentioned, and following Hollibaugh and Rothenberg (Reference Hollibaugh and Rothenberg2017), we utilise vacancies reported to the Government Accountability Office (GAO) pursuant to the Federal Vacancies Reform Act of 1998 (FVRA). Thus, we analyse vacancies from the 106th through 111th Congresses (January 1999–January 2011), tracing their progressions until the end of the latter Congress. While the FVRA database (located at http://www.gao.gov/legal/federal-vacancies-act/overview) does not cover all vacancies, it is the most complete public resource to date.Footnote 18
With our ideology and duration data we can examine our hypotheses. To begin, we require dependent variables measuring the relationships between the ideologies of nominees, Presidents, and Senate pivots, as well as independent variables capturing – at the point of nomination – the time since vacancy onset as well as the time elapsed in a given Congress. Thus, we utilise three dependent variables, which we log to eliminate skew and ensure residual normality: (1) President-Nominee Divergence, the logged absolute difference of the CFscores of the nominee and the nominating President; (2) Filibuster-Nominee Divergence, an analogous measure but with the CFscore of the Senate filibuster pivot replacing the President’s; and (3) Relative Divergence, the difference between President-Nominee Divergence and Filibuster-Nominee Divergence, with higher values corresponding to lower relative convergence with the President.Footnote 19, Footnote 20
For our key independent variables, we measure the times since the beginning of a vacancy and in a Congress when a nomination was made as follows:
(1) Year in Vacancy, the number of years (defined as the number of days divided by 365) since vacancy onset; and
(2) Year in Congress, the number of years elapsed in the relevant Congress (defined as the number of days elapsed divided by 365).Footnote 21
We also include several covariates used in previous research. Foremost is the ideological distance between the executive and the legislature (Krehbiel Reference Krehbiel1998), President-Filibuster Distance, operationalised as the absolute value of the difference between the President’s and filibuster pivot’s positions.Footnote 22 We also incorporate Divided Government, a dichotomous variable that equals one if the Senate Majority Leader and the President are from opposing political parties, and zero otherwise. Additionally, we interact these two measures to address the possibility that conflict over preferences is heightened when the opposing party is in power.
As position hierarchy has been shown to affect the appointments processes, we follow past research (McCarty and Razaghian Reference McCarty and Razaghian1999; Chiou and Rothenberg Reference Chiou and Rothenberg2014; Hollibaugh and Rothenberg Reference Hollibaugh and Rothenberg2017) and trichotomise bureaucratic hierarchy.Footnote 23 We include two dummy variables, Tier One and Tier Two, with the former scored one for secretaries, attorney generals, and the administrator of the Environmental Protection Agency and zero otherwise. The latter is scored one for under, deputy and assistant secretaries and associate, deputy and assistant attorney generals and zero otherwise. Tier Three, which is omitted, is scored one for all other appointments and zero otherwise.
To capture other intangibles potentially affecting the difficulty of Senate rejection, as well as to account for Presidential behaviour perhaps being driven by such forces, we include Presidential Approval, operationalised by the daily Gallup tracking poll.Footnote 24 As the Senate’s workload might affect the confirmation process – previous research suggests the Senate moves more quickly (McCarty and Razaghian Reference McCarty and Razaghian1999; Ostrander Reference Ostrander2016), perhaps due to greater efficiency or Presidential prodding – we define Daily Workload by the number of daily roll-call votes, and Pending Nominations by the number of nominations awaiting final action. We include President’s First Term – which equals one if the vacancy began during the first term of a President, and zero otherwise – to account for other possible temporal issues. And because repeat nominations to fill the same vacancy might increase the perception of urgency (Hollibaugh and Rothenberg Reference Hollibaugh and Rothenberg2017), we include Nomination Attempt, measured as one plus the previous number of nominations made to fill a specific vacancy.
Finally, to capture any residual department- or area-specific influences, we include dummy variables for the Departments of Agriculture, Commerce, Justice and Labor and, following standard practice (McCarty and Razaghian Reference McCarty and Razaghian1999; Chiou and Rothenberg Reference Chiou and Rothenberg2014; Hollibaugh and Rothenberg Reference Hollibaugh and Rothenberg2017), we group the Departments of Education, Health and Human Services, and Housing and Urban Development as Social Welfare, Energy, Interior and Transportation as Infrastructure, Defense and Homeland Security as National Security, and agencies that lie within the Executive Office of the President or outside of a cabinet department’s purview as Nondepartmental.
In terms of methods, to account for the President simultaneously choosing whether and whom to nominate, we estimate a Heckman (Reference Heckman1979) selection model with vacancy-day level observations. The dependent variable in the selection equation is whether or not a nomination was made for that vacancy on the day in question, and the dependent variables in the outcome equations are those mentioned earlier: President-Nominee Divergence, Filibuster-Nominee Divergence, and Relative Convergence.Footnote 25 To meet the exclusion restriction requirement of at least one significant variable exclusive to the selection equation, we omit the department-level indicators as well as Daily Workload and Pending Nominations from the outcome equations. While these factors have been found relevant for appointment duration, there is no theoretical reason that they should impact nominees’ ideological orientations, conditional on a nomination being made.Footnote 26 We also cluster on vacancy attempt to account for correlations within vacancies as well as within distinct attempts to fill the same vacancy (given that many vacancies in our dataset require multiple nominations before being filled).Footnote 27
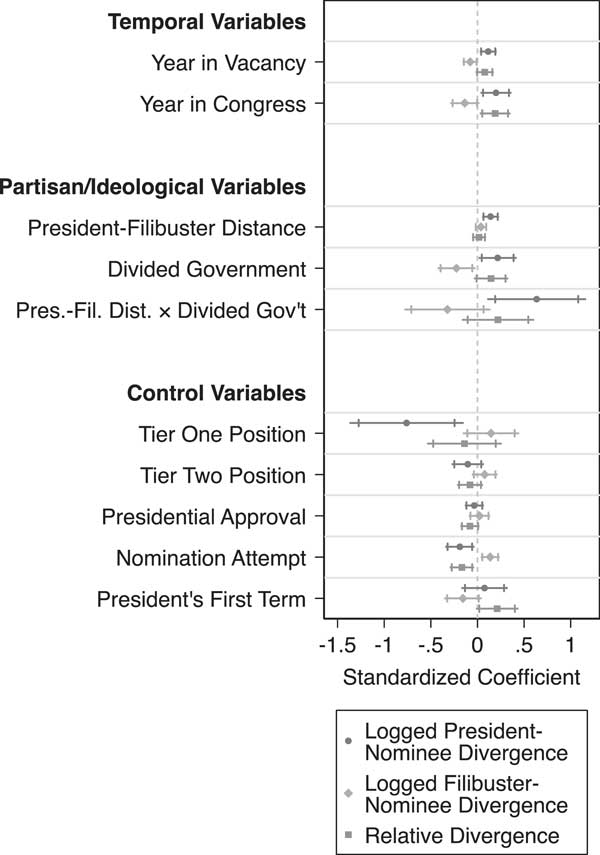
Our results are intriguing, particularly for the outcome equations, which are of primary interest. Findings are shown in Table 1, and Figure 1 presents the standardised effects to allow for comparability between coefficients. While there is a relationship between both vacancy length and time remaining in Congress with nominees’ ideological orientations, the estimated direction is contrary to our hypotheses. Most notably, in all models and across both ideology measures, time’s passage disadvantages the President relative to the Senate, even when considering the possibility of a “honeymoon” period.
Heckman selection models of executive nominations and nominee ideology

Note: Standard errors clustered on vacancy-attempt in parentheses. Boldfaced variables indicate the temporal variables of interest.
Two-tailed tests: ***p <0.01, **p <0.05, *p <0.1.
Model Results. Note: Constant result suppressed. The graph presents coefficient estimates from three different OLS models where the dependent variables (indicated by the legend) are standardised to have mean zero and standard deviation one, as are President-Filibuster Distance and Presidential Approval. Thus, this graph shows the effect of a one-year change in Year in Vacancy and/or Year in Congress, a one-standard deviation change in President-Filibuster Distance and/or Presidential Approval, and the effects of moving from zero to one for the remaining (dichotomous) variables. 90% confidence intervals are denoted by the horizontal lines and 95% confidence intervals are denoted by the vertical bars.

Specifically, in two of the three models, Time in Vacancy is statistically significant and substantially affects the outcome equation. A one-year increase in vacancy length increases Logged President-Nominee Divergence by 11.5% of one standard deviation, decreases Logged Filibuster-Nominee Divergence by 7.7% of one standard deviation (and increases Relative Divergence by 7.8% of one standard deviation, but this effect is not statistically significant). While these effects may seem small, they should be considered in context – under unified government, a one standard deviation increase in President-Filibuster Distance increases Logged President-Nominee Divergence by about 18% of one standard deviation, and the same increase under divided government is about 33.8%; moreover, President-Filibuster Distance has no effect on the other two dependent variables. This suggests that increasing vacancy length by 1.5 years has the same effect on Logged President-Nominee Divergence under unified government, and a three-year increase has the same effect under divided government.
The effects of Time in Congress are even stronger, though this is at least partially due to the compressed period (a maximum of two years). A one-year increase in Year in Congress increases Logged President-Nominee Divergence by 19.9% of one standard deviation, decreases Logged Filibuster-Nominee Divergence by 13.6% of one standard deviation, and increases Relative Divergence by 18.9% of one standard deviation. These impacts are comparable to that of a one standard deviation increase in President-Filibuster Distance during unified government, and about half that during divided government.
Additionally, almost all other independent variables are only significant in the outcome equation when Logged President-Nominee Divergence is the dependent variable. This suggests the President’s key concern is the nominee’s ideological orientation vis-à-vis him- or herself. This supposition is buttressed by  $\rho $, the error correlation between the selection and outcome equations, only being significant in the Logged President-Nominee Divergence model, indicating that nomination timing is related to ideology almost exclusively in the context of the nominee’s ideological distance to the President. Conversely, the ideologies of nominees relative to the filibuster pivot’s preference are less predictable. This is perhaps due to less consistent strategies on the part of the President, less concern for the Senate’s response, or to the presence of the status quo inducing more structure into the ideologies of nominees relative to the President than into the ideologies of nominees relative to the filibuster pivot.Footnote 28 Regardless, our analysis suggests more research on this topic is necessary.
As for the other independent variables not relevant to our hypotheses, two findings stand out for the Logged President-Nominee Divergence outcome equation. First, while high ideological divergence between the President and the filibuster pivot results in greater divergence between nominees and the President, this effect is stronger under divided government. Additionally, appointments to the highest-ranking positions (Tier One) are more likely ideologically close to the President than are those to other positions, all else equal. This finding is in line with previous research suggesting that Senators are reluctant to engage in confirmation battles over high-profile nominations, and Presidents both place great premiums on having allies in these positions and are far less able to “go public” in favour of lower-level appointments (Chiou and Rothenberg Reference Chiou and Rothenberg2014; Ostrander Reference Ostrander2016).
More broadly, Nomination Attempt is significant in all outcome equations, suggesting repeat nominations are more favourable to the President. While not considered by our theory, these results are consistent with a “blame game” dynamic à la Groseclose and McCarty (Reference Groseclose and McCarty2001), in which the legislature sends extreme bills to the President to force a veto and make the chief executive seem ideologically extreme. Here, the audience costs may be reversed as a President, knowing confirmation is less likely once previous nominations have failed, may be more willing to put forth more ideologically extreme individuals to make recalcitrant Senates seem more extreme in the public’s eye and to force cooperation on nominations more generally. However, this is beyond the scope of this article, and we leave it for future research.
Additionally, though not our main focus, results for the selection equations are consistent with previous findings regarding nomination timing after vacancy onset (Hollibaugh and Rothenberg Reference Hollibaugh and Rothenberg2017). Presidents are more likely to nominate more quickly under divided government, presumably because oppositional Senates take more time to confirm (and, in the case of failure, this leaves the President more time for a subsequent nomination), though the pace of nominations under divided government decreases as the ideological gulf widens between the President and the Senate. Yet, regardless of partisan control, nominations are slower when the ideological gulf is greater.
Further, per past research, Presidents are more likely to nominate for higher ranking positions more quickly, thus ensuring the most policy-relevant positions are filled and enabling the administration to more effectively implement the President’s agenda. Finally, nominations proceed quicker when the Senate is busier, whether measured by roll-call activity or pending nomination backlogs.
Returning to the main motivation for our analysis, our results show temporal dynamics play important roles in the appointments process and affect the kinds of nominees Presidents put forth. Most notably, time’s passage, whether measured as the days since a vacancy or since a Congress begins, typically disadvantages the President vis-à-vis the Senate pivot. Such a result is contrary to expectations, with ramifications with which we must come to grips.
Discussion and conclusions
The archetypal empirical analysis assessing predictions generated by formal approaches provides support for the theory. Our analysis, to the contrary, indicates that we may need to rethink how models of the underlying confirmation process are specified. This process is extremely complicated given all the different considerations – for example, in terms of timing and the effects on both quality and the ideological outcomes of policy – and is inherently difficult to model theoretically in its totality. Our empirical results suggest that there is considerably more work to be done.
To recapitulate, we began with a wish to bring theoretical and empirical analyses of the appointments process closer together, as we believe that this is our best means of gaining additional insight into how such critical decisions are made. Specifically, our goal was to examine how temporal dynamics affect the appointments process, particularly how they influence the ideologies of the nominees put forth by the President. To do so, we started with the most applicable theoretical model (Hollibaugh Reference Hollibaugh2015b), which posited that time since vacancy onset should advantage the nominating executive relative to the legislature, as most appointees (perhaps save for those with fixed terms and restrictions on removal) would have less time with which to implement policy not to the legislature’s liking. We extended this model’s logic by hypothesising that timing within a Congress should also play a role, with nominees growing more ideologically divergent over the course of a Congress, simply because the President recognises that the Senate has less time with which to confirm and will seek to avoid prolonged confirmation battles.
Surprisingly, the passage of time, whether measured since vacancy onset or since the beginning of a particular Congress, seemingly disadvantages the President, though effects are strongest and most consistent for the time since vacancy onset. Substantive effects are relevant yet believable, and are comparable to those caused by modest increases in the size of the ideological gulf between the President and the filibuster pivot.Footnote 29
What might this tell us about where theory should go? One possible explanation for the mismatch between our empirical results and the model’s predictions, and thus an avenue for further development, involves the discount factor by which the future is weighted. While Hollibaugh (Reference Hollibaugh2015b) assumes a common discount factor for Presidents and Senators, as well as a common number of time periods over which utility is earned, this may not be a realistic assumption. If Presidents take office through election, from their first day they know they have at most eight years to implement their agendas, and they will have difficulty realising their goals with vacancies for key positions. Conversely, Senators have potentially much longer frames of reference given their longer terms and the lack of term limits. Indeed, at the time of any nomination, the average sitting Senator during the period under investigation had served roughly 10–14 years already, and about half had been in the House for an average of 8 years as well (Glassman and Wilhelm Reference Glassman and Wilhelm2017). As such, Presidents likely have more incentive to get vacancies filled more quickly than Senators. A respecified model with greater Senatorial patience may give executives greater incentive to compromise as time passes and their ability to make policy – as measured by the time remaining in their terms, the potential time outstanding in their administrations, or the time available in the Senate for confirmations – slips away. Put differently, per standard bargaining logic, the more patient we assume Senators are the better they should do.
We should recognise that allowing legislators to discount the future less than executives is not a new idea. Notably, Kousser and Phillips (Reference Kousser and Phillips2009) utilise the Rubinstein (Reference Rubinstein1982) bargaining framework and specify a model of budget negotiations between governors and state legislatures. While not explicitly modeling the budgetary process in the same way we model the dynamics of the appointments process, their analysis suggests governors should be less successful when dealing with more patient legislatures. These findings are backed up by their empirical analyses, where governors are less influential when bargaining with more professional legislatures, especially those with longer sessions (i.e. those legislatures that can afford to be more “patient”). As the US Congress is arguably the most professionalised legislature in the country, with one of the longest – if not the longest – legislative sessions, it is likely that they are disproportionately patient relative to other American legislatures. As mentioned, the relative difference of Senatorial patience relative to executive patience is probably especially great in Congress as Senators serve six-year terms (and House members with two-year terms are uninvolved) and, in contrast to many states, term limits do not exist. Thus, differential discount rates should be especially important for confirmation politics in the US Congress.
Although we have focused on bureaucratic appointments, paying attention to the discount factor should also be helpful in discerning differences and commonalities in comparing the executive and judicial appointment processes. To date, models of both typically adopt similar assumptions regarding the underlying structure. However, if discount factors and the number of time periods play important roles for the executive appointment process due to different time horizons between Presidents and Senators, the relevance of discounting and time for the judicial appointment process when judges can serve indefinitely should be greater and should be reflected in observable empirical patterns.Footnote 30
Hence, rather than validating existing theory, our analysis indicates a need to step back and rethink assumptions. Given our results, as well as the example of Kousser and Phillips (Reference Kousser and Phillips2009) in developing a stylised theory supported by empirical analysis, we recommend that scholars of the nominations process recognise that structural and temporal constraints affecting Presidents and Senators are likely more distinct than typically assumed. In the best-case scenario, doing so would provide us with a more complete picture of the process, and would produce additional predictions that could be investigated to assess whether we are on the right track or have simply written a model to conform to current empirical findings.
We should also acknowledge that there are other opportunities to build on our theories in ways that can provide important insights into nominations. For instance, our analysis takes vacancies as given, when they might be the result of strategic calculations.Footnote 31 A more fully fleshed-out approach might consider the possible gaming of appointees’ decisions to leave office and/or Presidents’ decisions to remove them from their positions, as well as the importance of agencies for the President’s agenda. This could include consideration of structural factors, such as restrictions on removal power, which might limit Presidents and advantage bureaucrats postconfirmation, or the strategic nomination of individuals with various personal traits that affect both the speed and likelihood of confirmation.Footnote 32, Footnote 33 We leave this for future research.
Finally, we should reiterate that our analysis focuses on the prenuclear Senate, when the filibuster pivot wielded influence during the confirmation process. Going forth, scholars will be able to examine how removing the filibuster has changed the nominations process, as well as conditioned the role of other factors in the nominations process (e.g. placement of the targeted agency on the President’s agenda). However, beyond advantaging the President during times of unified government, it is unclear how the dynamics uncovered here will substantively change with Rule 22’s demise.