Introduction
Crystallization is a pervasive phenomenon in synthetic, environmental, and biological systems. The majority of important technological materials, from semiconductors to pharmaceuticals, are crystalline. Ice crystals forming in the atmosphere influence the balance of solar energy reaching the Earth, while minerals impact soil fertility and carbon retention, and represent dynamic reservoirs of crystal formation and transformation. In living systems, crystallization is exploited to produce functional tissues both through the assembly of ordered protein matrices and through the formation of biominerals such as bones and teeth. The interplay between living systems and the environment often takes place through crystal formation and dissolution. We owe our oxygen atmosphere to iron reduction and oxidation reactions by microbes at this interface, and the vast volume of carbonates in the geological record and modern-day oceans are a product of the intimate relationship between biota and minerals going back one billion years. These phenomena impact global seawater chemistry and the flux of CO2 into and out of the atmosphere.
Classical nucleation theory
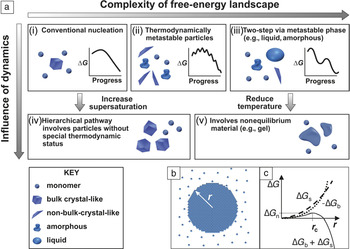
Crystallization starts with nucleation, a phenomenon that was first explained in terms of thermodynamic principles by J.W. Gibbs in the 1870s. Reference Gibbs and Smith1 Although Gibbs was considering the formation of raindrops—condensation of water into droplets from humid air—the principles of what has come to be known as “classical nucleation theory” (CNT) were later applied to crystal formation. Reference Becker and Doring2 The key insight that Gibbs provided was that, unlike a simple chemical reaction, nucleation is not a spontaneous process, even when the chemical potential change in producing the new phase is negative (i.e., the system is supersaturated). Rather, a free-energy barrier, ∆G c, must be overcome before a nascent crystal nucleus can grow to macroscopic size ( Figure 1a[i]). Reference De Yoreo, Gilbert, Sommerdijk, Penn, Whitelam, Joester, Zhang, Rimer, Navrotsky, Banfield, Wallace, Michel, Meldrum, Cölfen and Dove3 This article will address nucleation from solutions, however, the concepts apply equally to vapor and melt crystallization.
(a) Possible pathways by which monomers form a stable bulk crystal, and the physical mechanisms that give rise to them, can have (i–iii) thermodynamic and (iv–v) kinetic origins. (i) Classical monomer-by-monomer addition. (ii) Aggregation of metastable microscopic precursors that can be liquid, amorphous, or crystalline. (iii) Crystallization via formation of a metastable bulk phase, including dense liquids or solid amorphous or crystalline polymorphs. (iv) Kinetically dominated aggregation of clusters or oligomers. (v) Aggregation of unstable particles whose internal structures are not those of equilibrium phases. (b) Formation of a spherical cluster of radius, r, from a solution leads to the free-energy changes shown in (c). The crossover of the volume (∆G b) and surface (∆G s) terms combined with their opposing signs leads to a free-energy barrier (∆G n) at a critical radius (r c) over which the system must pass via thermal fluctuations before the cluster can spontaneously grow. Adapted with permission from Reference Reference De Yoreo, Gilbert, Sommerdijk, Penn, Whitelam, Joester, Zhang, Rimer, Navrotsky, Banfield, Wallace, Michel, Meldrum, Cölfen and Dove3. © 2015 AAAS.

According to CNT, Reference Kashchiev4 the barrier ∆G c exists because the appearance of the solid phase also creates a phase boundary with a surface tension. While the chemical potential drop ∆μ associated with transfer of ions, atoms, or molecules from the solution to the solid nucleus (Figure 1b) contributes to a negative change in free energy, the creation of the phase boundary contributes to a positive change. The former scales with volume, which dominates at large size, but the latter scales with surface area, which dominates at small size; this leads to a free-energy barrier (Figure 1c). As it is impossible to move a system uphill in free energy globally, nucleation is then only possible because of the inherent thermal fluctuations in density that raise the free energy locally.
Within CNT, the rate of nucleation, J, depends explicitly on ∆G c, which reflects the collective behavior of the system in exploring its possible configurations, including those that are microscopically and transiently out of equilibrium. However, the rate will also be influenced by a second barrier, E A, which represents the activation energy for atomistic processes, such as desolvation or binding, that limit the rate of any chemical reaction independent of a free-energy barrier. The classical expression for the nucleation rate is: Reference De Yoreo, Vekilov, Dove, De Yoreo and Weiner5
 $$J\, = \,Ae^{ - E_A /kT} \,e^{ - \Delta G_\rm{c} /kT} ,\,\,\,\,\,\,\,\,\,\Delta {G_\rm{c}} = B{{{\alpha ^3}} \over {{\sigma ^2}}}$$
where A is a material-dependent constant, k is the Boltzmann constant, T is the temperature, B is a constant that depends on the shape and density of the nucleating solid as well as the temperature, α is the interfacial free energy and σ is the supersaturation (σ = –∆μ/kT).
As Equation 1 shows, the barrier itself contains two important parameters. One is σ, which can be controlled in the laboratory, and the other is α, which is determined by the properties of the two phases and appears as a cubic term in an exponential. Thus, in CNT, α has a tremendous impact on the probability of nucleation. In the following examples, the importance of both parameters will be explored.
Nonclassical nucleation pathways
The basic predictions of CNT—that there is a free-energy barrier to nucleation, fluctuations take the system over that barrier, and the nucleation rate depends exponentially on σ and α—were widely accepted for the better part of a century. Moreover, a number of systems exhibit behavior consistent with the predictions of CNT. However, in the past 20 years, numerous observations have revealed more complex processes at work. As illustrated throughout the remainder of this article, many systems do not exhibit the simple process of sequential addition of monomeric species, such as ions or atoms, to a growing crystalline nucleus. Reference De Yoreo, Gilbert, Sommerdijk, Penn, Whitelam, Joester, Zhang, Rimer, Navrotsky, Banfield, Wallace, Michel, Meldrum, Cölfen and Dove3 Rather, the pathways of nucleation are hierarchical, either involving the addition of a more complex species, such as multi-ion complexes Reference Habraken, Tao, Brylka, Friedrich, Schenk, Verch, Bomans, Frederik, Laven, van der Schoot, Aichmayer, de With and De Yoreo6 and oligomers, Reference Demichelis, Raiteri, Gale, Quigley and Gebauer7 or passing through transient metastable states, including dense liquids, Reference Vekilov8 amorphous solids, Reference Nielsen, Aloni and De Yoreo9 and crystalline polymorphs. Reference Nielsen, Aloni and De Yoreo9 In some systems, particularly those exhibiting complex stoichiometry (e.g., calcium phosphates) or lattice structure (e.g., zeolites), nucleation is accompanied by chemical transformations that lead to compositional evolution as the nucleus grows.
There are two essential shortcomings of CNT. First, it ignores complexities in the free-energy landscape. CNT assumes the capillarity approximation is valid; that is, the excess free energy that gives rise to the barrier is simply assumed to be equal to the bulk interfacial free energy (or equivalently, given by the bulk surface tension). Reference Kashchiev4 This approximation is expected to fail in the limit of small cluster size, where restructuring at the surface and the existence of favored configurations of solute and solvent molecules should lead to deviations from the bulk value, both on average and through local minima and maxima (Figure 1a[ii]). These minima represent microscopic states that can never exist macroscopically at equilibrium, because they are unstable relative to the solution, but nonetheless, can provide pathways to nucleation. Moreover, many systems exhibit multiple phases—often polymorphs—on the bulk phase diagram that are stable relative to the solution and accessible—sometimes more so than the most final stable phase—at finite σ (Figure 1a[iii]). These intermediate phases can then appear, even at macroscopic size, as precursors to the final crystalline phase.
The second shortcoming of CNT is that it ignores dynamical effects. Even in a system for which the energy landscape is smooth and nucleation follows classical predictions at low σ, at sufficiently high σ the density of precritical clusters will be large, and the evolution of the system will progress through the cluster interaction and aggregation (Figure 1a[iv]). Alternatively, for systems in which transient metastable phases or unstable microscopic states are produced, kinetic limitations may leave the system trapped in these states (Figure 1a[v]).
This conceptual picture—in which the constant interfacial free energy is replaced by an excess free energy that reflects the complexities associated with low-energy configurations and metastable phases, and the effect of dynamics is overlain upon the thermodynamics—provides a holistic framework for understanding hierarchical pathways of nucleation. The challenge that must now be addressed is to first answer the question, “Given that complex pathways can arise for thermodynamic or kinetic reasons, in what systems do they occur and for what reason?” and to then build a quantitative framework that can replace CNT by incorporating the thermodynamic complexities and dynamical effects.
Transient microscopic states
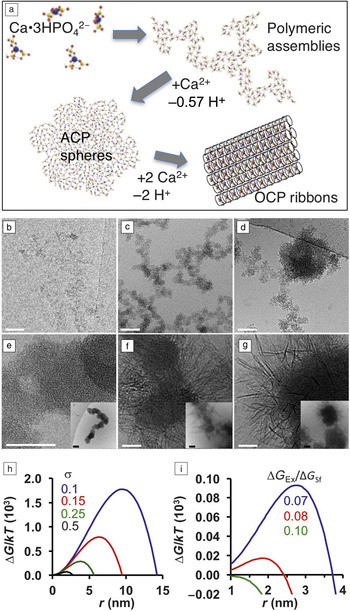
The precipitation of calcium phosphate illustrates the importance of microscopic states and chemical transformations in nucleation pathways (Figure 1a[ii]), as well as precritical cluster aggregation (Figure 1a[iv]). Reference Habraken, Tao, Brylka, Friedrich, Schenk, Verch, Bomans, Frederik, Laven, van der Schoot, Aichmayer, de With and De Yoreo6 Calcium phosphate in the form of hydroxyapatite (Ca10(PO4)6(OH)2; HA) constitutes the mineral phase of bones and teeth in mammals and other vertebrates. Reference Weiner, Traub and Wagner10 Cryogenic transmission electron microscopy (cryo-TEM) and chemical analyses show that, under typical synthesis conditions, HA formation begins with the appearance of amorphous calcium phosphate (ACP), which then transforms to octacalcium phosphate (Ca8H2(PO4)6 • 5H2O; OCP) and then to HA ( Figure 2 ). Reference Habraken, Tao, Brylka, Friedrich, Schenk, Verch, Bomans, Frederik, Laven, van der Schoot, Aichmayer, de With and De Yoreo6 Moreover, the initial units responsible for nucleation are calcium triphosphate ion complexes (Ca(HPO4)3)4–, which are a minority species accounting for only 7% of the Ca species. Thus, they are clear examples of microscopic states residing in a local free-energy minimum. They aggregate into polymeric structures and take up an extra calcium ion to form the initial ACP phase. This calcium triphosphate complex also forms the basis of the final crystal structure of both OCP and HA. In situ atomic force microscopy (AFM) experiments show that ACP nucleation is observed at much lower σ than expected based on the predicted barrier (Equation 1), but including the excess free energy of clusters dramatically reduces the predicted barrier, providing a rationale for the observed pathway (Figure 2h–i). Reference Habraken, Tao, Brylka, Friedrich, Schenk, Verch, Bomans, Frederik, Laven, van der Schoot, Aichmayer, de With and De Yoreo6
(a) Mechanism of octacalcium phosphate (OCP) nucleation. Calcium triphosphate ion complexes aggregate to form branched polymeric assemblies. Nucleation of amorphous calcium phosphate (ACP) occurs via binding of additional Ca2+ and subsequent aggregation. OCP (and later apatite) form through further uptake of Ca2+ ions. (b–g) Cryo-transmission electron microscope images showing the transformations illustrated in (a). (b) Polymeric strands from nanometer-sized units (<2 min), (c) branched polymeric assemblies (2–20 min), (d) ACP nodules (10–20 min), (e) aggregated ACP spheres (15–60 min) where the inset shows a lower resolution view, (f) aggregated spheres + OCP ribbons (60–80 min) where the inset shows lower resolution view, (g) OCP ribbons (80–110 min) where the inset shows lower resolution view. Transformation to hydroxyapatite not shown. Scale bars = main panels: 50 nm; insets: 100 nm. (h–i) Classical nucleation theory predictions of free-energy (∆G) (here expressed in units of kT where k is the Boltzmann constant and T is the temperature) versus nucleus radius (r), for ACP nucleation by (h) assembly of free ions for a range of supersaturations (σ), and (i) aggregation of metastable 1 nm clusters (σ = 0.1) for a range of ratios between the cluster excess free energy (∆G Ex) and the bulk surface energy (∆G Sf) for 1 nm ACP spheres. Due to the excess free energy of the clusters, the barrier for nucleation from cluster aggregation is dramatically reduced, approaching zero for ∆G Ex /∆G Sf approaching 0.1. Adapted with permission from Reference Reference Habraken, Tao, Brylka, Friedrich, Schenk, Verch, Bomans, Frederik, Laven, van der Schoot, Aichmayer, de With and De Yoreo6. © 2013 Macmillan Publishers Ltd.

Systems with multiple polymorphs
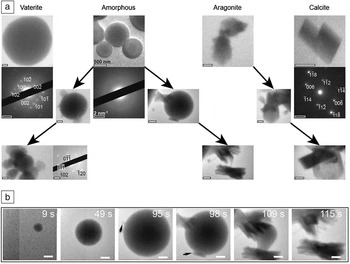
Calcium carbonate (CaCO3), which comprises the shells and other skeletal structures of many marine organisms and forms vast geologic deposits, Reference Dove, De Yoreo and Weiner11 illustrates the role of polymorphs in nucleation pathways. The three polymorphs, vaterite, aragonite, and the most stable phase calcite, as well as hydrated amorphous calcium carbonate (ACC), will form under laboratory conditions, with the dominant phase depending on many factors. ACC often appears first and, in pure solutions, calcite eventually replaces all other phases. Reference Hu, Nielsen, Freeman, Hamm, Tao, Lee, Han, Becker, Harding, Dove and De Yoreo12 In situ liquid-phase TEM experiments show that, for a wide range of conditions, all phases can form directly ( Figure 3a)—sometimes simultaneously—with crystalline phases generally replacing ACC through separate nucleation events followed by ACC dissolution. Reference Nielsen, Aloni and De Yoreo9 However, initial phases can also transform directly into more stable phases (Figure 3a–b).
(a) Liquid-phase transmission electron microscope images showing direct pathways yielding amorphous calcium carbonate (ACC), vaterite, aragonite, and calcite with no observed precursor, while multistep pathways incorporate ACC particles as precursors to vaterite or aragonite, and aragonite as a precursor to calcite. Scale bars = 500 nm and 2 nm–1 for images and diffraction data, respectively. Reprinted with permission from Reference Reference Nielsen, Aloni and De Yoreo9. © 2014 AAAS. (b) Multistep formation of aragonite from ACC. ACC particle forms and grows until aragonite nuclei (black arrows) form on or near the surface and grow at the expense of the amorphous precursor. Scale bars = 500 nm and times listed are relative to the beginning of the image series. Adapted with permission from Reference Reference Nielsen, Aloni and De Yoreo9. © 2014 AAAS.

The reason for this behavior is that, due to the high value of α, the classical barrier to forming the crystalline phases is quite large—over 100 kT for calcite—at solution concentrations below the solubility limit of ACC. Reference Hu, Nielsen, Freeman, Hamm, Tao, Lee, Han, Becker, Harding, Dove and De Yoreo12 Consequently, in order to precipitate CaCO3 on a laboratory time scale, large supersaturations are required, rendering the pathway to all phases accessible. The observation that initial phases can either directly transform to other more stable phases or be replaced through dissolution following nucleation of the more stable phase highlights the myriad of hierarchical pathways that then lead to the final state.
Kinetic traps
The CaCO3 system also provides a good example of kinetic constraints leaving the system in a nonequilibrium state. Many marine organisms use highly acidic protein matrices Reference Addadi and Weiner13 and negatively charged polymeric substances such as polysaccharides Reference Addadi, Moradian, Shay, Maroudas and Weiner14 in the production of intricate calcium carbonate biominerals. A number of these organisms have also been shown to produce ACC as the starting material for their construction. Reference Weiner, Sagi and Addadi15
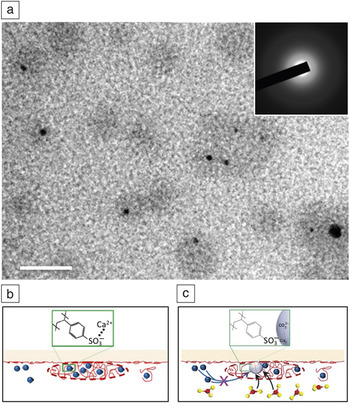
Using poly(styrene sulfonate) (PSS), which has many negatively charged sulfate groups, as a surrogate for the biopolymers, in situ TEM was used to investigate their effect on CaCO3 nucleation ( Figure 4 ). Reference Smeets, Cho, Kempen, Sommerdijk and De Yoreo16 In the absence of PSS, the experimental conditions lead to initial vaterite formation. However, when the Ca buffer is mixed with a PSS solution, the complexation of Ca2+ with the sulfate groups causes counterion condensation to form Ca-PSS globules, which contain more than one-half of all the dissolved Ca. Upon subsequent introduction of carbonate, nucleation occurs exclusively within the globules. The phase that forms is amorphous and, unlike the PSS-free experiments, the ACC phase resists transformation to crystalline phases throughout the course of the experiments. Comparison of the ACC and vaterite formation rates shows that, despite the preference for ACC formation in its presence, PSS actually inhibits nucleation, forcing the system to reach higher supersaturation to form ACC than is needed to form vaterite in PSS-free solution. Reference Smeets, Cho, Kempen, Sommerdijk and De Yoreo16 However, it also inhibits the transformation to the crystalline phase, preventing the dehydration and atomic rearrangements needed to escape the nonequilibrium state.
(a) Liquid phase-transmission electron microscope image showing nucleation of amorphous calcium carbonate (ACC) (black) within globules (gray) formed through Ca2+ counterion condensation of poly(styrene sulfonate) (PSS). Inset: diffraction pattern demonstrating precipitates are amorphous. Scale bar = 50 nm. (b–c) Schematics illustrating (b) globule formation and (c) amorphous calcium phosphate nucleation. Note: blue spheres, Ca2+; red string-like objects, PSS; red and yellow ball-and-stick models, CO3 2–; light gray spheres, ACC. Adapted with permission from Reference Reference Smeets, Cho, Kempen, Sommerdijk and De Yoreo16. © 2015 Macmillan Publishers Ltd.

The importance of conformational flexibility in macromolecular systems
Nucleation of ordered structures also occurs in macromolecular systems, both synthetic and biological. Proteins, which carry out the majority of cellular functions, assemble into a range of structural motifs, including particles, ribbons, fibers, and sheets. Reference Mann17 Within these structures, proteins commonly form oligomeric units in which their conformation can differ significantly from that of the monomeric state, which may well be disordered. The conformational changes that are needed to bring these proteins into the ordered structures introduce a second order parameter into the process of nucleation. Density fluctuations are no longer sufficient; the system also has to find the proper conformation. Crystallization of S-layer proteins, which form two-dimensional (2D) crystalline sheets comprising the outermost cell envelope of many bacteria and archaea, Reference Sleytr, Messner, Pum and Sara18 illustrate the impact of this conformational flexibility on nucleation.
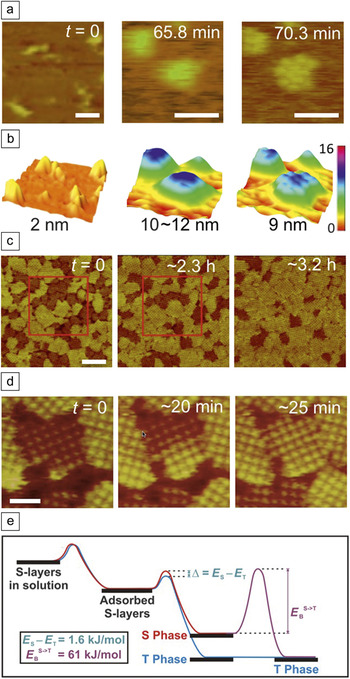
In situ AFM studies show that nucleation of S-layers from Lysinibacillus sphaericus on supported lipid bilayers (SLBs) begins with adsorption of monomers of extended conformation that form a mobile phase ( Figure 5a–b). Reference Chung, Shin, Bertozzi and De Yoreo19 The proteins condense into amorphous clusters, which then undergo a phase transition into 2D crystalline clusters of 2–15 folded tetramers. Growth of the ordered clusters proceeds by new tetramer formation from monomers exclusively at lattice sites along the cluster edges, suggesting that folding into the tetrameric form is catalyzed by the ordered clusters (Figure 5a–b). This conclusion is reinforced by analysis of cluster growth, which gives a barrier to the addition of a folded tetramer that is a factor of two smaller than the estimated barrier to folding of an isolated monomer.
(a–b) Sequential in situ atomic force microscopy (AFM) (a) height images and (b) surface plots showing S-layer (bright yellow to yellow-green) adsorption on a supported lipid bilayer (SLB; dark orange to brown) (time t = 0), followed by condensation into microscopic amorphous S-layer clusters (65.8 min) and transformation to crystalline state (70.3 min) where the color scale in nanometers is the same for all images. (c–d) Sequential in situ AFM height images of S-layers assembled on mica showing the two types of domains, as well as transformation from short to tall domains, where (c) shows evolution in distribution of domains and (d) shows transformation of a single domain. Areas in red boxes illustrate coalescence of some smaller domains into larger ones. Time after first image is as indicated. (e) Proposed energy diagram of S-layer assembly from the monomer in solution to the crystal on mica. Energy barriers E T and E S to formation of the tall (T) and short (S) phases, respectively, only differ by 1.6 kJ/mol; however, the energy barrier to transformation from short to tall (E B S–>T) is approximately 38× larger. Scale bars: (a) 50 nm; (c) 200 nm; (d) 50 nm. (a) Adapted with permission from Reference Reference Chung, Shin, Bertozzi and De Yoreo19. © 2010 National Academy of Sciences. (c–d) Adapted with permission from Reference Reference Shin, Chung, Sanii, Comolli, Bertozzi and De Yoreo20. © 2012 National Academy of Sciences. (e) Reprinted with permission from Reference Reference Shin, Chung, Sanii, Comolli, Bertozzi and De Yoreo20. © 2012 National Academy of Sciences.

When assembly occurs on mica, two distinct S-layer phases appear. Reference Shin, Chung, Sanii, Comolli, Bertozzi and De Yoreo20 Both have the same unit-cell symmetry and lattice spacing but differ in height by 2–3 nm (Figure 5c–d). The relative coverage of the two phases depends on temperature, and the domains of the shorter phase spontaneously transform into domains of the taller, more stable phase through a conformational change to a more ordered state (Figure 5c–d). The results both on SLBs and mica show that kinetic constraints imposed by conformational traps and the barriers that hinder transformation into the stable forms lead to complex multistage pathways of nucleation (Figure 5e).
Moving toward a predictive model of nucleation
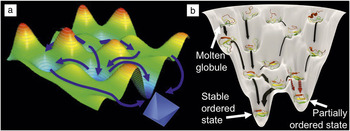
The previously mentioned examples highlight the challenges to achieving a predictive model of nucleation. The complexities of the energy landscape for small clusters open many pathways for a system to follow in nucleating a new phase. Predicting which one will be followed requires knowledge of those complexities ( Figure 6a). Reference De Yoreo, Gilbert, Sommerdijk, Penn, Whitelam, Joester, Zhang, Rimer, Navrotsky, Banfield, Wallace, Michel, Meldrum, Cölfen and Dove3,Reference De Yoreo, Chung and Friddle21 If the distribution of cluster sizes and configurations could be determined, one would at least be able to describe the minima in the landscape. Similarly, if the dynamics of the transformations from one size and configuration to another were available, one could define the barriers in the landscape. However, experimentally determined details about cluster distributions and dynamics are largely unknown, even for simple systems.
(a) Schematic illustrating complex free-energy landscapes with many local minima and maxima (arbitrary color scale) and myriad of pathways (blue arrows) leading to crystal nucleation. (b) Protein folding funnel showing unfolded, molten globule, partially ordered state, and stable ordered state with pathways (black and red arrows) leading from unfolded to ordered protein structures, where gray string-like elements represent unstructured regions of the protein and red, yellow, and green strips represent structured domains of the protein. Barriers to forming partially ordered and stable ordered states from molten globules are small, but the barrier to transformation from partially ordered to stable ordered states are large. (b) Reprinted with permission from Reference Reference De Yoreo, Chung and Friddle21. © 2013 Wiley.

Unfortunately, experimental tools that can deliver this information have been largely lacking to date. Scattering techniques that average over an ensemble of species offer little hope of divining the details of cluster distributions. Advances in in situ imaging, both TEM Reference De Yoreo and Sommerdijk22,Reference Ross23 and AFM, Reference Fukuma and Jarvis24,Reference Ricci, Spijker and Voitchovsky25 are beginning to make headway, but the time and length scales of cluster dynamics remain formidable obstacles to applying these techniques, particularly in the crucial prenucleation stage. Computational approaches have made great progress in tackling this challenge in recent years, Reference Demichelis, Raiteri, Gale, Quigley and Gebauer7,Reference Li, Donadio and Galli26 but only for simple systems. As these approaches become more robust and reach system sizes and length scales that overlap those of experiments, a predictive knowledge of cluster dynamics may finally be realized.
When the constituents of the nucleus are macromolecular, the high degree of conformational entropy imposes an added challenge to predictions of both pathway and outcome, because the unassembled molecules can transition from high entropy configurations to final stable states by passing through molten globular or poorly ordered states that act as transient kinetic traps (Figure 6b). Reference De Yoreo, Chung and Friddle21 The conformational transformations needed to create the final ordered state must be incorporated into models of nucleation, for they both enable and are enabled by the emergence of the ordered state.
The challenge to predicting nucleation pathways and rates becomes even more daunting when nucleation is accompanied by chemical transformations from one composition to another. This occurs, for example, in the case of calcium phosphates, or when the emerging phase consists of a complex lattice such as that of a zeolite, where many structures are possible. For these systems, the dynamics of cluster formation and reconfiguration are convoluted with the kinetics of chemical transformation. Understanding what factors select for speciation pathways and how a system chooses amongst the myriad of available structural states is not only a requirement for predictive models, but more importantly, it also represents an opportunity for advances in materials technologies. With that understanding, it should become possible to predict and manipulate the transient structures and intermediate phases that only occur during nucleation, thereby enabling the discovery and isolation of new states of matter.
Acknowledgments
This work was supported by the US Department of Energy (DOE), Office of Basic Energy Sciences, Division of Materials Science and Engineering at Pacific Northwest National Laboratory (PNNL). PNNL is a multiprogram national laboratory operated for DOE by Battelle under Contract No. DE-AC05–76RL01830.

Jim De Yoreo is chief scientist for materials science at Pacific Northwest National Laboratory (PNNL) and affiliate professor of materials science and engineering at the University of Washington. He received his BS degree in physics from Colby College in 1978, and his PhD degree in physics from Cornell University in 1985. He held numerous positions at Lawrence Livermore National Laboratory and Lawrence Berkeley National Laboratory before moving to PNNL in 2012. His current research focuses on in situ investigations of molecular interactions, self-assembly, and crystallization. He is a Fellow of MRS and the American Physical Society, has served on the Board of Directors and as president of the MRS, and is currently an executive committee member of the International Organization for Crystal Growth and the American Association for Crystal Growth (AACG). He is a recipient of the David Turnbull Lectureship, the Laudise Prize, and the AACG Crystal Growth Award. De Yoreo can be reached by phone at 509-375-6494 or by email at james.deyoreo@pnnl.gov.