In 2007–2009 a major drought—the worst in forty years—struck Syria. From 1990 to 2010, Syria’s population had risen by more than 70%, from 12.4 million to 21.4 million; half the population was under twenty-one years old (United Nations 2019).
The drought directly affected over a million people. In “the 2007/2008 agriculture season, nearly 75 percent of these households suffered total crop failure” (Erian, Katlan, and Babah Reference Erian, Katlan and Babah2010, 15; Eklund and Thompson Reference Eklund and Thompson2017). Hundreds of thousands left their lands and moved to the cities of Aleppo, Hama and Damascus. Syria was already suffering from widespread discontent over political exclusion and corruption; these refugees added to the weight of urban misery and anger with the regime. Two years later, when rebellion broke out in southern Syria, the revolt quickly spread to these northern cities and precipitated civil war. The war then created millions more refugees, who spread to Lebanon, Jordan, and Turkey, and then to Europe, where a sudden surge of over one million refugees sought asylum in 2015 (Pew Research Center 2016).
As Europe itself was already economically weakened and politically divided over issues stemming from the Great Recession of 2008–2009, the expansion and deepening integration of the European Union, and reactions to Islamist terrorism, European countries had great difficulties responding to this sudden surge of immigration. Heightened popular anxieties about the flood of immigrants then brought further turmoil to the European Union, through the vote for British exit, conflicts over immigration and asylum policy, and the growth of nationalist and anti-immigration parties. Fears of uncontrolled immigration provided opportunities for nationalist leaders to weaken democratic institutions in the name of building stronger states to defend the integrity of their nations (Diez Reference Diez2019).
A few years later, in 2014–2018, an unusually severe drought hit Guatemala and Honduras. These countries have the youngest and fastest growing populations in all of the Americas, growing by almost 2% per year, twice as fast as Latin America as a whole. Their median ages are just 21 and 22 years, compared to 29 for the region (United Nations 2019). By 2018, “towards the end of yet another ‘rainy season’ that brought no rain, many rural communities [were] trapped in a dizzying vortex of catastrophe. Years of erratic weather, failed harvests, and a chronic lack of employment opportunities [had] slowly chipped away at the strategies Guatemalan families … used successfully to cope with one or two years of successive droughts and crop failures. But now, entire villages seem to be collapsing from the inside out.” (Steffens Reference Steffens2018).
Because their countries’ poor governance provided too few jobs and enormous risks of violence, those displaced were unable to find safe harbor within their own country. They therefore headed north to seek asylum. The sudden spike in asylum seekers at the U.S. southern border in 2018 and 2019—a 2,000% increase from ten years earlier (Rhodan Reference Rhodan2018)—overwhelmed the unprepared border services. The chaos at the border spurred President Trump to declare an emergency, empowering himself to direct funds to build a wall to keep out immigrants.
In sum, rapid population growth, climate change, and poor governance—even in small and distant countries—constitute a toxic brew that can have significant downstream effects on the politics of rich democracies. We discuss policy responses to address this issue and arrive at a surprising finding: Better governance in the developing countries may be critical to the future of democracy in the richer ones.
Two Demographic Challenges
The world is facing two major demographic challenges. First, in East Asia, Europe, and North America the population booms after World War II gave way to fertility levels that sank well below replacement levels after 1980, while life expectancies rose. As a result, these regions will all soon have exceptionally aged populations. Supporting the rapidly growing number of seniors will be shrinking labor forces that are saddled with stagnant productivity growth.
Second, while most developing countries have experienced declining fertility and a marked slowing of population growth, much of Africa and a handful of countries in Central America, the Middle East, and South and Southeast Asia have maintained exceptionally high fertility, even as their mortality has sharply declined. The result in these countries is exceptionally young and fast-growing populations, which will soon produce almost all of the net increase in the global labor force. Educating and fruitfully employing these youth will fall to countries that have generally suffered from poor governance, uneven economic development and recurring violent conflicts.
These transformations have potential for both good effects and ill. If managed with foresight and flexibility, both the developed democracies and developing nations can seize opportunities to grow their economies in ways that make them more diverse, dynamic, and resilient. Managed poorly, they could produce growing support for nativist, illiberal, anti-immigrant populist parties and politicians, presenting formidable challenges to liberal democracy in the rich world, while triggering recurrent crises and spasms of violent unrest in the developing regions.
The Challenge in the Developed Nations: Aging Populations and Shrinking Workforces Footnote 1
For most of their late-twentieth-century economic boom, the OECD economies were propelled by strong population growth. From the 1950s onwards, Japan, South Korea, most of Europe, and the United States all had growth rates of over 1% per year.
Yet from the 1980s, driven mainly by women’s greater opportunities in education and the workforce, fertility fell sharply, and population growth halted. In Japan, growth fell to 0.2% per year by 1995, and turned negative by 2010. In Europe, growth ended around 1990; by 2010 eighteen countries had declining populations, including Poland, Italy, Spain and Russia. South Korea’s growth rate is now under 0.2%. The United States retains a higher growth rate, at 0.62%, but roughly half of that is due to immigration.
But these declining population growth rates are just the beginning. Low fertility will have even greater effects in the coming decades, especially on the working-age population. From 2020 to 2060 Japan’s prime working age population (age 15–59) is projected to fall from 67 million to 43 million; that of South Korea will fall from 33 million to 18 million. In Europe (including Russia), the prime working age population will decline from 436 million to 347 million, a loss of 89 million. That includes a decline in Germany from 48 million to 38 million; in Italy from 35 million to 23 million; in Poland from 22 million to 15 million; and in Hungary from 5.7 million to 4 million.
The United States’ prime working age population is projected to grow from 2020 to 2060, but only slightly: from 194 million to 211 million. That projection assumes continued strong immigration: Pew Research Center (2017a) calculated that the native-born population aged 24–64 would decline by 8.1 million by 2035. In fact, the decline will likely be greater, as this projection does not take account of the startling fall in U.S. fertility to record new lows in 2018, a 2% decline from the prior year. Total fertility in the United States is now well below replacement, at 1.73 children per woman (U.S. Department of Health and Human Services 2019). Without continued strong immigration, the U.S. prime working age population would likely fall by tens of millions by 2060.
To be sure, in the long run lower fertility—even below replacement—may create benefits in rich societies. Less investment is needed in educating children or equipping new workers, and declining population relative to capital stocks may boost productivity and consumption (Lee and Mason Reference Lee and Mason2014). Population decline in rich nations will also help reduce their environmental impact (O’Neill et al. Reference O’Neil, Dalton, Fuchs, Jiang, Pachauri and Zigova2010; Weber and Sciubba 2018). Moreover, the increase in life expectancy that is being sustained in most countries is surely something to celebrate.
However, in the next few decades the rich countries will be going through a difficult transition, dealing with the consequences of the shift from high fertility before 1980 to much lower fertility afterwards. It is this transition that is problematic.
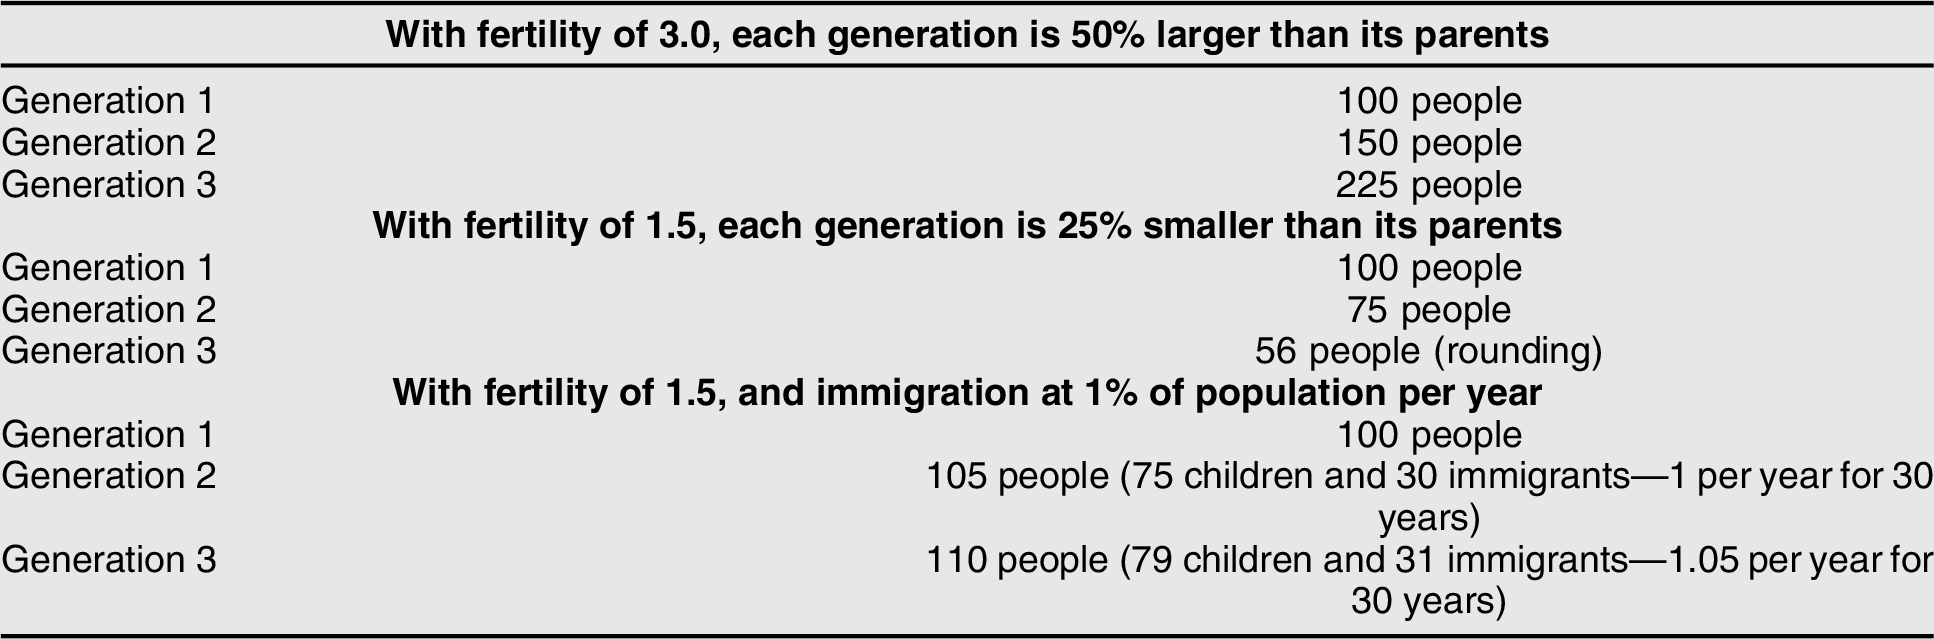
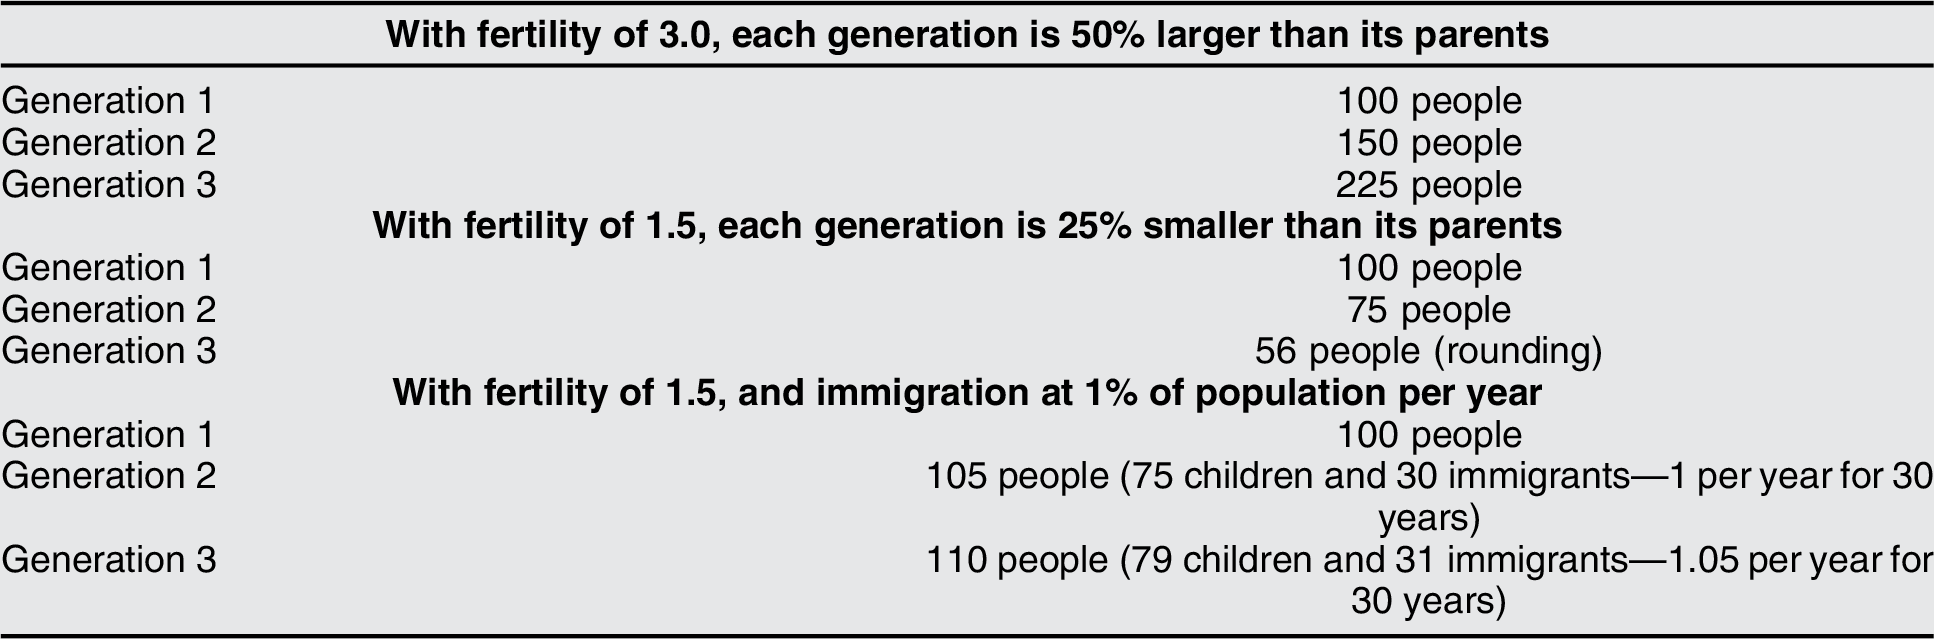
Table 1 shows in simple terms what happens when fertility drops from three children per family—approximately the level in rich countries during the post-World War II boom—to 1.5, approximately the level today in much of East Asia, southern and eastern Europe, and for the U.S. native-born. In the earlier high-fertility regime, each generation is 50% larger than their parents’ generation, and 2.25 times as large as their grandparents’ generation. By contrast, in the lower-fertility regime, after two full generations at the lower-fertility level, the younger cohort is just over one-half as large as that of their grandparents. If one considers Generations 2 and 3 as the workers to support generation 1, in the high-fertility regime the ratio of workers to aged dependents is 3.75 workers to 1. But in the low-fertility regime this changes drastically, such that it becomes only 1.31 workers for each senior. That means, barring increases in productivity, that taxes either have to be nearly three times as high to provide the same retirement benefits as before, or benefits have to be cut by two-thirds to maintain the same tax level as before. Either way, the change in ratios among generations requires a drastic fiscal restructuring.
Relative size of generations, high-fertility versus low-fertility regimes, with and without immigration
A more rigorous study of life-cycle spending and taxation yields similar results. Mason et al. (2015, 16-18) find that in low-fertility advanced nations, between 2015 and 2035, “changes in population age structure would lead to both substantially higher tax revenues and public transfer inflows as a share of GDP.” As examples, they note that in Germany, the rise in taxes or decline in benefits would be 8% of GDP; in Japan 6.3%, and in Hungary and the U.S. over 4%. “The fiscal pressure is very severe in countries … which have very low fertility, are experiencing rapid aging, and [have] generous public support … for the elderly.”
Immigration can help. Going back to our simple example, if we allow immigration of 1% per year (which is somewhat high, but about the current level in Canada, Switzerland, Germany, and Austria, or in the United States in the late 1990s), then even with fertility of just 1.5, the population will grow slightly. More important, the ratio of working cohorts to elderly dependents will increase by more than half, to 2.15 to 1. This means that retirement benefits can either be maintained by just a 75% increase in taxes or a 43% cut in benefits. These are still large adjustments, but nothing like the drastic changes that would be needed (hiking taxes by a factor of three or cutting benefits two-thirds) without immigration. In fact, a third adjustment—raising the retirement age—is highly likely to be made in order to moderate the other two. Without substantial immigration in the next two decades, however, it is difficult to see how the fiscal situation confronting advanced democracies can remain economically manageable.
In the long run, such high rates of immigration would not need to be sustained, nor would they be desirable, for eventually the immigrants will age as well. Thus, much immigration could be circular, with aging migrants returning to retire in their home countries, where the cost of living is much lower. Such a pattern has already developed naturally for migration from Mexico to the United States, where once-high rates of immigration have turned negative, with more Mexicans now returning home each year than entering the United States (Gonzalez-Barrera Reference Gonzalez-Barrera2015). Still, for the next several decades high rates of immigration will be crucial to help developed nations cope with the imbalance between the very large baby-boom cohorts requiring support until they pass away, and the working-age population that is currently in sharp decline, until both segments of the population stabilize.
The pending imbalances are stark. In Japan in 2050 roughly twice as many people will be over 70 (31% of the population) as will be under 20 (15.6%). In Germany, over one-third of the population will be aged 60 and over by just 2030. In the United States, by 2035 the population over age 65 will outnumber the population under age 18 for the first time in history. Even with continued strong immigration, as baby boomers age, the ratio of working age adults to those over 65 in the United States. is projected to fall from 3.5 in 2020 to 2.5 by 2060 (U.S. Census Bureau 2018). Similarly, in France, despite maintaining one of the highest fertility rates in Europe, the ratio of working-age adults to those over 65 will fall from 3.3 in 2016 to 2.2 by 2050 (European Commission 2017, 193).
We have no precedent in human history for these drastic shifts in a society’s age structure. We thus have no policies by which a shrinking working-age population provides for the health and support of a much faster growing number of seniors. Institutions for supporting seniors generally lag well behind these changes. For example, in the United States the date by which Medicare’s Hospital trust fund exhausts its reserves and must raise taxes or cut benefits is just six years away, in 2026 (Pear Reference Pear2018). Both the East Asian model, in which children are expected to provide care and support for their aging parents, and the Western model, in which retirees expect to be supported by some combination of private and government pensions and savings, are breaking down under these demographic changes.
Automation, artificial intelligence, and robotics will help nations cope with these sharp declines in the workforce by raising productivity, though not all regions or occupations will gain equally (McKinsey 2019). Moreover, a great variety of jobs—harvesting fruits and vegetables, landscape and building maintenance, driving, commercial and retail services, leisure and entertainment, health care and education—are proving more difficult to automate than expected. The great majority of employment in the advanced economies is in the service sector, where it is far more difficult to boost productivity than in manufacturing. Thus, productivity growth has remained sluggish throughout the developed world and seems likely to remain so (Gordon Reference Gordon2016). The increase in U.S. nonfarm productivity has been below 1.5% for most of the forty-five years since 1973, compared to the 2.8% annual productivity growth during the baby boom era of 1947–1973 (U.S. Bureau of Labor Statistics 2019).
Younger workers are also crucial to raising productivity. Even in cognitive skill jobs, workers’ productivity usually increases steadily from their twenties to their forties, then levels off (Skirbekk Reference Skirbekk2008). While older workers can certainly remain fully productive into their sixties with proper support, it is rare for workers to markedly increase their productivity once they leave their forties. If society has a majority of workers over age forty-five, it is hard to raise productivity at a rapid pace. Yet for most of today’s rich countries, a younger work force in the next few decades will be unattainable without immigration.
Nonetheless, many people and politicians in the OECD countries argue that they already have too many immigrants, rather than too few. Opponents of immigration are prone to greatly overestimate the number of immigrants in their country (Raposo Reference Rapsoso2018; Wilkinson Reference Wilkinson2017). Their fears are exacerbated by surges of immigrants, particularly asylum seekers, which convey a sense of chaos and loss of control at the border (Nowrasteh Reference Nowrasteh2018). Yet conditions in fast-growing developing countries, if not improved, will make such surges more frequent.
The Challenge in the High-Fertility Developing World: Explosive Growth
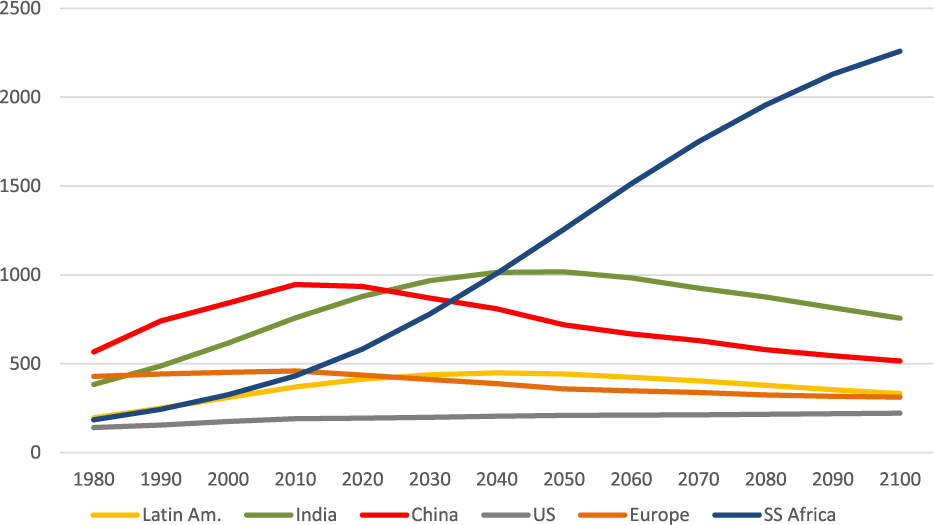
In a few regions populations are still growing very rapidly. Figure 1 shows the number of people of prime working age in the major regions of the world through the end of this century. Most regions, including China, already have working-age populations that are stagnant or in decline. India’s prime working age population will continue to grow until 2040, but at a slow and diminishing rate of increase. By contrast, Africa will have extremely rapid growth in its prime working-age population, and that growth will likely accelerate up to 2050, slowing only in the last decades of this century.
Growth in the prime working-age population (15–59) to 2100, various regions (in 000s)
Source: United Nations 2019
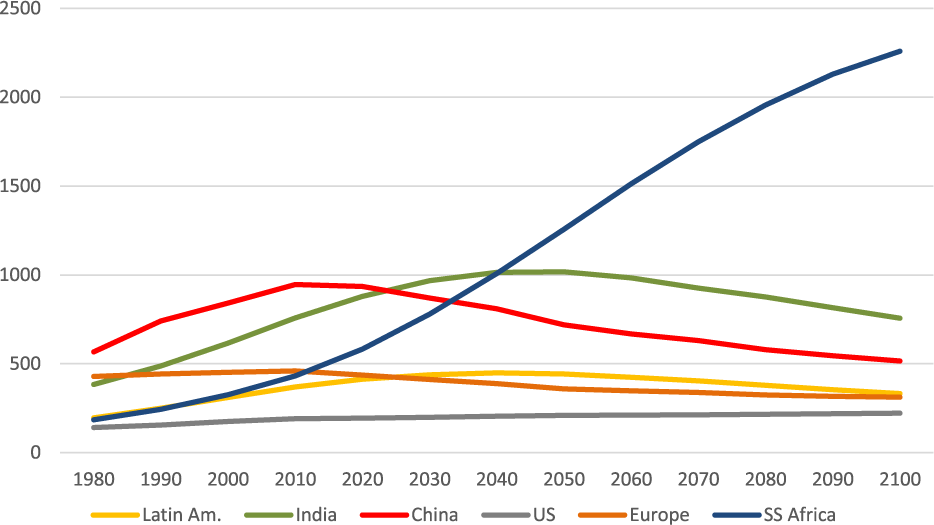
The numbers are startling. From now to 2060—a period when the native-born working-age populations in Europe and the United States will decline by tens of millions—the countries of sub-Saharan Africa will likely add nearly a billion prime-age workers. Their number will nearly triple, growing from 582 million in 2020 to 1.51 billion in 2060. Growth in North Africa, right on Europe’s doorstep, will not be quite as great, but this region’s age 15–59 population is projected to grow by almost 70% to 2060, an increase of 97 million. Pakistan’s prime working-age population is forecast to grow by 98 million people to 2060, Iraq’s by 26 million, Afghanistan’s by 25 million, the Philippines’s by 23 million, Yemen’s by 17 million, and Syria’s by 9 million. Guatemala and Honduras are expected to see their prime working-age population increase by 9 million in these decades—more than Mexico.
There will be 1.2 billion new workers aged 15–59 who will enter the workforce by 2060 in the above emerging economies. How many will find safety, work, and secure futures in their home countries? And how many will be driven elsewhere in search of employment and safety?
Much depends on whether governments in these countries can manage to avoid civil violence while summoning resilience in the face of climate-related stress (Mach et al. Reference Mach, Kraan, Neil Adger, Buhaug, Burke, Fearon, Field, Hendrix, Maystadt, O’Loughlin, Roessler, Scheffran, Schultz and von Uexkull2019). Countries with rapidly growing and very youthful populations tend to have a higher incidence of civil violence (Urdal Reference Urdal2006). Accelerating climate change will bring more severe droughts, cyclones, and floods. The ability to provide food and shelter in response to such crises is critical to keeping people in place. In 1999, Hurricane Mitch cut a swath through Honduras that displaced over one million people and destroyed much of that country’s infrastructure. Over 50,000 Hondurans then emigrated to the United States (Voice of America 2017). A natural disaster that affected 10 million people—quite plausible as sub-Saharan Africa’s population grows to 2 billion people by 2050—could produce half a million climate refugees.
Yet as we have seen in Syria, Guatemala, Afghanistan, and Sudan, it is war and civil violence that is truly the “Great Displacer.” In 2017, the United Nations Refugee Agency counted 16.2 million newly displaced people driven from their countries, the biggest increase the UN had seen in a single year (Edwards Reference Edwards2018). Climate stress may contribute to the emigration of thousands of people, but it is the loss of safety from other people, or their own government, that drives millions to leave their country.
Rich countries will likely have a need for tens of millions of additional workers in the next several decades, while the fast-growing developing countries will have tens of millions of additional young people looking for education and productive jobs. Can this global demographic divergence be turned into a win-win solution? Doing so will require the rich countries to find ways to welcome and absorb immigrants, creating an orderly, rule-governed process that builds trust and support for immigration. It will also require developing countries to acquire the resilience and state capacity to manage fast-growing populations and to respond to climate change without falling into civil wars or ecological catastrophes that send surges of desperate refugees to the borders of the rich world.
If the right policies to achieve these goals are not implemented, both the developed and developing nations seem destined for a lose-lose world. The richer countries, fearing immigration and assaulted by unpredictable and chaotic surges of refugees from the burgeoning populations of the south, would seek to discourage immigration, and would be stuck with slowing economies and overwhelming fiscal stress. The resulting high levels of fear and anxiety could erode democratic checks and balances and undermine faith in democratic institutions. The high-fertility developing nations, if unable to educate and employ their fast-growing and youthful populations, would face increasing risks of violence and civil war, exacerbated by periodic droughts and floods that would further strain governments and increase disorder.
We will turn to policies to respond to these dual challenges later. First, however, let us examine global trends in governance.
Global Trends in Democracy and Governance: An Age of Anxieties
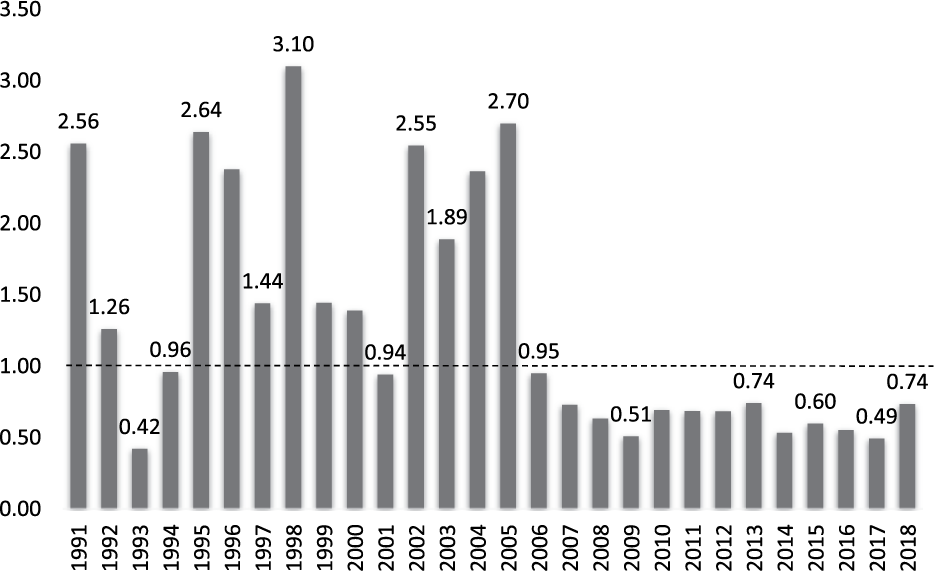
The last dozen years have seen a marked democratic recession. As shown in figure 2, in this period Freedom House (2019) has recorded many more countries declining in freedom than gaining, reversing the pattern of the first fifteen post-Cold War years, 1991–2006. The pace of democratic breakdowns in the last decade has also been rising, returning to the 15% failure rate last seen a generation ago, in 1975–1984 (Diamond Reference Diamond2019).
Annual ratio of gains to declines in Freedom House “Freedom” scores, 1991–2018
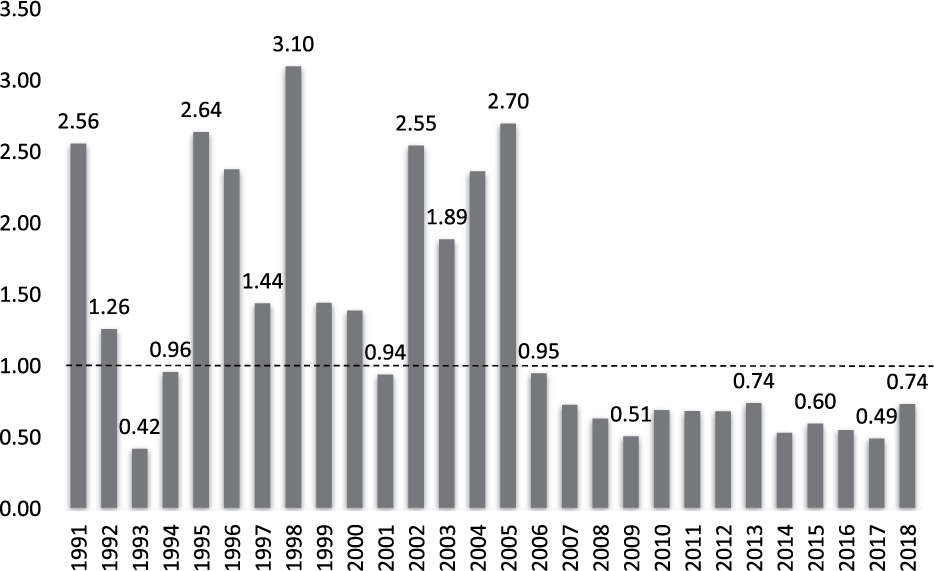
These failures have occurred mainly (though not entirely) in poorer countries, many of them in Africa. In fact, sub-Saharan Africa has seen a steady decline in key Freedom House indicators since the global democratic recession began around 2006, with the measure of Transparency and Rule of Law falling the most dramatically—by about 20% on average. Governance is thus deteriorating in Africa at precisely the moment when the region most urgently needs dramatic improvements to cope with coming demographic challenges. A downward trend in quality of governance is also visible in the Middle East and North Africa since 2005, though here Transparency and Rule of Law has been consistently abysmal, and it is recent declines in Political Rights and Civil Liberties that have been most evident.
Demographically speaking, this negative trend in democracy is odd. Recent research has shown a strong link between population aging and the ability of states to transition to, and maintain, democratic governance. The relationship holds even when controlling for income per capita (Cincotta and Doces Reference Cincotta, Doces, Goldstone, Kaufmann and Duffy Toft2011; Dyson Reference Dyson2012; Weber Reference Weber2013; Wilson and Dyson Reference Wilson and Dyson2017).
Cincotta (Reference Cincotta2016) has shown that if we examine the relationship between median age and Freedom House scores, countries that had a median age of 25 or less in 2017 had only a 25% chance of being rated “free” in 2018. Among countries with median age from 25 to 35, that probability rapidly rises from 25% to 80% as age increases. For those countries with median age 36 and higher, the probability of being “free” rises to over 90%. Moreover, analyses of countries transitioning to democracy and falling out of democracy find that the further along a country is in the demographic transition to low fertility and slower population growth, the higher the odds of becoming a democracy and the lower the odds of democratic decline (Cincotta and Doces Reference Cincotta, Doces, Goldstone, Kaufmann and Duffy Toft2011; Wilson and Dyson Reference Wilson and Dyson2017).
The link between the demographic transition and democracy has struck many as puzzling.Footnote 2 Yet it is quite logical, if, following Welzel and Inglehart (Reference Welzel and Inglehart2008), we treat democracy as requiring personal autonomy. When people do not trust the government or impersonal relationships to provide such essentials as physical safety; insurance in times of disaster; information and access to jobs, credit, and access to potential mates, they will rely on patrons and extended family or identity groups. Under these conditions, there are both individual incentives and social pressures to have larger families. Politics will then not be a meaningful contest for individual votes, but a power struggle among identity groups or patronage networks. Such contests usually end in either illiberal democracy or violence between groups that leads to rebellion or coups (Khan Reference Khan2005).
Conversely, when people come to trust that government will provide fair and reliable services and safety; that local or professional social organizations will provide access to credit, insurance, and social support; and that markets will provide adequate access to jobs, customers, and desired goods, then the incentives to have large families fade away. Such conditions also provide the basis for autonomous voting, strong civil society organizations, and holding government accountable—core conditions for democracy. Surveys have found that if people are able to look ahead confidently and anticipate a longer life span, they are more inclined to actively support democracy (Lechler and Sunde Reference Lechler and Sunde2019). Thus the social conditions that promote lower fertility are also key enablers of democratic governance.
There are marked exceptions to this pattern; a handful of mature countries with high median age remain autocratic: Russia, Belarus, China, Cuba, and Thailand. Yet these exceptions are few and may yet prove unstable. Just as the Arab dictators before 2010 and the Soviet Union before 1989 appeared durable but then suddenly fell, so too the leaders of these autocracies fear being toppled by “color revolutions.” While such mature autocracies can remain stable for long periods, if they should falter the odds are high that the transition will be relatively peaceful and produce a more democratic government. This has been the pattern in most high-median-age autocratic regimes that have transitioned, as in the Baltics, Eastern Europe (including Ukraine), and the Caucasus (Armenia, Georgia).
Where mature societies are becoming less free, conditions are likely anomalous, reflecting a loss of trust in impersonal government and markets, and anxieties that lead citizens to seek safety in the promises of strong leader. Such conditions were widespread in the previous wave of democratic reversals in the 1930s.
Today, following the great recession of 2007–2009 and the long period of austerity policies that followed, with a recovery period almost as long as that of the Great Depression, plus massive waves of migration and anxieties about the spread of Islamist extremism and terrorism, we are again in an “Age of Anxieties.” Even in the most long-standing and powerful democracies, such the United States, the United Kingdom, Germany, France, and Sweden, as well as more recent European democracies (such as Spain, Austria, Poland, and Hungary), we see fears of foreigners, growing hostility towards globalization, intense anxiety about immigration, and distrust of established parties and elites. Significant groups of voters are gravitating to leaders offering to protect the dominant nationality group and culture, even if that leader is willing to disregard constitutional constraints and niceties. As Inglehart and Norris (Reference Inglehart and Norris2017) find in their exhaustive analysis of survey data, voters become more susceptible to the anti-immigrant appeals and “cultural backlash” of illiberal populists when they experience declines in economic status and job security. Even with economic recovery in most Western economies, support for populist and anti-immigration parties persists, in large part due to anxieties over immigration.
The Demography of International Migration: New Sources, Immigration Surges, and Identity Politics
Anxieties about immigration are not new. In the United States, even before independence, concerns were raised about large numbers of Germans entering the new country. Ben Franklin wrote: “Why should Pennsylvania, founded by the English, become a Colony of Aliens, who will shortly be so numerous as to Germanize us instead of our Anglifying them?” Franklin was nonetheless a practical man and realized that America needed immigrants. “I say I am not against the Admission of Germans in general, for they have their Virtues, their industry and frugality is exemplary … and [they] contribute greatly to the improvement of a Country” (quoted in Merelli Reference Merelli2017).
Throughout U.S. history, opposition to immigration has arisen whenever there have been surges in immigration, or in immigrants from new and unfamiliar sources. In the 1860s, California brought workers from China to labor on the railroads and the booming settlements that flowed from the Gold Rush; but this was followed in the 1880s and 1890s by sharp restrictions on immigration from Asia. By the early 1900s, Americans had grown familiar with the northern and mainly Protestant Europeans who settled across the Midwest and plains. But when a surge of Catholic and Orthodox immigrants from Ireland, Italy, Greece, and Eastern Europe came in the late 1800s and early 1900s, this too was followed by new restrictions on immigration, designed to limit the inflow of these new foreigners.
American immigration remained based on quotas that favored western Europeans until 1965. A new and more generous immigration regime, which largely remains intact today and is the object of current anxieties, was adopted following two decades of post-WWII economic growth that raised the living standards of average Americans to the highest level in the world. It was also a period, at the height of the Cold War, when America presented itself as the leader of the free world and as a home for people seeking freedom.
For the next thirty-six years, immigration to the United States became more open. As the volume of immigration rose, there were recurrent concerns that immigrants, particularly those from Mexico, would take jobs from Americans. In fact, immigrants did the jobs that native-born Americans did not want to do, from picking fruit and vegetables to domestic service, or the jobs that not enough native-born Americans were available to do, such as day labor on construction sites in booming suburbs. From 1965 to 2000, America enjoyed both a fairly open immigration regime and the fastest and most sustained economic growth in its history.
Only after September 11, 2001 did a new fear arise about immigrants—that migrants from Muslim countries were coming to carry out violent attacks. As terrorism became a more common weapon in the Middle East, fears spread in both Europe and the United States that people from this region (stretching from North Africa to Pakistan and Afghanistan) would bring terror with them. Though jihadist attacks were rare, fears of immigrants rose with every such attack in Britain, the United States, or continental Europe.
The years after 9/11 coincided with a marked shift in the scope and origins of immigration to the United States. From 1990 to 2010, America’s foreign-born population doubled, from 19.8 million to 39.9 million—the largest and most rapid increase since the Civil War (Tavernese Reference Tavernese2018). This has pushed the percentage of foreign-born in the U.S. population to its highest level since 1910, reaching 13.7% in 2017 (Pew Research Center 2018).
As recently as 1970, three-quarters of the U.S. immigrant population had come from Europe and Canada; but by 2000, a majority came from Mexico and other countries in Latin America and the Caribbean. Moreover, by 2009, for the first time new arrivals from Asian countries outnumbered those from Latin America (Pew Research Center 2018). Cheap air travel, the opening up of China, and increased migration from the Philippines, Pakistan, India, Afghanistan, and other Asian countries, including a flood of students, allowed Asian sources to exceed those to the south.
There has also been a big shift in the source of migrants from Latin America. Immigrants from Mexico used to far surpass those from any other country in the region. But since 2015 net migration from Mexico has been negative (Gonzalez-Barrera Reference Gonzalez-Barrera2015), while migration from Central America has surged to such a degree that in the seven months from October 2018 through April 2019 the number of migrants apprehended at the U.S. border from Guatemala was almost twice as large as the number from Mexico, despite Mexico’s population being more than seven times larger (Sieff Reference Sieff2019; U.S. Customs and Border Protection 2019).
This is the normal outcome of Mexico’s own demographic and economic progress. Since the 1970s, fertility in Mexico has dropped from more than six children per woman to just two. In addition, as Mexico’s own economy has developed, particularly in manufacturing centers near the U.S. border and in commercial agriculture, well-paying jobs are plentiful enough to retain workers. Mexico is thus a vivid example of the demographic transition: as a country achieves economic development, better governance, and lower fertility, its volume of emigrants sharply declines.
Guatemala and Honduras provide the opposite lesson: even small countries can generate large numbers of refugees and emigrants if they have young and fast-growing populations and suffer from poor governance and civil conflict. Table 2 compares the World Bank Governance Index scores of Guatemala, Honduras, and El Salvador with those of Mexico, Costa Rica, and Panama—all countries close to the United States. Guatemala, Honduras, and El Salvador, however, are the only ones sending large numbers of migrants to the United States today, and the reason why is bad governance—all three have governance ratings about half of those of their neighbors who are not major sources of migration to the United States.
Comparisons of governance scores in Mexico and Central America (World Bank Percentiles on Governance scores for 2017)

European nations have also experienced a recent surge in immigration. The expansion of the European Union following the collapse of the Soviet Union brought in many new countries whose populations were drawn to the more prosperous countries of Western Europe. Poles, Czechs, Romanians, and others moved west in large numbers. In addition, the booming populations of former colonies in Africa, the Middle East, and South and Southeast Asia provided a large pool of young people attracted to Western Europe in search of jobs and education.
The result has been a demographic transformation of Europe. In the 1960s, net immigration to the EU-15 countries was essentially zero. In the 1970s, the figure had risen to about 250,000 per year. By the early 1990s, that number had jumped to over 1,000,000 per year, and by the early 2000s to almost 2,000,000 per year. In the course of a generation, the volume of immigration jumped by an order of magnitude. However, most of these immigrants were from other EU countries, as after the 2008 recession workers streamed from the hardest hit to the economically stronger countries. Even for immigrants from outside the EU, the largest sources were other European countries, such as Ukraine, Russia, Belarus, and Serbia. Most immigrants were also well educated; only one in eight non-EU immigrants came from a country with a low human development index (Eurostat 2016).
Contrary to common belief, European countries are not being overwhelmed with Muslim immigrants. Aside from Bulgaria and Bosnia, who have large Muslim populations dating to their days as part of the Ottoman Empire, as of 2016 no major west European country is estimated to have had a Muslim component larger than 8% of the total population. Even with current immigration levels, Muslims are not expected to exceed 20% of the population by 2050 in any West or Central European country and will likely be closer to 10% in most countries (Pew Research Center 2017b).
Nonetheless, the perception that “foreigners”—including other Europeans—are a vastly increased presence in most European countries compared to just a few decades ago is correct. In many countries, fertility has fallen so much that annual immigration exceeds native-born births. Moreover, because immigrants are mainly young, have larger families, and settle in cities, the local impact of immigration can be much greater. In many countries, the population that is foreign-born or born to at least one foreign parent already is 20% of the 15–39 age group, and may reach 30% to 40% by mid-century (Lanzieri Reference Lanzieri2011). Almost all West European countries are thus facing a major shift in their populations, as East Europeans and non-Europeans become much more numerous than just a generation ago. When, on top of this long-term trend, over one million immigrants from war zones in Syria, Iraq, Libya, and Afghanistan streamed to Europe seeking asylum in 2015, the psychological impact was immense.
Such vast and rapid shifts in the sources and volume of migration to the United States and Western Europe have created an impression that “no one is in control,” stirring anxieties about loss of security and of national cultures. The result has been the rise of anti-immigrant and stridently nationalist parties calling for a halt to immigration.
A growing body of survey and experimental research has clearly demonstrated how perceptions of immigration have driven recent shifts in voting. In the U.K., although Brexit voting was associated with economic decline and exposure to austerity (Fetzer Reference Fetzer2019), “cultural grievances mediate the effect of … economic decline on support for Brexit.” (Carreras, Carreras, and Bowler Reference Carreras, Carreras and Bowler2019, 1396). Kaufmann (Reference Kaufmann2019a) has shown how fears of ethnic decline played a prominent role in Brexit and the rise of populist parties across Europe. In the United States, recent research “finds clear evidence that many white Americans … experience the impending “majority-minority” shift [from immigration] as a threat to their dominant (social, economic, political, and cultural) status.” (Craig, Rucker and Richeson Reference Craig, Rucker and Richeson2018, 206; Gest, Renny, and Mayer Reference Gest, Renny and Mayer2017).
Experimental findings also show that increasing the salience of changing demographics for white voters contributes to anti-immigrant attitudes and support for Donald Trump (Major, Blodorn, and Blascovich Reference Major, Blodorn and Major Blascovich2018; Craig and Richeson Reference Craig and Richeson2017). Most importantly, such reactions were not just found among working-class whites; they are evident across a broad proportion of the American public (Jardina Reference Jardina2019). Indeed, Mutz (2018, E4330) argues strongly that “candidate preferences in 2016 reflected increasing anxiety among high-status groups” rather than complaints among low-status groups based on pocketbook issues. Her analysis finds that “growing domestic racial diversity … contributed to a sense that white Americans are under siege.” Conversely, experiments show that making assimilation more salient, such that the status of whites is not threatened by immigration, reduces support for Hard Brexit in the UK, especially among Brexit and white working-class voters (Kaufmann Reference Kaufmann2019b).
It is striking that Canada and Australia both have a larger proportion of foreign-born residents than the United States or any country in Europe, yet their politics have not been wrenched toward anti-immigrant populism. True, both are countries with a history of immigration; but so is the United States. What seems important, as Kaufmann (Reference Kaufmann2019a,Reference Kaufmannb) has argued, is the perception of immigration, including exposure to and expectations regarding immigrants. Regions or countries with a low percentage of immigrants, but who fear that immigration will be ill regulated and chaotic, show greater support for populist leaders. Conversely, regions and countries that have a high percentage of immigrants can be quite tolerant if they are confident that immigration is well-regulated, orderly, and leads to assimilation outcomes that do not challenge their cultural values. Thus in Canada and Australia, where illegal immigration is low, rules for legal immigration are clear and emphasize migrants’ economic value, and assimilation is expected, hostility to immigration is low.
In sum, the threat to democracy in rich countries from support for populist, ethno-nationalist movements is most acute when popular anxiety is provoked by the combination of economic stagnation and surges of immigrants from unfamiliar sources.
To maintain economic growth and diminish the appeal of populism, the developed countries need to adopt policies that will encourage the regular, orderly admission of immigrants; will support the integration of existing immigrant populations while reducing fears of decay of the national culture; and will help developing countries gain the capacity to provide for their fast-growing populations, minimizing unexpected surges of refugees.
Promoting Slower Population Growth, Political Stability and Economic Development in High-Fertility Countries
We have already noted that by both Freedom House and World Bank governance indicators, the quality of governance in Africa and the Middle East has been declining. In 2015, a civil war in Syria (population 17.5 million today, 30 million by 2040) propelled a million refugees to Europe. Imagine if the next civil war is in Egypt (102 million today, 140 million by 2040) or Ethiopia (115 million today, 175 million by 2040). Another huge eruption of asylum seekers would certainly strengthen the populist, anti-immigrant, illiberal parties in Europe, and the similar movement in the United States.
Yet it would be a severe mistake to view the youth of the developing world as a threat. That outcome is possible in a world of poor governance, but far from necessary. In fact, the youth of the developing world are one of the most precious resources in a world where most countries are facing rapid declines in their prime working-age population. Immigrants from Asia and the Middle East have been essential drivers of America’s tech revolution, just as immigrants from Scotland, Ireland, and Eastern Europe were essential drivers of America’s industrial revolution in the past century. For both the rich world and developing countries, benefitting from this precious resource requires that developing countries avoid chronic violence and crises while providing basic health and education to their populations.
There is, unfortunately, no silver bullet for providing good governance. Recent research shows that democracies, in general, promote economic growth better than dictatorships (Acemoglu et al. Reference Acemoglu, Nadu, Restrepo and Robinson2019). But that is an average result, and the effect is modest—a long-run relative gain in income per head of only 20%. Moreover, countries rarely transition from autocracy to full democracy; most transition first to partial or illiberal democracy, which can be a highly unstable and conflict-prone stage of development (Mansfield and Snyder Reference Mansfield and Snyder.1995; Epstein et al. Reference Epstein, Bates, Goldstone, Kristenson and O’Halloran2006; Goldstone et al. Reference Goldstone, Bates, Epstein, Gurr, Lustik, Marshall, Ulfelder and Woodward2010; Fukuyama Reference Fukuyama2014).
The good news is that neither full democracy nor huge investments in state building are necessary to put developing countries on a positive track. Regardless of regime type, “good enough governance” (Grindle Reference Grindle2007) entails making sensible investments in education, health, and infrastructure; supporting voluntary family planning; enforcing basic property rights; making economic growth more inclusive; and preventing diversion of too much national wealth and income to unproductive and corrupt ends. Incremental progress and iterative problem solving make for better governance than showcase investments and sweeping master plans (Andrews, Pritchett and Woolcock Reference Andrews, Pritchett and Woolcock2017). Simply incentivizing countries to be somewhat less predatory and more inclusive would go far to avoiding state failures (Acemoglu and Robinson Reference Acemoglu and Robinson2012; Goldstone Reference Goldstone2014).
We have striking examples of success: countries as varied as Iran, South Korea, Bangladesh, Tunisia, Morocco, Botswana and Colombia have all reduced fertility from more than six children per woman to fewer than three children per woman in twenty-five years or less (Dodson Reference Dodson2019). They did so by investing in nationwide campaigns to promote women’s education, health and family planning, measures that also increased population health and skills and thus helped lay a foundation for future economic growth.
Consider two countries that once were one: Pakistan and Bangladesh. They remain in many ways twins. Both have Freedom House scores of 5 out of 7 on both political rights and civil liberties. Both have nearly identical levels of income per capita: $1,580 for Pakistan and $1,470 for Bangladesh (for 2017 in current U.S. dollars [World Bank 2019]). Yet their demographic and educational characteristics and their economic trajectories differ sharply.
In 1970, Bangladesh (then East Pakistan) had total fertility of 6.9 children per woman, a bit higher than Pakistan (then West Pakistan) at 6.6. Bangladesh also had the larger population: 65 million versus Pakistan’s 58 million. Forty-five years later, Bangladesh’s fertility had fallen to 2.2, or near replacement; Pakistan’s remained at 3.7, almost 70% higher. They had also switched places in size: by 2015 Pakistan’s population was estimated at 189 million, on the way to reaching 307 million by 2050. Bangladesh, thanks to its much lower fertility, had only 161 million people in 2015, and was on track to remain at just 200 million by mid-century (Cincotta and Madsen Reference Cincotta and Madsen2018).
Bangladesh’s smaller cohorts of young people and investments in education have created a much healthier and better educated population. In Bangladesh, only 631,000 primary age children are not in school; in Pakistan it is 5.37 million (NationMaster 2018). In 1965–1970, both Pakistan and Bangladesh had the same level of infant mortality: 150 per thousand. Yet by 2015–2020, infant mortality in Bangladesh had fallen to less than half that in Pakistan: 27 versus 61 (United Nations 2019).
Bangladesh achieved these fertility and health outcomes by training community-based cadres of health and family-planning counselors. The counselors were locally trained and spread through villages to offer counseling, contraceptives, and maternal and child health interventions. Their success spurred a wider demand for modern contraception and provided the basis for a nationwide public health program. As contraceptive use grew through the 1980s and 1990s, fertility fell sharply.
These health and education improvements have propelled Bangladesh’s economy. At independence it was far poorer and less industrialized than Pakistan. Since then it has caught up due to faster growth: from 2008–2017 Bangladesh’s GDP per person at market exchange rates rose by 150%; for Pakistan such growth was just 50%. At their current growth rates, in another decade Bangladeshis will be two-thirds richer per capita than Pakistanis. Today, Bangladesh has successful construction and pharmaceutical industries, and exports more finished garments than India and Pakistan combined. Not bad for a country that was widely derided as a “basket case” at independence! (Economy Watch 2010; Economist 2017).
Lower fertility and economic progress in Bangladesh have also reduced emigration; today out-migration from Bangladesh (2.3% per year) is only half the rate of Pakistan (4.6% per year).
If other countries can follow the path of Bangladesh, it would bend the curve of population growth in the youngest and fastest growing countries. It would also reduce the risks of violent conflicts, promote economic development, and lessen pressures for emigration.
“E Pluribus Unum:” Immigration and Integration Policies to Preserve Democracy in Rich and Diverse Societies
From the time of the American and French Revolutions, the West has tried, as Fukuyama (2018, 166) has written, to “promote [citizenship and] creedal national identities built around the foundational ideas of modern liberal democracy,” with allegiance to a set of national rights and values.
While this ideal paves the way for immigrants to be absorbed and assimilated, citizenship cannot simply be open and automatic. National identities still revolve around shared language (or languages), as well as national legal/cultural regimes for family and gender relations, workplace behavior, dress, and entertainment. There is no politically viable resolution of the current bitter divide over immigration policy that does not include some recognition that all countries have a right to control their own borders and to determine the criteria for and benefits of citizenship.
What people fear most about immigration, and what feeds the support for illiberal regimes, is the anxiety that their own country will be overwhelmed by those with a different culture and different values, leaving the native-born with a feeling of being foreign, or left out, in their own country. Immigration problems thus are really integration problems. Those fears can, and must, be addressed by creating and enforcing clear immigration rules that restore people’s trust that their government is protecting them and their national values.
In fact, such fears are greatly exaggerated. Most cultures have proven surprisingly resilient in absorbing and diffusing diverse cultural elements: Despite the spread of karaoke and sushi from Moscow to New York, the enthusiasm for cowboys and blue jeans in Europe and Japan, the embrace of Korean K-pop across Asia and the West, or the global enjoyment of Hollywood films, national cultures have continued to survive and thrive.
Nonetheless, people require reassurance. The developed democracies need immigration policies that are simple and easy to understand, and that restore a healthy balance between rules to keep society safe and a recognition of the benefits and the need for immigration.
Clear rules and expectations for work permits, legal residence, and transitions to citizenship that prioritize learning native languages and customs, reward economic success, and require public acceptance of local laws and customs enable host populations to accept immigrants and benefit from their presence. Procedures also need to be in place, along with resources, to deal with crisis-driven surges of refugees in an orderly and humane manner. Provisions for a variety of modes of migration—from short-term work permits to renewable legal residence certification to ways to earn citizenship—can be flexible enough to accommodate a wide variety of labor, educational, and family needs.
Though traditionally hostile to immigration, Japan has recognized the need for change, and has been opening paths for labor migrants. According to Professor Kiyoto Tanno, “[Today] practically every vegetable in the supermarkets of Tokyo was picked by a ‘trainee’ [i.e., foreign worker]” (Hollifield and Sharpe Reference Hollifield and Sharpe2017, 372-73). Foreigners now appear in every occupation from high-skill areas of finance, IT, and education to construction and even sumo wrestling. The 2020 Tokyo Olympics has adopted as one of its promotional themes “Unity in Diversity.” In 2016, more than one in fifty legal residents of Japan were foreign-born, mainly from China, South Korea, the Philippines, Vietnam, Brazil, Taiwan, and Peru (Hollifield and Sharpe Reference Hollifield and Sharpe2017, 374).
Where societies have reached historically high levels of foreign-born as a percent of the population, some temporary slowdown in immigration may be needed to allow the society to pause, adapt, and absorb. To paraphrase David Frumm (Reference Frumm2019) in a recent provocative essay: If liberals don’t enforce limits on immigration, then illiberal populists will. Yet those limits should not be rigid: rather they should function like a valve that can be adjusted according to the labor needs and absorption capacity of the host country. Migration is as necessary to Western economies as irrigation is to their fields. But just as with the fields, both floods and droughts can do tremendous damage. Thus migration must be flexibly regulated to cope with changing conditions and aim to maintain a beneficial flow.
Finally, business leaders need, for their own benefit, to help educate their countries on the need for immigrants to keep pensions, health care, and other key elements of the economy from grinding to a halt. Most importantly, people need to realize that young workers are becoming a scarce commodity, and rich countries will soon be competing more than ever before to attract the most productive immigrants to their shores.
Conclusion: Toward Greater Cooperation
For richer countries, welcoming students, workers, and entrepreneurs from developing ones will be essential to meeting their labor force needs. But it will also, via acquired skills and remittances, stimulate improvements in migrants’ home countries. Actively promoting better governance abroad through business and investment incentives, codes of business ethics, and private-public partnerships will contribute to these goals as well.
Not all developing countries will be able to follow the Bangladeshi path of incremental problem-solving to improve fertility, health, and development outcomes. Rapid population growth and weak or corrupt governance will produce crises in some countries, as it has both in Africa and such high-fertility, conflict-riven countries as Yemen, Syria, Afghanistan, and Pakistan. In such cases, the rich countries will often have to increase their support for the UN High Commissioner on Refugees, and work to create safe zones abroad for displaced populations, while continuing to pursue plans to share the burden of humane and orderly treatment of refugees, including accepting immigrants.
It will require inspiring leadership for the populations of the rich democracies to grasp that their economic future, and their own democratic governance, will depend on helping foreign countries progress in their demographic and economic transitions, as well as on being willing to accept recent and future arrivals to their shores. Yet if these tasks are not undertaken, the future is likely to be a continuing recession of democracy, along with economic stagnation and decline in richer nations and rising poverty and disorder in poorer ones. Cowering behind walls or banning immigration will be self-defeating. Cooperation between the developed and developing countries is essential; without it, in both richer and poorer countries, enormous potential gains will be lost.