1. Introduction
In this paper, we consider a traditional issue in the empirics of growth and economic policy: the evaluation of the potentially long-lasting effects that taxation may have on the real GDP dynamics. Growth theorists have proposed a variety of paths that can explain how this can happen.Footnote 1 We propose an augmented version of the model in Mankiw et al. (Reference Mankiw and Weil1992), which accounts for the effects of taxation on GDP growth. From an econometric standpoint, our main departure from the existing literature is the use of a semi-parametric approach based on a Finite Mixture Model (FMM), which employs a discrete distribution to describe country-specific unobserved heterogeneity in the input effects on per capita GDP.Footnote 2 This allows to tackle one relevant source of bias in growth regressions, due to omitted covariates/factors which influence the GDP dynamics but cannot be observed. It is important to appropriately address unobserved heterogeneity since it may cause correlation between model covariates and residuals, thus leading to biased estimates and, therefore, to wrong policy recommendations. Furthermore, to account for serial correlation in time-varying unobservable factors, we incorporate in the Finite Mixture the so-called auxiliary regression approach, see Mundlak (Reference Mundlak1978, Reference Mundlak and Mundlak1988) and Chamberlain (Reference Chamberlain1980, Reference Chamberlain1984). In that sense, our approach gives a new contribution to the quantification of the impact that taxation has on growth.
The paper is structured in two parts. In the first, we extend the model presented by Mankiw et al. (Reference Mankiw and Weil1992) to account for potential effects of taxation and introduce our semi-parametric approach. The underlying assumption is that countries share common unobserved economic structures (e.g. public debt sustainability, reliability, and fairness of the legal system) whose effects are proxied by country-specific parameters. These are, in turn, considered as random variables with an unspecified distribution function, which can be estimated by a discrete distribution. In this way, countries can be considered as belonging to a set of hidden homogeneous clusters (components), sharing some common economic features represented by cluster-specific parameters.Footnote 3 Following this approach, we restrict the country-specific effect to take values in a small, discrete set accommodating extreme and/or strongly asymmetric departures from usual parametric assumptions.Footnote 4 The first contribution of the paper is, then, to define a model describing the impact of taxation on growth, by allowing parameter heterogeneity among countries. In our model, taxes have both a direct and a indirect effect on GDP growth: the former is measured by the actual tax rates while the latter is measured by the interaction between the capital shares and the mean values of our measures of taxation for each country in the sample over the period under observation.Footnote 5 We consider several fiscal instruments. As it is standard in cross-sectional studies, we assume that (i) tax rates are proxied by the ratio between revenues coming from each specific tax and overall fiscal revenues and (ii) country tax burden is proxied by the ratio between total fiscal revenues and GDP.Footnote 6
In the second part of the paper, we test our model using data from a sample of 21 OECD countries over the period 1965–2010. Using the proposed model specification, the best model is obtained with three components, describing three clusters of countries with homogeneous values of regression parameters. Our main finding is that taxation (when statistically significant) has a negative effect on per capita GDP growth rates, both directly, via aggregate Total Factor Productivity (TFP), and indirectly, via aggregate saving rates. On average, the magnitude of such estimated effects, however, is not that large. The estimates are proved to be robust to several modifications of the basic model structure, and this represents the second contribution of the paper. In times in which several political leaders across the world have based their economic agenda on tax cuts, it is clearly important to assess the effective role that taxes have on growth. Our cross-country analysis makes a clear point on this, at least for the analyzed sample of OECD countries: tax cuts produce a beneficial impact on GDP growth, but not all the tax cuts are alike. Specifically, we find that lowering the personal income tax rate is more beneficial for growth than lowering the corporate income tax rate: in the baseline model, a cut by 10% in personal income tax rate generates an increase in the real per capita GDP growth rate of about 0.6% while the increase due to a cut by 10% in corporate income tax rate is about 0.3%.
The rest of the paper is structured as follows. Section 2 reviews the main empirical literature on the impact of taxation on growth. Section 3 lays down the modeling strategy. Section 4 describes data, presents the estimates, provides countries’ classification, and assesses the robustness of the results. Section 5 concludes.
2. Literature review
Traditionally, the literature on economic growth identifies two main sources of economic development: (i) investments in new capital, physical, and/or human, and (ii) technological change, that is, improvements in the aggregate TFP. Taxation may have negative effects on investments’ returns and/or the expected profitability of R&D, which is one of the main driver of technological innovation. According to this view, taxation is expected to exert a negative impact on the real GDP growth rate (see Lucas, Reference Lucas1990). This negative effect, though, can be, in line of principle, counter-balanced by the gain in aggregate TFP arising from productive public expenditures (e.g. infrastructure, public R&D), which are (largely) financed through taxation.Footnote 7
While the theoretical paths for an increase in taxes to affect growth are clear, empirical works aimed at quantifying the effects of fiscal policy on macroeconomic performance have not produced a conclusive evidence. In particular, the correlation between taxation and real GDP growth is often found to be nonsignificant. Even when the correlation is significant, the result is often not robust to the inclusion of other controls or to changes in the sample composition. Nonetheless, a consensus has emerged on that some fiscal instruments are indeed more harmful to economic growth than others. In this section, we briefly and separately review the main contributions to this topic.
2.1. Taxation and growth
In an early work, Lucas (Reference Lucas1990) shows that eliminating capital income taxation would produce a very small (about 0.03%) increase in real GDP long-run growth. Considering a sample of 18 OECD countries over the period 1965–1988, Mendoza et al. (Reference Mendoza, Razin and Tesar1994) find no relevant correlation between tax rates and growth rates; similar results are presented by Mendoza et al. (Reference Mendoza, Milesi-Ferretti and Asea1997). Daveri and Tabellini (Reference Daveri and Tabellini2000) find a negative effect of labor taxes on employment and growth while other studies, see for example, Koester and Kormendi (Reference Koester and Kormendi1989) and Easterly and Rebelo (Reference Easterly and Rebelo1993), do not document empirical evidence of such effect. Tax revenue over GDP is significantly and negatively correlated with GDP growth according to Angelopoulos et al. (Reference Angelopoulos, Economides and Kammas2007). For a sample of 21 OECD countries over the period 1971–2004, Arnold (Reference Arnold2008) finds a substantial (negative) correlation between corporate/personal income taxation and growth, while property taxes seem to have a milder (but negative) effect. Through a “narrative approach,” Romer and Romer (Reference Romer and Romer2010, Reference Romer and Romer2014) remark that tax increases have a temporarily negative impact on GDP dynamics. More recently, Piketty et al. (Reference Piketty, Saez and Stantcheva2014) find no significant correlation between growth rates and changes in marginal income tax rates observed for OECD countries since 1975.
2.2. Tax composition and growth
Calibrating his model using US and East Asian NIC data, Kim (Reference Kim1998) shows that the difference in tax systems across countries explains a significant proportion (around 30%) of the difference in growth rates. For a sample of 22 OECD countries over the period 1970–1995, Kneller et al. (Reference Kneller, Bleaney and Gemmell1999) find a slight growth-enhancing effect in case of shifting the revenue stance away from “distortionary” taxation (i.e. income tax, social security contribution, tax on property, and tax on payroll) towards “non-distortionary” taxation (i.e. consumption tax). Using data on 17 OECD countries, from the early 1970s to 2004, Bleaney et al. (Reference Bleaney, Gemmell and Kneller2001) obtain similar results, by taking explicitly into account disaggregated revenues and expenditures. For a sample of 23 OECD countries, over the period 1965–1990, Widmalm (Reference Widmalm2001) finds that the proportion of tax revenues raised by taxing personal income exhibits a robust negative correlation with economic growth. In two papers, focused on high-income countries, Padovano and Galli (Reference Padovano and Galli2001, Reference Padovano and Galli2002) find a relevant association between lower income rates and faster economic growth. Li and Sarte (Reference Wenli and Sarte2004) offer evidence that the decrease in progressivity associated with the 1986 US Tax Reform Act leads to small but non-negligible increases in US long-run growth (from 0.12% to 0.34%). For a sample of 70 countries over the period 1970–1997, Lee and Gordon (Reference Lee and Gordon2005) find that higher corporate tax rates are significantly and negatively correlated with cross-sectional differences in average economic growth rates. According to their results, a cut in the corporate tax rate by 10% would raise the annual GDP growth rate by 1–2%. Using data for 116 countries, over the period 1972–2005, Martinez-Vazquez et al. (Reference Martinez-Vazquez, Vulovic, Liu, Martinez-Vazquez, Vulovic and Liu2011) find that an increase of 10% in the direct to indirect tax ratio reduces economic growth and FDI inflows by 0.39% and 0.57%, respectively. Using an updated version of the dataset used by Bleaney et al. (Reference Bleaney, Gemmell and Kneller2001), Gemmell et al. (Reference Gemmell, Kneller and Sanz2011) document rare episodes in which fiscal policy changes affect real GDP long-run growth rates. More recently, Jaimovich and Rebelo (Reference Jaimovich and Rebelo2017) show that low tax rates have a small, nonlinear, impact on long-run growth: as tax rates rise, the negative impact on growth may dramatically rise.
3. The econometric strategy
Building on Mankiw et al. (Reference Mankiw and Weil1992, hereafter MRW), we consider an aggregate technology in which capital accumulation adjusts in response to taxation; that is, we allow for a direct effect of taxation on the magnitude of the effects associated to physical and human capital accumulation shares. We assume that sources of country-specific unobserved heterogeneity may influence the growth process of the (country-specific) per capita GDP. To capture the effects of unobserved heterogeneity, we let the coefficients in the production function vary among countries. Unobserved heterogeneity is used to proxy the effects of country-specific, time-invariant, unobserved covariates.Footnote 8 We further allow for potential correlation between the country-specific effects and the observed covariates, by adopting the auxiliary regression approach by Mundlak (Reference Mundlak1978).
3.1. The model
As in MRW, we assume a Cobb-Douglas production function for country
 $i=1,\ldots,n$
:
 \begin{equation} Y_{it}=\left (A_{it}L_it\right )^{(1-\lambda -\nu )}K_{it}^{\lambda } H_{it}^{\nu } \qquad \text{with }\lambda,\nu \in (0,1), \end{equation}
where
 $Y$
denotes the output,
 $K$
the capital,
 $H$
the human capital,
 $L$
the quantity of labor, and
 $A$
reflects both technological progress and country-specific conditions (e.g. soundness of public finance, quality of institutions, natural resources, etc.).
The model is based on the hypothesis that, for each country, the rates of investment in physical and human capital are determined by a constant fraction of the output, with a common and constant depreciation rate (
 $d$
), a constant and exogenous rate of growth for the labor/population ratio (
 $n$
) and technological progress (
 $g$
). Based on these assumptions and taking logs, the (estimable) equation for the level of per capita GDP,
 $y\equiv Y/L$
, can be written asFootnote
9
 \begin{align} \log (y)_{it} &= \log (A)_{it}+\frac{\nu }{(1-\lambda -\nu )}\log (s_h)_{it}+\frac{\lambda }{(1-\lambda -\nu )}\log (s_k)_{it} \nonumber \\[5pt] &\quad - \frac{\lambda +\nu }{1-\lambda -\nu }\log (n+g+d), \end{align}
where
 $s_h$
and
 $s_k$
are the exogenous shares of total income invested in human capital and physical capital accumulation. Here, country-specific heterogeneity in technological parameters is meant to capture the differences in country-specific GDP dynamics. From an empirical point of view, MRW assume that
 $\log (A)_{it}=\alpha +\epsilon _{i}$
, with
 $\epsilon _i \sim N(0,1)$
representing a country-specific shock. A possible way to let a fiscal variable, say
 $\tau _{it}$
, affect the level of TFP is to assume
 $\log (A)_{it}=f(\tau _{it})+\epsilon _{it}$
, where
 $f(\!\cdot\!)$
can be nonlinear. A more general way to model the effects of the explanatory variables on growth (via technological progress) is to rely on an additional design vector. Assuming an endogenous process for
 $\log (A)_{it}$
, the dynamics corresponding to equation (2) is given by
 \begin{equation} E(\gamma _{it} \mid \textbf{x}_{it}, \textbf{z}_{it})= \alpha _i + \beta _0 \log (y_{i,0})+ \textbf{x}^{\prime }_{it}{{\beta }} + \textbf{w}_{it}^{\prime }\delta, \end{equation}
where
 $\textbf{x}_{i}$
is a vector including the observed Solow-type covariates (i.e. physical and human capital accumulation shares and effective units of labor growth adding depreciation rates),
 $\gamma _{it} \propto (1/T)(\log (y)_{it}-\log (y)_{i,0})$
is the 5-year average growth rate of the per capita real GDP,
 $\alpha _i$
measures country-specific innovation,
 $\beta _0$
is the convergence parameter and
 $\textbf{w}_{it}$
is an additional design vector including factors that may affect country-specific technological progress. Specifically,
 $\textbf{w}_{it}$
includes information on country-specific tax structure, proxied by total tax revenues, personal income, and corporate tax rates. Equation (3) raises several econometric issues that need to be addressed.Footnote
10
Correlation between variables in
 $\textbf{w}_{it}$
,
 $\textbf{x}_{it}$
and the initial conditions
 $\log (y_{i,0})$
, endogeneity, and unobserved heterogeneity may cause bias in parameter estimates.Footnote
11
Regression results may be inflated by collinearity, and, since initial GDP is likely correlated with capital saving rates, covariate effects—for example, those measuring tax policies—may be ill-estimated.Footnote
12
Moreover, since it is based on macro-level measures, this class of models does not properly take into account heterogeneity at micro-level.Footnote
13
In this sense, micro-level interactions can be viewed as hidden relationships underlying the macro-level data generating process. Therefore, if taxation influences both capital accumulation and growth dynamics, the estimated coefficient for
 $\delta$
in equation (3) may mix different effects.Footnote
14
To deal with this issue, we modify the model specification to allow for dependence between fiscal policy, technology, and capital stocks.
3.2. The augmented model
Following Barro (Reference Barro1990), we assume that taxation affects GDP dynamics both directly, via aggregate efficiency, and indirectly, through (its effect on) aggregate saving rates. We estimate a linear model for the mean growth rate
 $\gamma _{it}$
under potential misspecification due to unobserved covariates and wrong assumptions on the shape of the GDP growth rate function.Footnote
15
When we allow for country-specific heterogeneity, equation (3) can be written as follows:
 \begin{equation} \textrm{E}\left (\gamma _{it} \mid \textbf{x}_{it}, \textbf{w}_{it}, {\phi }_{i}\right )= \textbf{x}^{\prime }_{it}{\beta }+\textbf{w}^{\prime }_{it} {\phi }_i, \end{equation}
where
 $\textbf{x}_{it}$
now denotes the global vector of observed covariates with noncountry-specific effect, that is,
 $\log (y_{i,0})$
,
 $\log (n+g+d)_{i,t}$
and the fiscal policy instruments
 $\tau _{it}$
, while
 $\textbf{w}_{it}$
includes the intercept and covariates
 $\log (s_h)_{it}$
and
 $\log (s_k)_{it}$
that are assumed to be associated with country-specific effects
 $\phi _i$
,
 $i=1,\ldots,n$
. The country-specific effects
 $\phi _i$
are zero-mean deviation from the corresponding effects in
 $\textbf{x}_{it}$
. We assume that
 $\phi _{i}$
is i.i.d. drawn from a distribution
 $g_{\phi }$
, with zero mean and covariance matrix
 $\Sigma _{\phi }$
.
Notice that, in equation (4), the intercept and slopes for investment shares are free to vary across countries, conditional on the country-specific fiscal policy variables, whose direct effects on GDP are supposed to be constant across countries. As the random parameters are unobserved, and potentially high-dimensional, we proceed by employing a random-effect estimator.Footnote 16 When integrating the random parameters out of the model equation, however, we need to account for potential dependence between controls and unobservable heterogeneity. For this purpose, we employ the so-called auxiliary regression approach, proposed by Mundlak (Reference Mundlak1978, Reference Mundlak and Mundlak1988) and generalized by Chamberlain (Reference Chamberlain1980, Reference Chamberlain1984):
 \begin{equation} \phi _{i}=E({\phi }_{i} \mid \textbf{X}_{i}) +\tilde{{\phi }}_{i}=\Psi \overline{\textbf{x}}_{i} +\tilde{{\phi }}_{i}, \end{equation}
where
 $\overline{\textbf{x}}_i=T^{-1}\sum ^{T}_{t=1} \textbf{x}_{i,t}$
denotes the mean covariates values for the
 $i$
-th country for the whole period; the country-specific parameter vector
 $\tilde{{\phi }}$
is now (linearly) free of observed variables, and the matrix
 $\Psi$
describes the dependence of its elements on the country-specific mean
 $\overline{\textbf{x}}_{i}$
. To tackle endogeneity issue, due to fact that the vector of observed covariates
 $\textbf{x}_{it}$
also includes the initial conditions
 $\log (y)_{i,0}$
, we assume the sequential exogeneity condition to ensure identification of elements in
 $\beta$
(Wooldridge, Reference Wooldridge2009):
 \begin{equation} E(\epsilon _{it} \mid \textbf{x}_{it},\ldots, \textbf{x}_{it}, \tilde{{\phi }}_i)=0. \end{equation}
This implies that the dynamics in the mean is completely specified when the lagged response is considered and
 $\textbf{x}_{it}$
reacts to shocks affecting
 $\gamma _{it}$
.Footnote
17
Substituting (5) in equation (4), we obtain
 \begin{equation} \mu ^{\gamma }_{it}=E\left (\gamma _{it} \mid \textbf{x}_{it}, \textbf{w}_{it}, \tilde{{\phi }}_{i}\right )= \textbf{x}_{it}^{\prime }{\beta }+\textbf{w}_{it}^{\prime }\Psi \bar{\textbf{x}}_{i}+\textbf{w}_{it}\tilde{{\phi }}_{i}. \end{equation}
Equation (7) defines a random coefficient model corrected for potential endogeneity. Vector
 ${\beta }$
in equation (7) measures the (so-called within) effect that the dynamics of the observed
 $\textbf{x}$
has on the growth rate of GDP. Note that, for construction, matrix
 $\boldsymbol\Psi$
measures not only the indirect effect of
 $\textbf{x}$
, mediated by the unobserved covariates via the correlated country-specific random coefficients, but also the effects of other unobserved covariates that are potentially correlated with the country-specific tax structure (e.g. the prevalence of tax evasion in a country, the type of countries’ institutional setting). In this sense,
 $\boldsymbol\Psi$
represents an extension to general Random Coefficient Models of the so-called between effect in random intercept models. Last,
 $\tilde{{\phi }}$
measures country-specific departures from the homogeneous model, unrelated to the observed covariates.
In equation (7), both the country-specific intercepts and the saving rates may be function of tax policy instruments. In this sense, we say that our model is an extension of MRW. The indirect effect of
 $\textbf{x}_{it}$
is summarized by the effects associated to
 $\bar{\textbf{x}}_{i}$
and its interaction with saving rates (as a result of the product
 $\textbf{w}_{it}^{\prime }\Psi \bar{\textbf{x}}_{i}$
). Notice that this equation also defines a two-level mixture regression model (Muthén and Asparouhov, Reference Muthén and Asparouhov2009), with two different sources of variation: (i) residual, at the country/time level, and (ii) unit-specific, at the country level. The country-specific parameters lead to country-specific relationships between investment shares and growth rate of per capita GDP.
We approximate the distribution of country-specific parameters by using a discrete distribution and employ a FMM. The discrete distribution may be considered as a nonparametric estimate of the unspecified random parameter distribution.Footnote
18
This distribution is described by masses
 $\pi _k$
associated with location
 $\zeta _k$
,
 $k=1,\ldots,K$
, that is
 ${\tilde{\phi }}_i\sim \sum _k \pi _k \delta _\phi (\zeta _k)$
, where
 $\delta _x(a)=1$
if
 $x=a$
, and 0 otherwise. By using this approach, we try to minimize the impact of potential misspecification of the random-effect distribution.Footnote
19
Details of the maximum likelihood estimation are provided in Appendix A.
3.3. Modeling assumptions
Rather than assuming that mean tax levels (of any type) influence any of the effects in
 ${{\phi }}_{i}$
, we introduce some identifying restrictions on the elements of the matrix
 $\boldsymbol{\Psi }$
in equation (5). The auxiliary equation system in (5) would need the mean values for all the observed covariates to be inserted in the linear predictor, to be used as a sort of weak instruments for unobserved, country-specific and time-invariant, covariates. However, due to the high dimensionality of the problem, we make the following assumptions on the mechanisms through which mean level of tax-related variables affects country-specific parameters. First, the overall tax burden,
 $\tau _{T}$
, affects the country-specific coefficient associated with the aggregate TFP. Second, the personal income tax share,
 $\tau _w$
, impacts the country-specific parameter for the accumulation rate of human capital (
 $s_h$
).Footnote
20
Third, taxation on corporate income,
 $\tau _k$
, influences the country-specific coefficient for physical capital accumulation rate (
 $s_k$
). Once the above assumptions are included in the empirical model—equations (4) and (5)—we obtain the following system of equations:
 \begin{equation} \left \{\begin{array}{l} \gamma _{it} =\alpha _{i}+\beta _{0} \log (y_{i0})+\beta ^h_i\log (s_h)_{it}+\beta ^k_i\log (s_k)_{it}+\beta _3\log (n+g+d)_{it}\\[5pt] \qquad +\delta _1 \tau _{T,it}+\delta _2 \tau _{w,it}+\delta _3 \tau _{k,it}+\varepsilon _{it} \\[5pt] \alpha _i=\tilde{\phi }_i^{A}+\psi _{00}\overline{\tau }_{T,i}+\psi _{01}\overline{\log (s_h)}_{i}+\psi _{02}\overline{\log (s_k)}_{i} \\[5pt] \beta ^h_i=\tilde{\phi }_i^{h}+\psi _{10}\overline{\tau }_{w,i}+\psi _{12}\overline{\log (s_k)}_{i}\\[5pt] \beta ^k_i=\tilde{\phi }_i^{k}+\psi _{20}\overline{\tau }_{k,i}+\psi _{21}\overline{\log (s_h)}_{i}, \end{array} \right. \end{equation}
where:
-
(i) the
 $\tilde{\phi }$
terms capture the effect of omitted covariates, once we condition on the observed ones;
-
(ii)
$\alpha _i, \beta ^k_i, \beta ^h_i$
are allowed to vary across countries as a function of mean levels for tax policy measures
$\overline{\tau }_{T,it},\overline{\tau }_{w,it},\overline{\tau }_{k,it}$
, and mean levels for investment shares
$\overline{\log (s_k)}_{i}$
and
$\overline{\log (s_h)}_{i}$
; -
(iii)
$\boldsymbol{\delta }_1$
,
$\boldsymbol{\delta }_2$
, and
$\boldsymbol{\delta }_3$
measure the direct effect of tax-related variables on the growth rate of per capita GDP, while
$\psi _{00}, \psi _{10}, \psi _{20}$
represent the corresponding effect on the growth path, due to indirect paths and to correlation between tax policy variables in the growth rate equation and omitted country-specific variables.Footnote
21
-
(iv)
$\tilde{\phi }_i^{A}, \tilde{\phi }_i^{h}, \tilde{\phi }_i^{k}$
are country-specific random terms that are linearly free of observed covariates.





Notice that due to these modeling assumptions and corresponding identifying restrictions, parameter estimates may be biased. Therefore, in order to check for the stability and robustness of parameter estimates to modeling assumptions, in Paragraph 4.4 below we discuss the results obtained by fitting several alternative models, associated with different assumptions on the dependence path between random coefficient and observed covariates.
After some algebra, system (8) can be rewritten as follows:
 \begin{align} \gamma _{it} &=\left (\tilde{\phi }_i^{A}+\psi _{00}\overline{\tau }_{T,i}+\psi _{01}\overline{\log (s_h)}_{i}+\psi _{02}\overline{\log (s_k)}_{i}\right ) +\beta _{0} \log (y_{i0})\nonumber \\[5pt] &\quad +\left (\tilde{\phi }_i^{h}+\psi _{10}\overline{\tau }_{w,i}+\psi _{12}\overline{\log (s_k)}_{i}\right )\log (s_h)_{it}\\[5pt] &\quad +\left (\tilde{\phi }_i^{k}+\psi _{20}\overline{\tau }_{k,i}+\psi _{21}\overline{\log (s_h)}_{i}\right )\log (s_k)_{it}\nonumber \\[5pt] &\quad + \beta _3\log (n+g+d)_{it}+ \delta _1 \tau _{T,it}+\delta _2 \tau _{w,it}+\delta _3 \tau _{k,it}+\varepsilon _{it}. \nonumber \end{align}
The FMM is based on a (multivariate) discrete estimate for the distribution of the country-specific random terms
 $\tilde{\phi }_i^{A}$
,
 $\tilde{\phi }_i^{h}$
and
 $\tilde{\phi }_i^{k}$
, obtained once we account for the effect of mean tax and shares levels on unobserved country-specific effects.
4. The empirical analysis
In this section, we use the framework developed above to disentangle the sources of the cross-country relation between different taxation instruments and the growth rate of per capita GDP.
To evaluate the findings of the FMM, after having described the analyzed sample, we present the estimates for equations (3) and (9) obtained by well-known alternative estimators. We start by considering a model with country-specific intercept only, that is we estimate the reduced form of equation (9) (i.e. the model in equation (3)) by the OLS Fixed Effects estimator. To deal with potential reverse causation between the real per capita GDP growth rates and the country-specific tax policy measures, we employ an IV-GMM estimator.Footnote 22 We then proceed to the general model in equation (9); we employ the GLS Random Effects estimator, with Gaussian assumptions on the random effects, and an auxiliary regression approach to account for potential correlation between observed and unobserved (country-specific, time-invariant) covariates. Since country-specific random parameters cannot be enough to account for potentially dynamic, multi-factor dependence, we employ the estimator proposed by Pesaran and Smith (Reference Pesaran and Smith1995) and extended by Chudik and Hashem Pesaran (Reference Chudik and Hashem Pesaran2015). Finally, we present the proposed FMM, which allows for country-specific, time-invariant, parameter heterogeneity among countries with similar fundamentals.Footnote 23 Based on the results obtained by the FMM, we proceed to sort countries into homogeneous groups of the conditional distribution of per capita GDP growth rate.
4.1 The data
Our sample includes 21 OECD countries, observed over the period 1965–2010.Footnote
24
The effects of modifications in the time span are discussed in Paragraph 4.4. Our sample consists of a sub-sample of OECD countries (Australia, Austria, Belgium, Canada, Denmark, Finland, France, Germany, Italy, Ireland, Japan, Luxembourg, the Netherlands, New Zealand, Norway, Portugal, Spain, Sweden, Switzerland, the United Kingdom, and the United States). Due to lack of data on taxation, we did not include in the sample transition economies (Albania, Bulgaria, Croatia, Czech Republic, FYR Macedonia, Hungary, Poland, Romania, Slovak Republic, Slovenia). We also exclude Greece because of the serious doubts cast on the reliability of its national accounts at the beginning of 2000s. Finally, we exclude Turkey because it is associated to high leverage as measured by the Cook distance 0.052 against a sample average of 0.0013. The Summers-Heston dataset (PWT 9) provides information on per capita GDP, rate of physical capital accumulation (
 $s_k$
), employment, rates of change in population (
 $n$
) and technological progress (
 $g$
) and depreciation rate (
 $\delta$
). The rate of human capital accumulation (
 $s_h$
) has been proxied by the Human Capital Index reported by PWT 9. OECD fiscal database (2017) provides information on taxes. Following Kneller et al. (Reference Kneller, Bleaney and Gemmell1999), Lee and Gordon (Reference Lee and Gordon2005), Arnold (Reference Arnold2008) and Gemmell et al. (Reference Gemmell, Kneller and Sanz2013), we focus on the following fiscal instruments: personal income tax rate (
 $\tau _{w}$
), corporate income tax rate (
 $\tau _{k}$
), total tax burden (
 $\tau _{T}$
). To describe the clusters, we also consider additional fiscal variables, namely personal income taxes (including social security contributions and taxes on payroll,
 $\tau _n$
), tax on consumption (
 $\tau _c$
), tax on sales (
 $\tau _s$
), and social security contributions (
 $ssc$
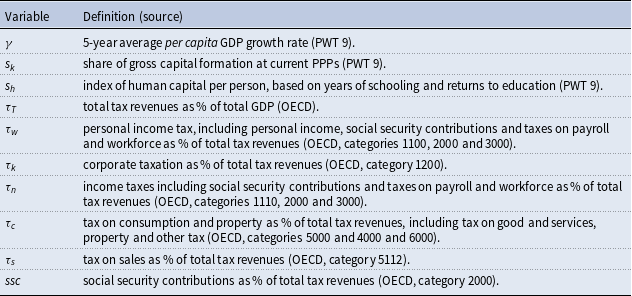
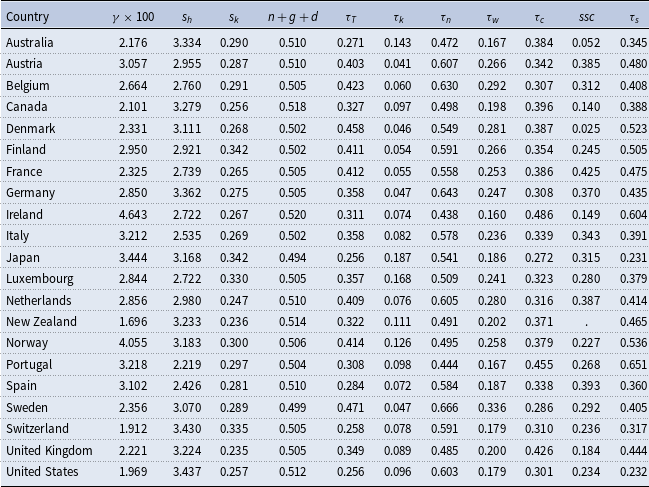
). Tables A7 and A8 in the Appendix report variable definitions and descriptive statistics.Footnote
25
To reduce the problem of endogeneity between future income and past tax rates, we build the covariate set by using a five-year lag.Footnote 26
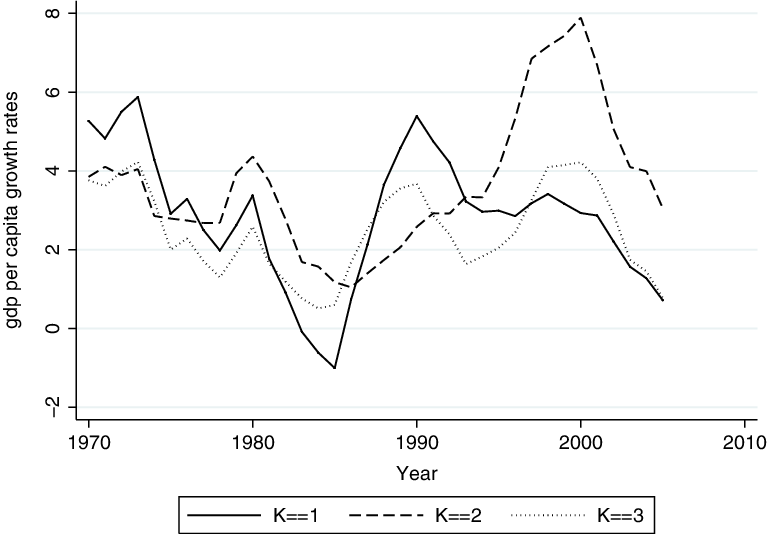
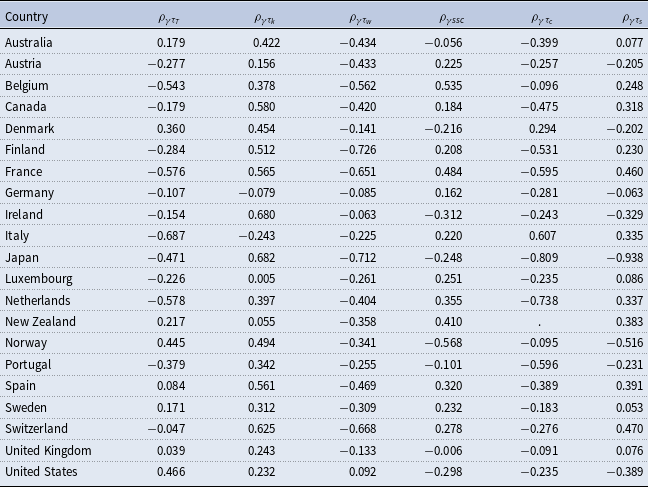
Table A9 in the Appendix shows that the association between fiscal policy variables and growth rates of per capita GDP is not homogeneous across countries. In the next paragraph, we assess whether these correlations are linked to some country-specific characteristics. Figure 1 shows the clusters growth rates of per capita GDP during the analyzed period.
GDP growth rates by groups.

4.2 A comparison with alternative estimators
We start by estimating a reduced form of the proposed model in equation (9), where only country-specific intercepts are used to represent unobserved heterogeneity, while the coefficients for investment share (
 $s_k$
) and the rate of human capital accumulation (
 $s_h$
) are kept constant across countries. Hence, equation (9) becomes
 \begin{align} \gamma _{it}& =\alpha _{i}+\beta _{0} \log (y_{i0})+\beta ^h\log (s_h)_{it}+\beta ^k\log (s_k)_{it}+\beta _3\log (n+g+d)_{it}\\[5pt] &\quad +\delta _1 \tau _{T,it}+\delta _2 \tau _{w,it}+\delta _3 \tau _{k,it}+\varepsilon _{it}. \nonumber \end{align}
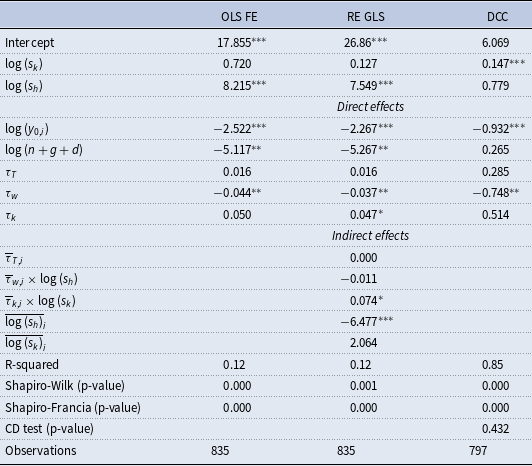
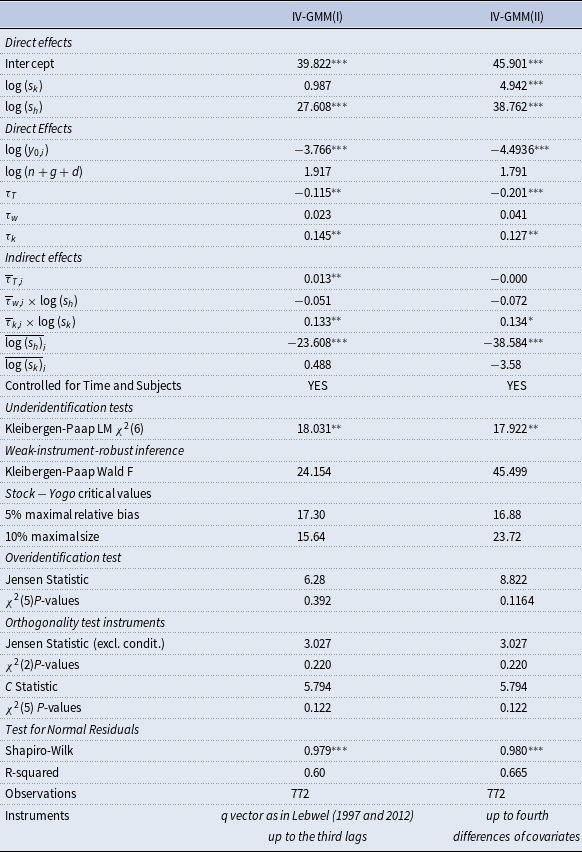
Parameters are obtained by using a fixed-effect estimator. The corresponding estimates are reported in the first column of Table 1. Several other estimators have been considered to disentangle the correlation among residuals and covariates. Table 2 reports the parameter estimates obtained via IV-GMM, which addresses the endogeneity issue by using as instruments up to four differences of covariates and variables’ transformations as in Lewbel (Reference Lewbel1997, Reference Lewbel2012). Results obtained by IV-GMM(I) and IV-GMM(II) are quite similar despite the different instruments used to correct for endogeneity.Footnote 27
Fixed-effect OLS, random-effect GLS, and dynamic common correlated effect estimates

Significance:
 $^{***}\;:\;0.001$
,
 $^{**}\;:\;0.01$
,
 $^{*}\;:\; 0.05$
; Dependent variable: Real GDP growth rate computed as
 $(1/T)\times (\log (y)_{it}-\log (y)_{it-1})$
. See Table A7 in the Appendix for tax variables definition and sources.
Instrumental variables estimates
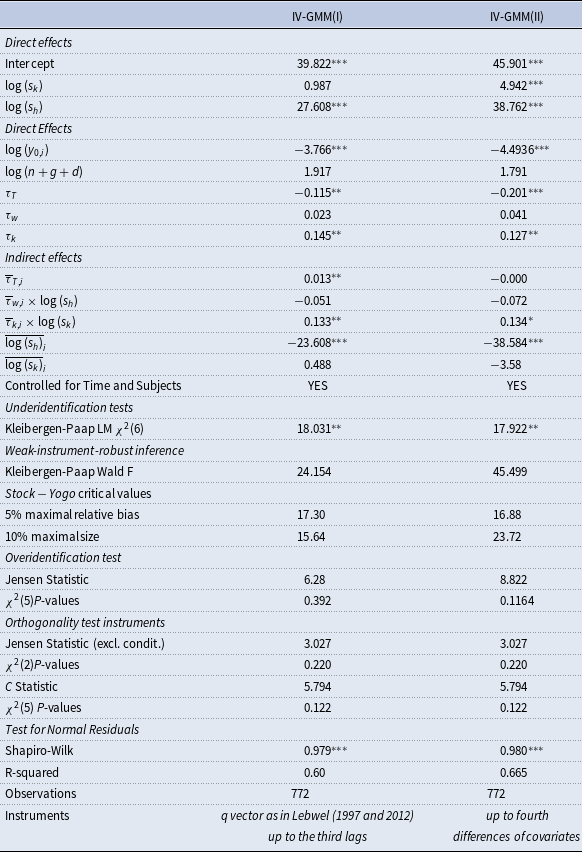
Significance levels:
 $^{***}\;:\;$
0.001,
 $^{**}\;:\;$
0.01,
 $^{*}\;:\;$
0.05; Dependent variable: Real GDP growth rate computed as
 $(1/T)\times (\log (y)_{it}-\log (y)_{it-1})$
. See Table A7 in the Appendix for tax variables definition and sources.
We then proceed with the Random-Effect GLS (RE GLS) estimator with the auxiliary regression approach, which includes both direct and indirect effects of taxation. This leads to the following specification
 \begin{align} \gamma _{it} &=\alpha _i+\beta _{0}\log (y_{i0})+\beta ^h\log (s_h)_{it}+\beta ^k\log (s_k)_{it}+\beta _3\log (n+g+d)_{it} \nonumber \\[5pt] &\quad +\delta _1 \tau _{T,it}+\delta _2 \tau _{w,it}+\delta _3\tau _{k,it}\psi _{00}\overline{\tau }_{T,i}+\psi _{01}\overline{\log (s_h)}_{i}+\psi _{02}\overline{\log (s_k)}_{i} \nonumber \\[5pt] &\quad +\psi _{10}\overline{\tau }_{w,i}\times \log (s_h)_{it}+\psi _{20}\overline{\tau }_{k,i}\times \log (s_k)_{it}+\varepsilon _{it}. \end{align}
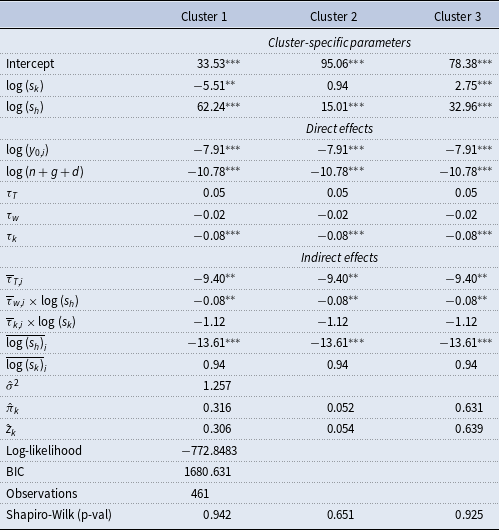
Estimates are reported in the second column of Table 1. Parameters for
 $\tau _k$
and its indirect effect on growth (
 $\overline{\tau }_{k,i}\times{\log (s_k)}$
) are weirdly positive. Notice also that this model specification is actually based on a simple structure of the measurement error with a dependence between longitudinal values referring to the same country, entirely explained by country-specific parameters. However, the estimates may be biased if time-varying forms of dependence occur, due, for example,, to the presence of 1-year lagged response variable among the covariates. To address this specific issue, we consider the Dynamic Common Correlated Effects EstimatorFootnote
28
based on the following model parameterization:
 \begin{align} \gamma _{it}& =\alpha _{i}+\beta _{0i} \log (y_{i0})_i+\beta ^h_i\log (s_h)_{it}+\beta ^k_i\log (s_k)_{it}+\beta _{3i}\log (n+g+d)_{it}\\[5pt] &\quad +\delta _1 \tau _{T,it}+\delta _2 \tau _{w,it}+\delta _3 \tau _{k,it}+ \sum [d_{i}\times Z_{i,S}] +\varepsilon _{it} \nonumber, \end{align}
where
 $Z_{i,S}$
is now the matrix including means of lagged covariates and response at time
 $S$
and the sum is over
 $S=t,\ldots,t-\rho (T)$
where
 $\rho$
is the lag operator for the cross-section correlation,
 $\textbf{d}_{i}$
. The DCC estimator allows for heterogeneous, country-specific, parameters in regression models for large panels with dependence between cross-sectional units. However, issues may arise when either the number of statistical units (here, the number of countries) or the number of time periods are not large enough. Despite the similarities between this approach and our FMM, it must be noticed that our model does not require any parametric restriction on the country-specific parameter distribution.
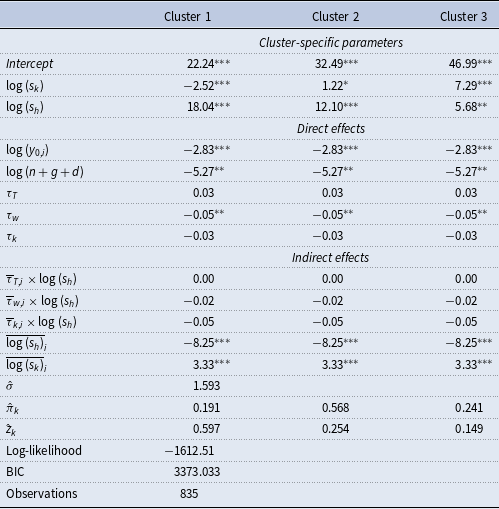
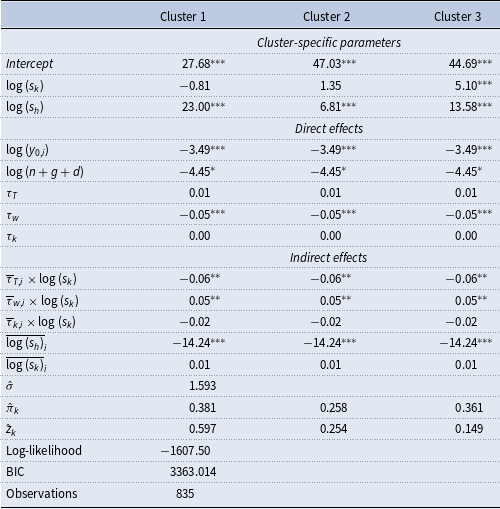
Model I, equation (9)
Significance levels:
 $^{***}\;:\;$
0.001,
 $^{**}\;:\;$
0.01,
 $^*\;:\;$
0.01.Dependent variable: Real GDP growth rate computed as
 $(1/T)\times (\log (y)_{it}-\log (y)_{it-1})$
. See Table A7 in the Appendix for tax variables definition and sources.Note:
 $\hat{\sigma }^2$
, variance of the random terms;
 $\hat{\pi }_k$
, estimated prior probabilities;
 $\hat{z}_k$
, estimated posterior probabilities. See Table A7 in the Appendix for tax variables definition and sources.
The third column of Table 1 reports the estimates of the DCC model. Parameters associated with fiscal policy variables have no effect or are negatively related to the GDP growth. However, they are often not significant. The CD statistic indicates that we cannot reject the hypothesis that the correlation between units at each point in time converges to zero.Footnote 29
Importantly, for all the parametric methods presented in this paragraph, the normality tests, that is the Shapiro-Wilk test and the Shapiro-Francia test, suggest to reject the hypothesis of Gaussian errors. This indicates that even after controlling for observed covariates and unobserved heterogeneity, residuals are far from being symmetric; none of these estimators is able to correct the bias in parameter and standard error estimates due to unobserved heterogeneity. We deem that the FMM in equation (9), which is based on a discrete estimate of the country-specific random parameter distribution, may address this issue, providing a consistent estimate of the true distribution of the random effects.Footnote 30 Furthermore, as the assumption of Gaussian errors is now conditional on the mixture component, the marginal error distribution is estimated through a finite mixture of Gaussian densities, which may be seen as a nonparametric density estimate for the marginal error distribution. In this sense, the FMM may help to relax some of the unverifiable modeling assumptions and produce a more robust estimates.
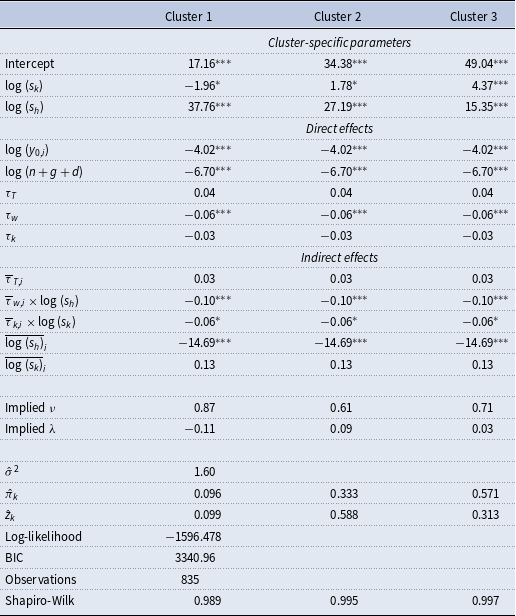
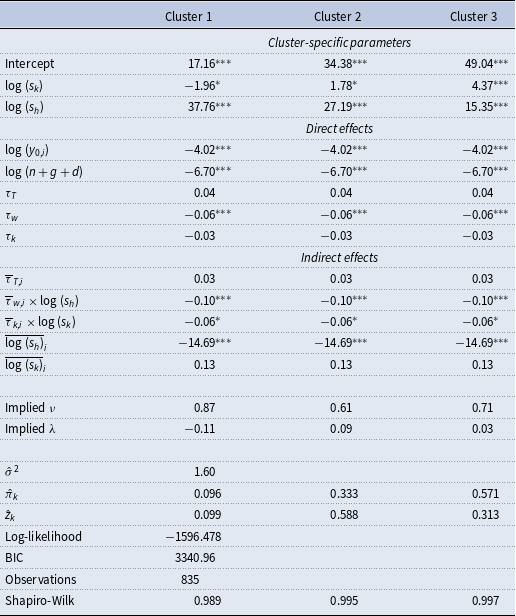
4.3 The FMM
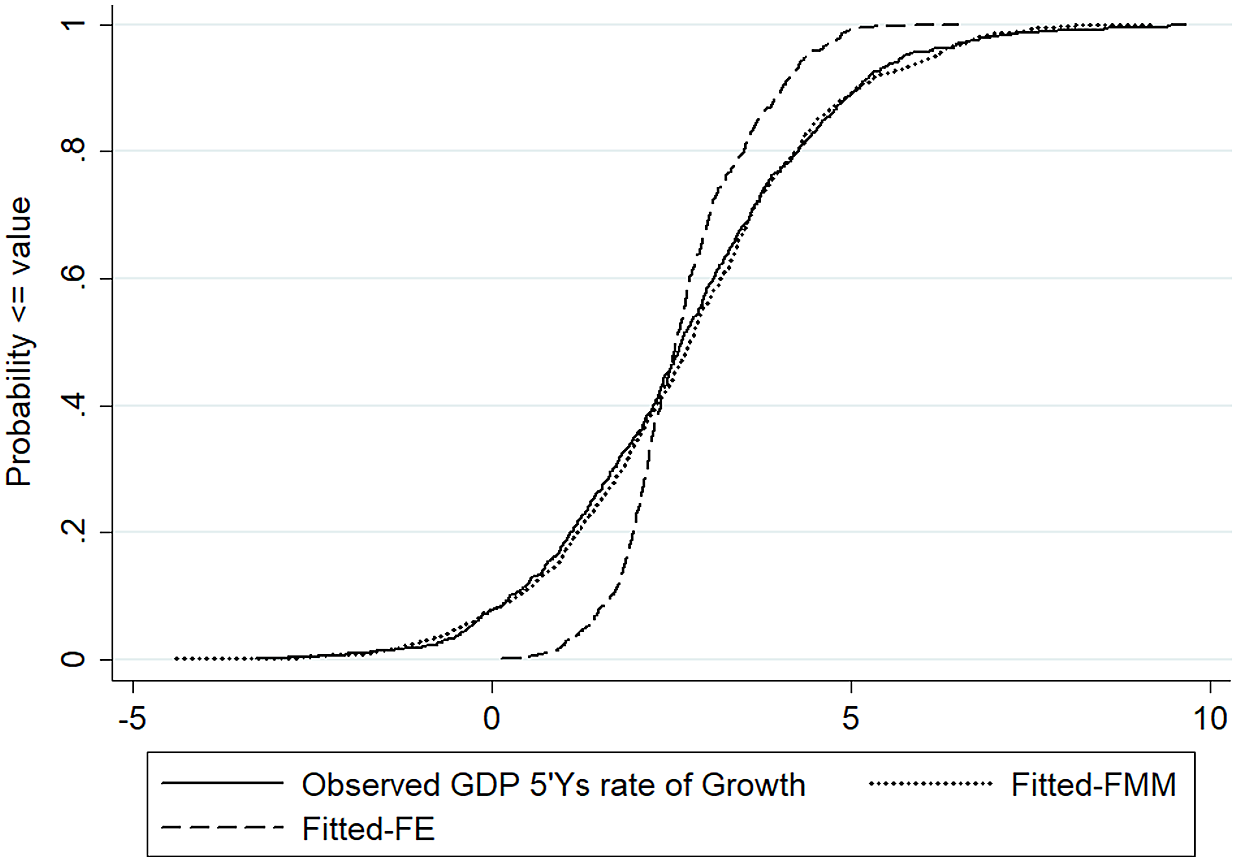
Table 3 presents the estimates obtained by using the proposed the FMM. Notice first that the FMM has a better fit than that provided by the OLS FE estimator. This is evident looking at Figure 2, in which we overlay the empirical density functions of
 $\gamma$
, obtained via either FMM (dotted line) or OLS FE (dashed line), on the observed data distribution. Moreover, while the OLS estimates may be biased due to residuals’ non-normality, as the Shapiro-Wilk test rejects this hypothesis (with a p-value = 0.000), the hypothesis is not rejected for all the three components identified via FMM.
Empirical cumulative functions for FMM in Table 3 and OLS FE.

As mentioned above, the FMM approach also allows to group units into homogeneous components, with the same values of model parameters.Footnote
31
Here, each component is a cluster of countries and each country is assigned to a cluster according to the maximum a posteriori (MAP) rule, that is, the
 $i$
-th country is assigned to the
 $l$
-th component if
 $\widehat{z}_{il}=\max (\widehat{z}_{i1}, \ldots, \widehat{z}_{iK})$
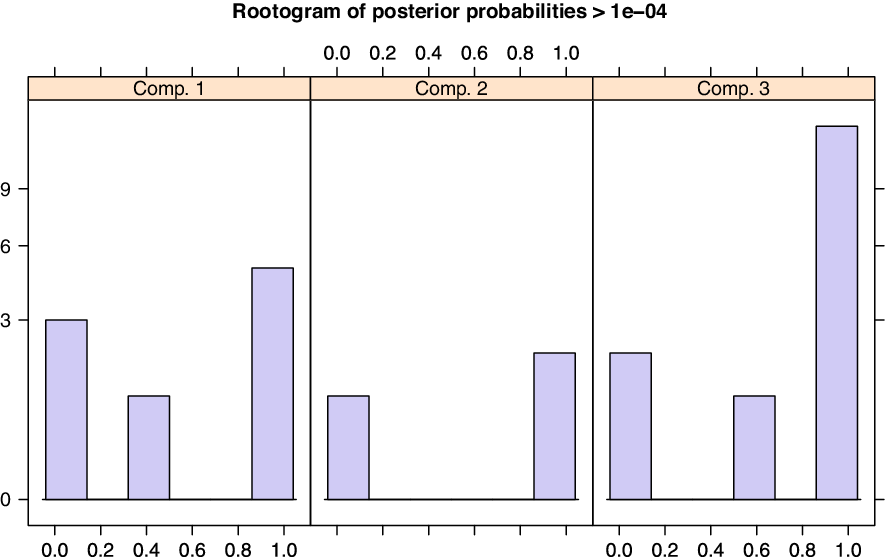
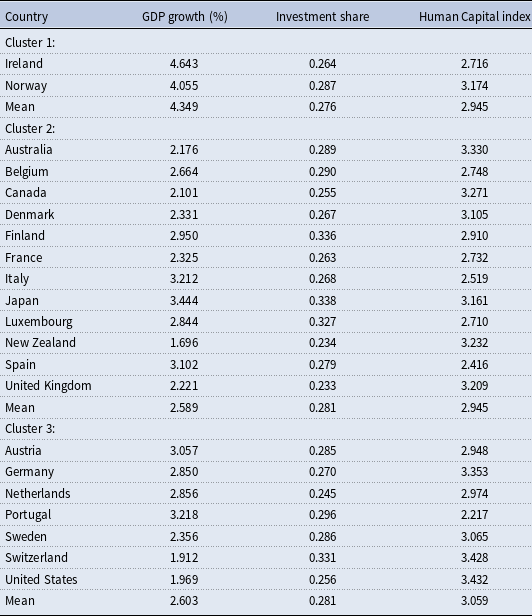
. Since the Bayesian information criterion (BIC) for model in equation (9) achieves its minimum with three components, we opt for a classification with three clusters of countries. Posterior rootogram in Figure 3 shows that components are quite well separated. Table 4 reports the summary of GDP, investment share, and Human Capital index stratified by components of the FMM. Countries in Cluster 1 (Ireland and Norway) have grown faster than the others: the average per capita GDP growth rate in Cluster 1 is 4.3% while it is about 2.6% for both Cluster 2 and Cluster 3. Values for the average investment share and Human Capital Index do not display differences of the same magnitude. This suggests that the origin of such growth differentials should be sought elsewhere.
Rootogram for posterior component membership.


The coefficient for the initial level of income (
 $\log (y_0)$
) is significant and negative (
 $-4.02$
), indicating a clear tendency towards convergence across OECD countries. Coefficients for savings rates, which are cluster-specificFootnote
32
, when statistically significant are in line with the theory except the parameter for
 $\log (s_k)$
in the Ireland and Norway cluster (
 $-1.96$
, p-value
 $\lt$
0.10). This result could be explained by the fact that the two growth miracles appear to be driven by other than physical capital accumulation. Klein and Ventura (Reference Klein and Ventura2021) point out that changes in aggregate TFP are the primary drivers of the Irish spectacular growth performance over the period 1980–2005. They also acknowledge crucial roles for intangible capital, openness to multinational firms and changes in labor market regulation. None of these factors, however, is directly taken into account in our analysis. Norway is rather a success of natural resource economy with one of the highest “natural capital” share among rich economies (12% in 2006).Footnote
33
This kind of capital is not captured by the variable “Share of gross capital formation at current PPPs” provided by PWT, and, therefore, our estimate cannot directly account for it.Footnote
34
Consistently with these considerations, Cluster 1 presents the highest coefficient for human capital (37.76).Footnote
35
Moreover, along the sample period, both Ireland and Norway have behaved as outliers in the distribution of one or more variables: Ireland has grown at the highest growth rate (4.6%) while Norway, despite its sustained growth (4%), has shown the largest decrease in
 $s_k$
(
 $-54.5$
%) among the countries in the sample.
Table 3 also gives the values of factor shares (
 $\nu$
and
 $\lambda$
) implied by the coefficients in the restricted regression à la MRW. In particular, the estimated impact of saving is much lower than in MRW, that is the values of the implied
 $\lambda$
, which are never statistically significant, range from 0.03 to 0.09.
Overall, the FMM estimates clearly indicate that not all taxes have the same impact on growth (see also the discussion on Table 5 below). Specifically, while we find a negative direct effect (
 $-0.06$
) on growth of the tax rate on personal income (
 $\tau _w$
), the same is not necessarily true for the tax rate on corporate income (
 $\tau _k$
) and the total tax burden (
 $\tau _T$
), for which we find no statistically significant direct effects. Estimates for the interaction between taxation instruments and, respectively,
 $s_k$
and
 $s_h$
indicate a negative indirect effect of both
 $\tau _k$
(
 $-0.06$
) and
 $\tau _w$
(
 $-0.10$
).Footnote
36
The intuition behind this result is that increases in
 $\tau _k$
and
 $\tau _w$
lower the return of physical and human capital, respectively, thus reducing the incentives to accumulate them. Finally, the negative coefficient of
 $\overline{\log ({s_h})}_i$
(−14.69) suggests that a higher average endowment of human capital is associated with a lower growth rate over the observation window. In our framework, this negative correlation can be taken as evidence in favor of the convergence hypothesis.
Effect on the 5-year average per capita GDP growth rate of a 10% cut in
 $\tau _w$
and
 $\tau _k$

Significance levels:
 $^{\ast\ast\ast}\;:\;$
0.001
 $^{\ast\ast}\;:\;$
0.01
 $^{*}\;:\;$
0.05. Note:
 $\hat{\sigma }^2$
, variance of the random terms;
 $\hat{\pi }_k$
, estimated prior probabilities;
 $\hat{z}_k$
, estimated posterior probabilities
4.4 Robustness
Robustness is a distinctive feature of the estimates obtained by the proposed model, when compared to estimates of the competing approaches. Our results do not change when we divide the sample into two sub-periods “pre-great moderation” (1965–1990) and “great moderation” (1990–2007) or when we exclude the years of the Global Financial Crisis (2008–2010).Footnote
37
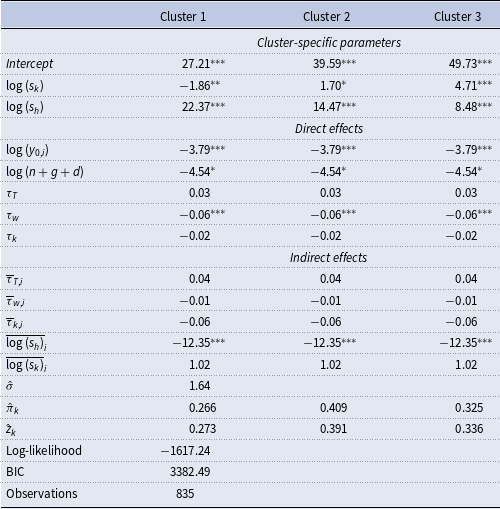
As shown in Table A10, our result are also confirmed, when we replace our measure for
 $\tau _k$
and
 $\overline{\tau }_k$
with the effective corporate tax rates proposed by Vegh and Vuletin (Reference Vegh and Vuletin2015).Footnote
38
Qualitatively, the results hold even when the true model departs from the reference specification (8). As a robustness check, we estimated five additional specifications by modifying the dependence structure of GDP growth on taxation. To start, we assume, in Model II, that fiscal instruments affect the aggregate TFP only, while the other random parameters are free to vary, so that the term
 $\alpha _i$
is replaced by:
 \begin{equation} \tilde{\phi }_i^{A}+\psi _{00}\overline{\tau }_{T,i}+\psi _{01}\overline{\tau }_{w,i}+\psi _{02}\overline{\tau }_{k,i}+\psi _{04}\overline{\log (s_h)}_{i}+\psi _{05}\overline{\log (s_k)}_{i}. \end{equation}
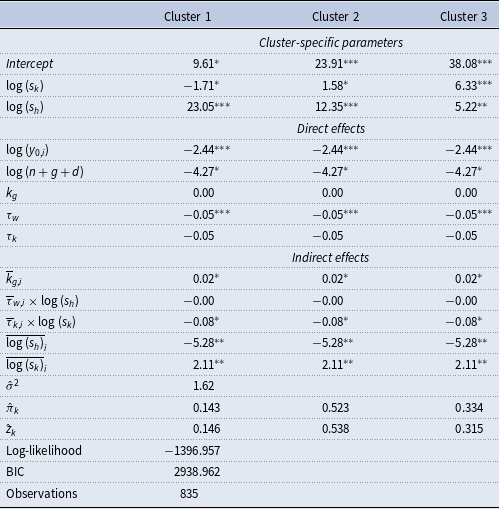
In Model III, we assume that the aggregate TFP is affected by public capital accumulation
 $k_g$
(as a share of national GDP) and mean values of investment shares
 $s_k$
and
 $s_h$
. Since public capital is financed by taxes (and debt), this specification assesses the taxes’ effect on growth by controlling for the potential productive use of tax proceeds. The random parameters associated with
 $s_k$
and
 $s_h$
are described as a function of the income and investment rates as in equation (8) and the term
 $\alpha _i$
is replaced by:
 \begin{equation} \tilde{\phi }_i^{A}+\psi _{00}\overline{k}_{g}+\psi _{01}\overline{\log (s_h)}_{i}+\psi _{02}\overline{\log (s_k)}_{i}. \end{equation}
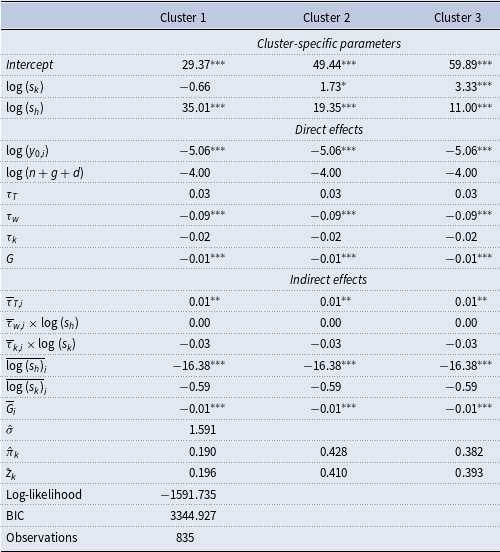
In the same vein, to account for the direct and indirect effects of current public expenditure, we include in Model IV the government spending to GDP ratio (
 $G$
) as follows:Footnote
39
 \begin{align} \gamma _{it} &=\left (\tilde{\phi }_i^{A}+\psi _{00}\overline{\tau }_{T,i}+\psi _{01}\overline{\log (s_h)}_{i}+\psi _{02}\overline{\log (s_k)}_{i}+\psi _{03}\overline{G}_i\right ) +\beta _{0} \log (y_{i0}) \nonumber \\[5pt] &\quad +\left (\tilde{\phi }_i^{h}+\psi _{10}\overline{\tau }_{w,i}+\psi _{12}\overline{\log (s_k)}_{i}\right )\log (s_h)_{it} \\[5pt] &\quad +\left (\tilde{\phi }_i^{k}+\psi _{20}\overline{\tau }_{k,i}+\psi _{21}\overline{\log (s_h)}_{i}\right )\log (s_k)_{it}\nonumber \\[5pt] &\quad + \beta _3\log (n+g+d)_{it}+ \delta _1 \tau _{T,it}+\delta _2 \tau _{w,it}+\delta _3 \tau _{k,it}+\delta _4 G_{it}\varepsilon _{it}.\nonumber \end{align}
Notice that both Model III and Model IV allow to control for the potential simultaneous conflict between growth-enhancing (i.e. tax cuts) fiscal changes and growth-retarding fiscal changes (i.e. the public expenditure reduction induced by fiscal revenues drop).Footnote 40
In Model V, we modify the auxiliary regression in equation (8), by assuming that corporate taxation, reducing firms’ investment in incremental know-how, influences the human capital accumulation, so that the term
 $\beta ^h_i$
is now replaced by:
 \begin{equation} \tilde{\phi }_i^{h}+\psi _{11}\overline{\tau }_{Ti}+\psi _{12}\overline{\tau }_{wi}+\psi _{13}\overline{\tau }_{ki}+\psi _{14}\overline{\log (s_h)}_{i}+\psi _{15}\overline{\log (s_k)}_{i}. \end{equation}
Last, in Model VI, we modify the auxiliary regression in equation (8) and assume that the variability in country-specific parameters for physical capital is partially explained by fiscal policy variables, so that the term
 $\beta ^k_i$
is now replaced by:
 \begin{equation} \tilde{\phi }_i^{k}+\psi _{21}\overline{\tau }_{Ti}+\psi _{22}\overline{\tau }_{wi}+\psi _{23}\overline{\tau }_{ki}+\psi _{24}\overline{\log (s_h)}_{i}+\psi _{25}\overline{\log (s_k)}_{i}. \end{equation}
The results for models specifications (II)–(VI) are presented in Tables A11–A13. The estimation of these models provides similar results in the random part and differences in the tax policy effects. For all model specifications, direct effects are always found to be negative: the coefficient of
 $\tau _w$
ranges in the interval [
 $-0.09$
,
 $-0.05$
], while the coefficient for
 $\tau _k$
ranges in the interval [
 $-0.05$
, 0], even if it is never statistically significant. Moreover, the coefficient for the total tax burden
 $\tau _T$
is never statistically significant. When we restrict the effect of taxation on TFP as in Model II, the coefficient of
 $\tau _w$
is
 $-0.06$
(with a p-value = 0.000), that of
 $\tau _k$
is
 $-0.02$
(with a p-value
 $\gt$
0.05). Regarding the indirect effects on the GDP growth rate, we observe that parameter estimates, often not statistically significant, for the interactions between tax and saving rates reinforce the negative direct effects in model specifications II, III, IV, and V. The coefficient for
 $\tau _k\times \log (s_k)$
is significant (
 $-0.08$
, p-value = 0.05) only in Model III while that for
 $\tau _w\times \log (s_h)$
is significant but positive (0.05, p-value = 0.001) in Model VI, thus compensating the negative direct effect of
 $\tau _w$
(
 $-0.05$
, p-value = 0.000). Finally, estimates for Model IV document a negative direct and indirect impact of public spending on growth (
 $-0.01$
each).
Globally, the results confirm the general negative impact of a higher taxation on GDP growth and suggest that taxation has quite homogenous effects (in magnitude, sign, and significance) among countries. Further research is, however, needed to understand which covariate better discriminates between clusters. We briefly elaborate on this point at the end of the following paragraph.
4.5 Discussion
The models presented so far are (empirical) variations of a neoclassical theme, where per capita GDP growth is assumed to depend on the accumulation of physical and human capital and on the rate of technical changes. Fiscal policy modifications can generate output growth along the transition path; transitions, however, can last for decades.Footnote 41
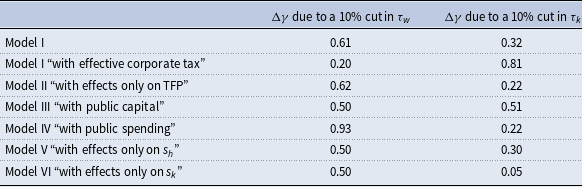
The main message of the present empirical exercise is that, based on different samples and specifications, taxes seem to have some negative effect on growth. Our estimates, however, call into question the size of such harmful effect. Table 5 reports the results of a “what if” exercise, in which we compute the changes in the 5-year average per capita GDP growth rate generated by a ceteris paribus cut by 10% in
 $\tau _w$
and
 $\tau _k$
, respectively. Here we focus only on the direct effects, since the indirect ones are related to the sample means (
 $\overline{\tau }_k$
,
 $\overline{\tau }_w$
and
 $\overline{\tau }_T$
), which are not affected by such una tantum fiscal intervention. Despite the exercise is somewhat moot, it is instructive to quantify the impact of fiscal policy on GDP dynamics and allows to compare our results with those established by the existing literature.Footnote
42
In the baseline model (Model I), these (sizable) tax cuts produce positive effects on growth, being associated with an increase in the GDP growth rate of 0.61% for the cut in
 $\tau _w$
and of 0.32% for the cut in
 $\tau _k$
. Expansionary effects of the same size are found in Model II, where taxes exclusively affect the aggregate TFP, and in Models IV and V, where the indirect effect are only on
 $s_h$
and
 $s_k$
, respectively. When we consider the effective corporate tax provided by Vegh and Vuletin (Reference Vegh and Vuletin2015), the beneficial effect of a cut in
 $\tau _w$
declines a bit (
 $+0.20$
%) while that of a cut in
 $\tau _k$
increases dramatically (
 $+0.81$
%). Such expansionary effects can be due to the fact that, in this hypothetical scenario, tax cuts are implemented keeping the level of public spending constant. However, including the public spending among the covariates, allowing for both direct and indirect effects of it as we do in Model IV, further increases the positive effect of
 $\gamma$
of a cut in
 $\tau _w$
(
 $+0.93$
%), while the impact of a cut in
 $\tau _k$
is substantially unchanged. These results partially contrast with those of Lee and Gordon (Reference Lee and Gordon2005), who find a virtually zero impact for the cut in
 $\tau _w$
and a more beneficial effect for the cut in
 $\tau _k$
(around a 1.8% increase in the GDP growth rate).
In our set-up, where taxation has a direct effect on growth through the TFP and an indirect effect through the saving rates, tax cuts are beneficial for growth. Despite being focused only on the direct effects, the simple “what if” exercise presented above clearly indicates the detrimental role of taxation on personal income. To understand why a cut on personal income tax is generally found to be more beneficial than a cut on corporate tax rate it must be considered that
 $\tau _w$
is not exclusively related to labor income (despite its base is largely determined by wages and salaries). This implies that changes in
 $\tau _w$
actually affect GDP dynamics through both the interaction between leverage and dividend taxation and, for instance, its impact on investment in intangibles.Footnote
43
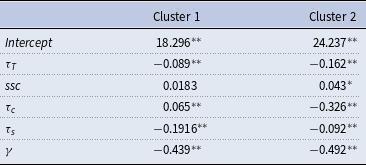
Last, to give further insights on the mixture components, we estimated a Multinomial Logit Model to assess the role of some explanatory variables in describing cluster membership; here, Cluster 1 is taken as the reference. The model evaluates the relative probability of being in the two remaining clusters versus the reference, using a linear combination of explanatory variables. The obtained ML estimates represent the discriminating power of every covariate when we look at the log-odds of being in any other cluster versus the reference one. We consider the total tax burden (
 $\tau _T$
), the tax on sales (
 $\tau _s$
), the tax on consumption (
 $\tau _c$
) and the social security contributions (
 $ssc$
) for this purpose. Results in Table 6 indicate the estimated log-odds of being in each cluster. Tax on consumption increase the odds to be in Clusters 1–2, the social contribution increases the probability to belong to Cluster 2, while an increase on the tax on sales increases the probability to belong to the reference one.
Multinomial Logit Model estimates for cluster membership

Significance:
 $^{***}\;:\;$
0.001,
 $^{**}\;:\;$
0.01,
 $^{*}\;:\;$
0.05.
5. Concluding remarks
In this paper, we propose and estimate an augmented Solow model to test the effects of taxation on growth. The model allows for heterogeneity in the intercept and the effects associated with capital (both physical and human) savings rates. Sources of unobserved heterogeneity are partially explained by country-specific taxation characteristics, through an auxiliary regression, controlling for potential endogeneity. In the FMM, the random intercept captures country-specific institutional features, while the random parameters for investment shares
 $s_k$
and
 $s_h$
are influenced by some fiscal policy variables, such as the personal income tax rate and the corporate income tax rate.
Taxes affect the GDP growth both directly and indirectly. Direct effects refer to the impact that taxation has on the level of technology while indirect effects arise from the results of the interaction between (average) tax rates and (average) aggregate saving rates. By analyzing a variety of model specifications, we document a positive impact of tax cuts on real income dynamics. The effects are quite homogenous across countries. Our results are robust to changes in the analyzed period and to modifications of the reference empirical model.
Appendix
A. ML parameter estimation
Our specification includes unobserved country-specific heterogeneity through cluster-specific parameters. As discussed by Aitkin et al. (Reference Aitkin, Francis and Hinde2005), through this approach, we may consider several sources of model misspecification, ranging from omitted covariates, to wrong assumptions on either the link function or the conditional response distributions (e.g. Cobb-Douglas vs CES production function).
Using equation (7) and assuming conditional independence for the measurements corresponding to the same country, the probability density function for the country profile
 $\boldsymbol{\gamma }_{i}$
can be written as
Variable definition and source

Explanatory statistics (mean values) for used variables, 1965–2010

 \begin{equation*} f\left (\boldsymbol{\gamma }_i \mid \textbf{x}_{i}, \tilde{{\phi }}_{i}\right )=\prod _{t=1}^{T} \left \{\frac{1}{\sqrt{2\pi \sigma ^2}} \exp \left [-\frac{1}{2 \sigma ^2} \left (\gamma _{it}-\mu ^{\gamma }_{it} \right )^2\right ] \right \}. \end{equation*}
Let us assume that
 $\tilde{{\phi }}_{i} \sim g(\!\cdot\!)$
; treating the latent effects as nuisance parameters and integrating them out, we obtain the following expression for the marginal likelihood
Within-country correlation between growth rate of per capita GDP and fiscal policy variables

 \begin{equation} L\left (\cdot \right )=\prod \limits _{i=1}^{n}\left \{ \int _{\mathcal{\Phi }}f(\gamma _i \mid \textbf{x}_{i}, \tilde{{\phi }}_{i})\text{d}G(\tilde{{\phi }_i}|{\textbf{x}_i})\right \}\simeq \prod \limits _{i=1}^{n}\left \{ \int _{\mathcal{\Phi }}f(\gamma _i \mid \textbf{x}_{i}, \tilde{{\phi }}_{i})\text{d}G(\tilde{{\phi }_i})\right \}, \end{equation}
since, as we showed before,
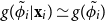 $g(\tilde{{\phi }_i}|{\textbf{x}_i})\simeq g(\tilde{{\phi }_i})$
. Rather than using a parametric specification, we leave for
 $G(\!\cdot\!)$
unspecified and provide a nonparametric maximum likelihood estimator for this term, see Laird (Reference Laird1978) and Lindsay (Reference Lindsay1983a, Reference Lindsay1983b). According to such an approach, see Lindsay and Lesperance (Reference Lindsay and Lesperance1995) for a review, the integral in eq (18) may be approximated by the following weighted sum
 \begin{equation} L\left (\cdot \right ) = \prod \limits _{i = 1}^{n} \left \{\sum \limits _{k = 1}^K f(\boldsymbol{\gamma }_i \mid \textbf{x}_{i}, \boldsymbol{\zeta }_{k}) \pi _k \right \}=\prod \limits _{i = 1}^{n} \left \{\sum \limits _{k = 1}^K f_{ik}\pi _k \right \}, \end{equation}
where, as mentioned above,
 $\tilde{{\phi }}_{i} \sim \sum _{k=1}^{K} \pi _{k} \delta _k(\boldsymbol{\zeta }_{k})$
,
 $K$
is the number locations
 $\boldsymbol{\zeta }_{k}$
,
 $k=1,\ldots,K$
(see McLachlan and Peel, Reference McLachlan and Peel2000). The likelihood in equation (19) resembles the likelihood for a finite mixture of regression models, where groups of countries are associated with specific values of parameters. Since component memberships are unobserved, they may be thought of as missing data. For a fixed number of components
 $K$
, we denote by
 $\textbf{z}_{i}=(z_{i1},\ldots,z_{iK})$
the latent component-indicator vector, with elements
 \begin{equation} z_{ik}=\left \{ \begin{array}{cc} 1& \rm{if} \; \boldsymbol{\tilde{\phi }}_{i}=\boldsymbol{\zeta }_k,\\[5pt] 0 & \rm{otherwise}.\\[5pt] \end{array}\right. \end{equation}
where this source of heterogeneity was observed, the indicator variables would be known, and the model would reduce to a simple GLM regression model with group-specific parameters. The hypothetical space defined by the complete data problem is given by
 $(\boldsymbol{\gamma }_i,\textbf{x}_{i}, \textbf{z}_{i})$
. Using a multinomial distribution for the unobserved vector of component indicators,
 $\textbf{z}_{i}$
, the log-likelihood for the complete data can be written as
 \begin{equation} \ell _c\left (\cdot \right ) = \sum \limits _{i = 1}^{n}\sum \limits _{k = 1}^{K} z_{ik}\left \{\log (\pi _{k} )+\log f_{ik} \right \}. \end{equation}
By taking derivatives with respect to the vector of model parameters,
 $\theta$
, we obtain
 \begin{equation} \frac{\partial \log [L \left (\theta \right )]}{\partial \theta }=\frac{\partial \ell \left (\theta \right )}{\partial \theta }=\sum \limits _{i=1}^{n}\sum \limits _{k=1}^{K}\frac{\pi _{k}f_{ik}}{\sum \limits _{k=1}^{K}\pi _{k}f_{ik}} \frac{\partial \log f_{ik}}{\partial \theta }=\sum \limits _{i=1}^{n}\sum \limits _{k=1}^{K} \hat{z}_{ik}\frac{\partial \log f_{ik}}{\partial \theta }, \end{equation}
where
 $\hat{z}_{ik}$
represents the posterior probability that the
 $i$
-th country comes from the
 $k-th$
component of the mixture,
 $f_{ik}=f(\boldsymbol{\gamma }_i \mid \boldsymbol{\zeta }_{k})$
denotes the response distribution in that component,
 $k=1,\ldots,K$
,
 $i=1,\ldots,n$
, and
 $\theta =(\alpha _i, \beta ^h_i, \beta ^k_i, \Sigma _\phi )$
. The corresponding likelihood equations are weighted sums of those for an ordinary regression model with log link and weights
 $\hat{\textbf{z}}_{ik}$
. Solving these equations for a given set of weights and updating the weights from the current parameter estimates define an EM algorithm, see for example McLachlan and Peel (Reference McLachlan and Peel2000).
Alfò et al. (Reference Alfò, Trovato and Waldmann2008) describes the EM algorithm in the context of Solow growth models. The mixture model explicitly considers country-specific growth paths, without any need to define, a priori, any threshold. It helps capture the country-specific structure, allowing for correlation between observed covariates and country-specific random parameters. A side result of FMM is that it can provide a partition of countries in clusters characterized by homogeneous unobserved characteristics, based on the posterior probabilities
 $\hat{z}_{ik}$
. According to a simple maximum a posteriori (MAP) rule, in fact, the
 $i$
-th country can be classified into the
 $l$
-th component if
 \begin{equation*} \hat {z}_{il}=\max (\hat {z}_{i1}, \ldots, \hat {z}_{iK}). \end{equation*}
Model I, equation (9) “with effective corporate tax rate”

Significance levels:
 $^{***}\;:\;$
0.001,
 $^{**}\;:\;$
0.01,
 $^{*}\;:\;$
0.01. Dependent variable: Real GDP growth rate computed as
 $(1/T)\times (\log (y)_{it}-\log (y)_{it-1})$
. See Table A7 in the Appendix for tax variables definition and sources. In this model,
 $\tau _k$
is the effective standard corporate tax rate provided by Vegh and Vuletin (Reference Vegh and Vuletin2015).Note:
 $\hat{\sigma }^2$
, variance of the random terms;
 $\hat{\pi }_k$
, estimated prior probabilities;
 $\hat{z}_k$
, estimated posterior probabilities. See Table A7 in the Appendix for tax variables definition and sources.
It is worth noticing that each component is characterized by homogeneous values of the estimated latent effects; that is, conditionally on the observed covariates, countries from the same group show a similar structure, at least in the steady state. Penalized likelihood criteria such as Akaike information criterion (Akaike, Reference Akaike and Akaike1973), BIC (Schwarz, Reference Schwarz1978) or Consistent Akaike information criterion (Bodzogan, Reference Bodzogan and Bodzogan1994) can be used to choose the number of mixture components used to approximate the (potentially continuous) distribution of the random parameters. Usually, attempts to estimate the model with too many components result either in one mass having an estimated probability approaching zero or two masses having nearly the same estimated location.

Significance levels:
 $^{***}\;:\;$
0.001,
 $^{**}\;:\;$
0.01,
 $^{\ast}\;:\;$
0.05. Dependent variable: Real GDP growth rate computed as
 $(1/T)\times (\log (y)_{it}-\log (y)_{it-1})$
. See Table A7 for tax variables definition and sources.Note:
 $\hat{\sigma }^2$
, variance of the random terms;
 $\hat{\pi }_k$
, estimated prior probabilities;
 $\hat{z}_k$
, estimated posterior probabilities.

Significance levels:
 $^{***}\;:\;$
0.001,
 $^{**}\;:\;$
0.01,
 $^{*}\;:\;$
0.05. Dependent variable: Real GDP growth rate computed as
 $(1/T)\times (\log (y)_{it}-\log (y)_{it-1})$
. See Table A7 for tax variables definition and sources.Note:
 $\hat{\sigma }^2$
, variance of the random terms;
 $\hat{\pi }_k$
, estimated prior probabilities;
 $\hat{z}_k$
, estimated posterior probabilities.
Model IV, “with public spending,” equation (15)

Significance levels:
 $^{***}\;:\;$
0.001,
 $^{**}\;:\;$
0.01,
 $^{*}\;:\;$
0.05. Dependent variable: Real GDP growth rate computed as
 $(1/T)\times (\log (y)_{it}-\log (y)_{it-1})$
. See Table A7 for tax variables definition and sources.Note:
 $\hat{\sigma }^2$
, variance of the random terms;
 $\hat{\pi }_k$
, estimated prior probabilities;
 $\hat{z}_k$
, estimated posterior probabilities.


Significance levels:
 $^{***}\;:\;$
0.001,
 $^{**}\;:\;$
0.01,
 $^{*}\;:\;$
0.05. Dependent variable: Real GDP growth rate computed as
 $(1/T)\times (\log (y)_{it}-\log (y)_{it-1})$
. See Table A7 for tax variables definition and sources.Note:
 $\hat{\sigma }^2$
, variance of the random terms;
 $\hat{\pi }_k$
, estimated prior probabilities;
 $\hat{z}_k$
, estimated posterior probabilities.


Significance levels:
 $^{***}\;:\;$
0.001,
 $^{**}\;:\;$
0.01,
 $^{*}\;:\;$
0.05. Dependent variable: Real GDP growth rate computed as
 $(1/T)\times (\log (y)_{it}-\log (y)_{it-1})$
. See Table A7 for tax variables definition and sources.Note:
 $\hat{\sigma }^2$
, variance of the random terms;
 $\hat{\pi }_k$
, estimated prior probabilities;
 $\hat{z}_k$
, estimated posterior probabilities.