Family, twin, adoption, and molecular genetic studies have demonstrated that almost all psychiatric and substance use disorders are influenced, often substantially so, by genetic risk factors (Smoller et al., Reference Smoller, Andreassen, Edenberg, Faraone, Glatt and Kendler2019). Many clinical and epidemiological studies have also demonstrated that comorbidity is more the rule than the exception for psychiatric disorders (Kessler, Reference Kessler, Wetzler and Sanderson1997; Kessler et al., Reference Kessler, McGonagle, Carnelley, Nelson, Farmer, Regier and Leaf1993, Reference Kessler, Ormel, Petukhova, McLaughlin, Green, Russo and Ustun2011; Kessler, Chiu, Demler, Merikangas, & Walters, Reference Kessler, Chiu, Demler, Merikangas and Walters2005) – that is, in both epidemiological and clinical populations, most pairs of psychiatric and/or substance use disorders co-occur at rates substantially higher than expected by chance. Many approaches have been taken to try to understand the possible causes of this comorbidity (Klein & Riso, Reference Klein, Riso and Costello1993; Neale & Kendler, Reference Neale and Kendler1995). Genetic approaches to examining comorbidity have been typically limited to the examination of co-aggregation in family studies and genetic correlations in twin and molecular genetic designs sometimes between pairs of disorders (e.g. Consortium(PGC-CDG), 2013; Slutske et al., Reference Slutske, Eisen, True, Lyons, Goldberg and Tsuang2000) and sometimes multiple disorders assessed by various forms of structural equation modeling (e.g. Cross-Disorder Group of the Psychiatric Genomics Consortium, 2019; Kendler et al., Reference Kendler, Aggen, Knudsen, Roysamb, Neale and Reichborn-Kjennerud2011; Waldman, Poore, Luningham, & Yang, Reference Waldman, Poore, Luningham and Yang2020). While multivariate twin studies have often been conducted on epidemiological samples where multiple disorders are assessed in the twins, multivariate molecular genetic studies typically obtain results from case–control designs where the case samples are selected for having a single disorder, sometimes utilizing a diagnostic hierarchy, and few comorbid disorders are systematically assessed. An ideal population in which to further our understanding of the genetic contributions to comorbidity would be genetically informative, large, representative, and contain information on the presence or absence of a wide variety of psychiatric and substance use disorders.
In this paper, we examine such a cohort, the general population of Sweden which contains detailed information about psychiatric and substance use disorders from high-quality population registries and where genetic risk is available using the recently developed and validated measure: the family genetic risk score (FGRS) (Kendler, Ohlsson, Sundquist, & Sundquist, Reference Kendler, Ohlsson, Sundquist and Sundquist2021a, Reference Kendler, Ohlsson, Sundquist and Sundquistb) (Kendler, Ohlsson, Sundquist, & Sundquist, Reference Kendler, Ohlsson, Sundquist and Sundquistin press). (None of these prior reports examined the impact of comorbidity on the patterns of FGRS across disorders.) The FGRS is an estimate of genetic risk calculated from the degree of disease in close and distant relatives and is not equivalent to a molecular polygenic risk score (PRS). It includes an approximate correction for cohabitation effects and genetic information not contained in a PRS. Importantly, it is available to the entire population of Sweden.
We examine eight disorders: major depression (MD), anxiety disorders (AD), alcohol use disorder (AUD), drug use disorder (DUD), attention deficit-hyperactivity disorder (ADHD), autism spectrum disorder (ASD), obsessive−compulsive disorder (OCD), bipolar disorder (BD) and schizophrenia (SZ). From these disorders, we choose 10 pairs for a detailed examination of the patterns of comorbidity. We examine everyone in the general Swedish population with disorder A only, disorder B only and those diagnosed with both disorders. We then compare and contrast the FGRS profiles of individuals in these three groups. These profiles contain eight representative diagnoses, two each from internalizing, psychotic, substance use and developmental psychiatric disorders.
Many potential etiologic models have been presented for the origins of comorbidity (e.g. Klein & Riso, Reference Klein, Riso and Costello1993; Neale & Kendler, Reference Neale and Kendler1995) but the goals of this paper are not to utilize model-fitting or other complex statistical models; instead, we will first describe and attempt to understand the patterns of observed results.
Methods
We collected information on individuals from Swedish population-based registers with national coverage linking each person's unique personal identification number which, to preserve confidentiality, was replaced with a serial number by Statistics Sweden. We secured ethical approval for this study from the Regional Ethical Review Board in Lund (No. 2008/409; 2012/795) and the Swedish Ethical Review Authority (No. 2019/01588; 2019/03278).
Our database consisted of all individuals born in Sweden between 1932 and 1995 of parents themselves born in Sweden. In the database, we included the date of registration for MD, AD, OCD, BD, SZ, AUD, DUD, ADHD, and ASD, utilizing ICD-8, 9,10 codes from Swedish national primary care, specialist and hospital registries as well as information from Prescription and Criminal registers for AUD and DA (see appendix Table 1 for details). We also included individual familial genetic risk scores (FGRSs) for all disorders. The FGRS is an estimate of an individual's genetic liability that reflects the relative lack or excess of disease in their pedigree relative to population expectations. The FGRSs were based on selected 1st through 5th-degree relatives to the probands with a mean of 40.1 relatives per proband. Briefly (see appendix Table 2 for details), we first calculated the morbid risk for the phenotype in our sample of relatives based on age at first registration and then we transformed the binary disorder into an underlying liability distribution, with the threshold that divides the population into the two categories for the disorder. Thereafter, we calculated the mean Z-score for individuals with the disorder and the mean Z-score for individuals without the disorder. For first-degree relatives, we also multiplied the z-score with a factor that sought to eliminate the influence of cohabitation effects (i.e. “shared environment”) separately for siblings and parent-offspring pairs. Within each type of relative, we then had two components: the sum of the z-score and the total weighted number of relatives. These two components were weighted according to the genetic resemblance to the proband. For each proband, we summed the two components across all groups of relatives and used the quotient between the two components. Finally, to obtain the individual GRS, we multiplied the quotient with a shrinkage factor based on the variance of the z-score across all relatives, the variance in the mean z-score across all probands, and the number of the weighted number of relatives for each proband. So that the GRSs would be more comparable across disorders and to reduce the effect of register coverage, we standardized the GRS by year of birth into a z-score with mean = 0 and s.d. = 1.
From the database, we created 10 pairings of disorders designed to be representative of the various diagnostic groupings: MD/AD, AUD/DUD, ADHD/ASD, AD/OCD, DUD/ADHD, MD/AUD, AD/SZ, MD/ASD, DUD/SZ, AUD/BD. Within each subsample, we included the individual FGRSs for all eight disorders (adding OCD to the one pairing in which it was contained). We calculated the mean FGRS for individuals with disorder A only, disorder B only and the comorbid cases. We then compared the mean FGRS among individuals with disorder A or B only with the mean FGRS among comorbid cases. All analyses were performed using SAS 9.4 (SAS Institute, 2012).
Results
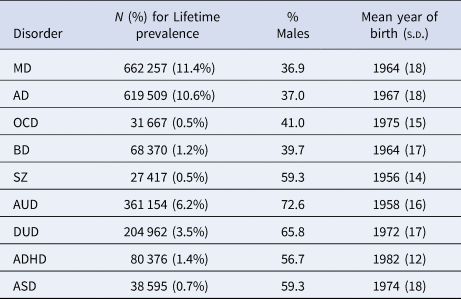
The cohort included 5 828 760 individuals with a mean (s.d.) age at end of follow-up of 54.4 (18.1). Table 1 provides, for the nine examined disorders, the lifetime prevalence rates, the percent males and their mean (s.d.) year of birth. The prevalences vary from 0.5% (SZ and OCD) to 11.4% for MD. We observe the expected female preponderance in MD, AD, OCD and BD and the male preponderance in the other disorders.
Prevalence, % males and mean year of birth for the nine disorders examined in the paper

Analyses of pairs
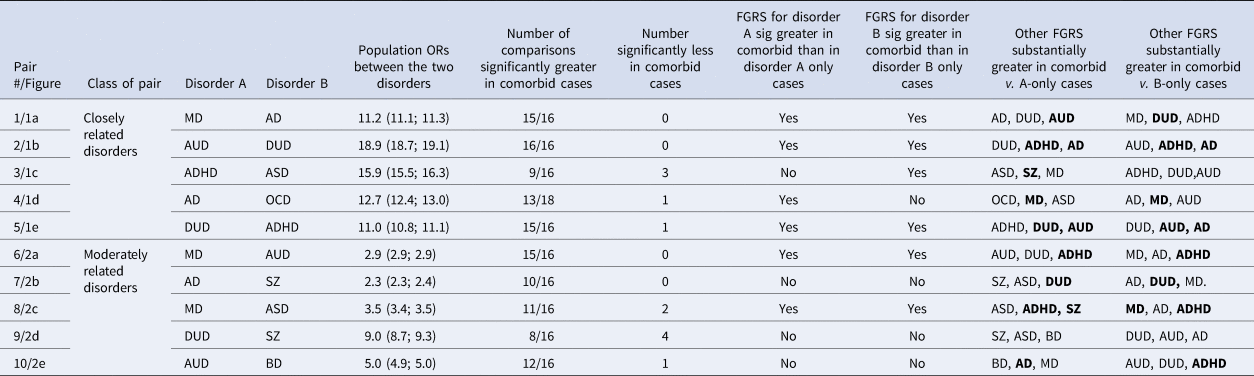
As illustrated in Table 2, we present results from 10 diverse pairs of disorders divided into two groups: five pairs termed “closely related” with a population-based odds ratio (OR) of >10 and five pairs we call “moderately related”, with an OR of <5 for 4 of the pairs (and 9.0 for DUD and SZ). For each pair, we present, in a figure, the FGRS profile for cases with (i) disorder A-only, (ii) disorder B-only and (iii) the comorbid cases – that is those with both disorder A and disorder B. All these figures also contain two numbers under each column in the disorder A-only and disorder B-only FGRS profiles. The first is the signed difference between that FGRS and the same FGRS in the comorbid group. The second number is the p value of that difference where we adopt a p < 0.0001 as a guide to significance. We use the term primary FGRS to refer to the FGRS for the disorder examined. That is, in examining MD cases, the FGRSMD is their primary FGRS.
Pattern of results in the 10 different disorder pairings examined in this paper

Int − Internalizing; Ext – Externalizing. MD − major depression, AD − anxiety disorders, AUD − alcohol use disorder, DUD − drug use disorder, ADHD − attention deficit-hyperactivity disorder, ASD − autism spectrum disorder, OCD − obsessive−compulsive disorder, SZ − schizophrenia, and BD − bipolar disorder. Sig −– significantly.
Closely related pairs of disorders
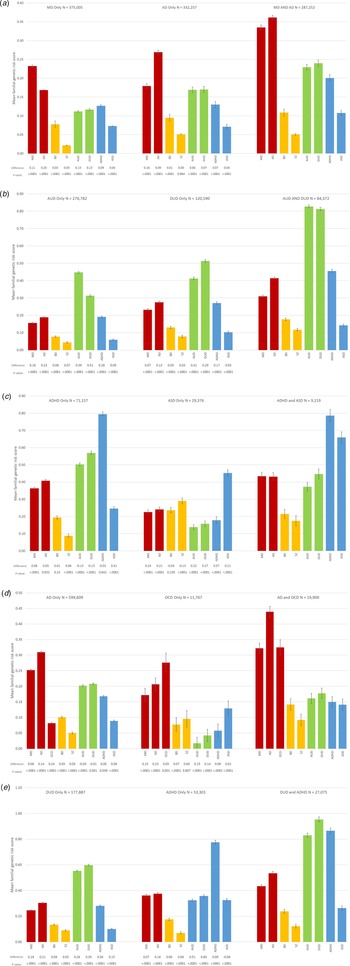
Results for all our pairings are summarized in Table 2. Pair 1 includes two classical internalizing disorders MD and AD (Fig. 1a), where the comorbid group had significantly greater FGRS scores for 15/16 comparisons (all but the FGRSSZ in AD). In particular, the two primary FGRS are substantially higher in the comorbid than the two solo disorder groups. Comparing the comorbid to the MD-only group, the largest increases were seen for the FGRS for AD, DUD, and AUD. Comparing the comorbid to the AD only group, the largest increases were seen for MD, DUD and ADHD FGRS.
(a). The mean standardized family genetic risk scores (FGRS) (± 95% confidence intervals) for major depression (MD), anxiety disorders (AD), bipolar disorder (BD), schizophrenia (SZ), alcohol use disorder (AUD), drug use disorder (DUD), attention deficit-hyperactivity disorder (ADHD) and autism spectrum disorder (ASD) in individuals with MD only, AD only and those with both MD and AD – the comorbid cases. The sample size of these three groups is provided at the top of the figure. These FGRS scores are depicted on the Y-axis. The colors/shades of the columns reflect the class of the disorders: Red/Black – Internalizing, Yellow/Dark Gray – Psychotic, Green/Medium Gray – Substance Use, and Blue/Light Gray – Developmental. Under each column for the MD only and AD only samples, we list the signed magnitude of the difference observed between that FGRS and the parallel one for the comorbid cases, with a positive difference reflecting a higher FGRS in the comorbid sample. The second number reflects the p value of the difference. Given the large number of tests performed, we set a p < 0.0001 as a threshold for statistical significance. (b). The mean standardized FGRS (± 95% confidence intervals) for MD, AD, BD, SZ, AUD, DUD, Attention Deficit-Hyperactivity Disorder (ADHD) and ASD in individuals with AUD only, DUD only and those with both AUD and MD – the comorbid cases. The sample sizes of these three groups are provided at the top of the figure. These FGRS scores are depicted on the Y-axis. The colors/shades of the columns reflect the class of the disorders: Red/Black – Internalizing, Yellow/Dark Gray – Psychotic, Green/Medium Gray – Substance Use, and Blue/Light Gray – Developmental. Under each column for the AUD only and DUD only samples, we list the signed magnitude of the difference observed between that FGRS and the parallel one for the comorbid cases, with a positive difference reflecting a higher FGRS in the comorbid sample. The second number reflects the p value of the difference. Given the large number of tests performed, we set a p < 0.0001 as a threshold for statistical significance. (c). The mean standardized FGRSs (± 95% confidence intervals) for MD, AD, BD, SZ, AUD, DUD, Attention Deficit-Hyperactivity Disorder (ADHD) and ASD in individuals with ADHD only, ASD only and those with both ADHD and ASD – the comorbid cases. The sample sizes of these three groups are provided at the top of the figure. These FGRS scores are depicted on the Y-axis. The colors/shades of the columns reflect the class of the disorders: Red/Black – Internalizing, Yellow/Dark Gray – Psychotic, Green/Medium Gray – Substance Use, and Blue/Light Gray – Developmental. Under each column for the ADHD only and ASD only samples, we list the signed magnitude of the difference observed between that FGRS and the parallel one for the comorbid cases, with a positive difference reflecting a higher FGRS in the comorbid sample. The second number reflects the p value of the difference. Given the large number of tests performed, we set a p < 0.0001 as a threshold for statistical significance. (d). The mean standardized FGRSs (± 95% confidence intervals) for MD, AD, obsessive−compulsive disorder (OCD), BD, SZ, AUD, DUD, Attention Deficit-Hyperactivity Disorder (ADHD) and ASD in individuals with AD only, OCD only and those with both AD and OCD – the comorbid cases. The sample sizes of these three groups are provided at the top of the figure. These FGRS scores are depicted on the Y-axis. The colors/shades of the columns reflect the class of the disorders: Red/Black – Internalizing, Yellow/Dark Gray – Psychotic, Green/Medium Gray – Substance Use, and Blue/Light Gray – Developmental. Under each column for the AD only and OCD only samples, we list the signed magnitude of the difference observed between that FGRS and the parallel one for the comorbid cases, with a positive difference reflecting a higher FGRS in the comorbid sample. The second number reflects the p value of the difference. Given the large number of tests performed, we set a p < 0.0001 as a threshold for statistical significance. (e). The mean standardized FGRSs (± 95% confidence intervals) for MD, AD, BD, SZ, AUD, DUD, ADHD and ASD in individuals with DUD only, ADHD only and those with both DUD and ADHD – the comorbid cases. The sample sizes of these three groups are provided at the top of the figure. These FGRS scores are depicted on the Y-axis. The colors/shades of the columns reflect the class of the disorders: Red/Black – Internalizing, Yellow/Dark Gray – Psychotic, Green/Medium Gray – Substance Use, and Blue/Light Gray – Developmental. Under each column for the DUD only and ADHD only samples, we list the signed magnitude of the difference observed between that FGRS and the parallel one for the comorbid cases, with a positive difference reflecting a higher FGRS in the comorbid sample. The second number reflects the p value of the difference. Given the large number of tests performed, we set a p < 0.0001 as a threshold for statistical significance.

Our second pairing was made up of the two substance use-externalizing disorders: AUD and DUD (Fig. 1b). The comorbid group has significantly greater FGRS scores for all comparisons with the AUD-only and DUD-only groups and the two primary FGRS were both considerably higher in the comorbid than solo disorder groups. Comparing the comorbid to the AUD-only group, the largest other increases in FGRS were seen for DUD, ADHD and AD. Comparing the comorbid to the DUD-only group, the largest other increases were seen for the FGRS for AUD, ADHD and AD.
Pair 3 examined two related developmental disorders: ADHD and ASD (Fig. 1c). The comorbid group had significantly greater FGRS scores for 9/16 comparisons. The FGRSADHD was not increased (and in fact was non-significantly lower) in the comorbid v. ADHD-only group while the FRGSASD was significantly higher in the comorbid v. the ASD-only group. Comparing the comorbid to the ADHD-only group, the largest other increases in FGRS were seen for ASD, MD, and SZ. Comparing the comorbid to the ASD-only group, the largest FGRS increases were seen for ADHD, DUD and MD. Of note, three FGRS were significantly lower in the comorbid groups than in the solo groups: FGRSAUD and FGRSDUD in ADHD-only group and FGRSSZ in the ADHD-only group.
Our 4th pairing examined a different pairing of internalizing disorders – AD and OCD (Fig. 1d). The comorbid group had significantly greater FGRS scores for 13 of 18 comparisons. Of the five exceptions to this typical finding, three came from the AD-only and two from the OCD-only cases. The comorbid group had a large and significant increase in FGRSAD compared to the AD-only group, but no significant increase in the FGRSOCD compared to the OCD-only group. Comparing the comorbid to the AD-only group, the largest other increases in FGRS were seen for OCD, MD, and ASD. Comparing the comorbid to the AD-only group, the largest FGRS increases were seen for MD, AUD and DUD.
Pair 5 examined the pairing of an adult externalizing disorders DUD and a developmental disorder often considered part of the externalizing spectrum - ADHD (Fig. 1e). The comorbid group has significantly greater FGRS scores for 15/16 comparisons with the AUD-only and DUD-only groups. The two primary FGRS were both considerably and significantly higher in the comorbid than solo disorder groups. Comparing the comorbid to the DUD-only group, the largest other increases in FGRS were seen for ADHD, AUD and AD. Comparing the comorbid to the ADHD only group, the largest other increases were seen for the FGRS for DUD, AUD, and AD.
Moderately Related pairs
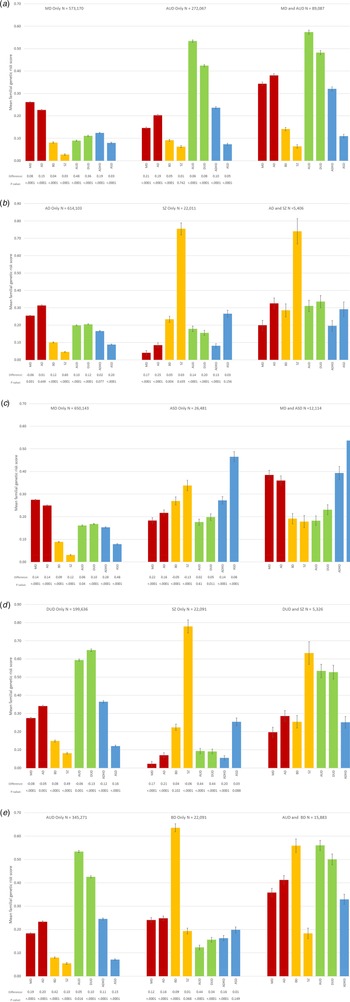
Pair 6 included a typical internalizing disorder (MD) and a typical externalizing disorder (AUD) (Fig. 2a). The comorbid group had significantly greater FGRS scores for 15/16 comparisons with the MD-only and ADU-only groups. The two primary FGRS were both considerably and significantly higher in the comorbid than single disorder groups. Comparing the comorbid to the MD-only group, the largest other increases in FGRS were seen for AUD, DUD and ADHD. Comparing the comorbid to the AUD only group, the largest other increases were seen for the FGRS for MD, AD and ADHD.
(a). The mean standardized family genetic risk scores (FGRSs) (± 95% confidence intervals) for major depression (MD), anxiety disorders (AD), bipolar disorder (BD), schizophrenia (SZ), alcohol use disorder (AUD), drug use disorder (DUD), attention deficit-hyperactivity disorder (ADHD) and autism spectrum disorder (ASD) in individuals with MD only, AUD only and those with both MD and AUD – the comorbid cases. The sample sizes of these three groups are provided at the top of the figure. These FGRS scores are depicted on the Y-axis. The colors of the columns reflect the class of the disorders: Red/Black – Internalizing, Yellow/Dark Gray – Psychotic, Green/Medium Gray – Substance Use, and Blue/Light Gray – Developmental. Under each column for the MD only and AUD only samples, we list the signed magnitude of the difference observed between that FGRS and the parallel one for the comorbid cases, with a positive difference reflecting a higher FGRS in the comorbid sample. The second number reflects the p value of the difference. Given the large number of tests performed, we set a p < 0.0001 as a threshold for statistical significance. (b). The mean standardized FGRS (± 95% confidence intervals) for MD, AD, BD, SZ, AUD, DUD, Attention Deficit-Hyperactivity Disorder (ADHD) and ASD in individuals with AD only, SZ only and those with both AD and SZ – the comorbid cases. The sample sizes of these three groups are provided at the top of the figure. These FGRS scores are depicted on the Y-axis. The colors of the columns reflect the class of the disorders: Red/Black – Internalizing, Yellow/Dark Gray – Psychotic, Green/Medium Gray – Substance Use, and Blue/Light Gray – Developmental. Under each column for the AD only and SZ only samples, we list the signed magnitude of the difference observed between that FGRS and the parallel one for the comorbid cases, with a positive difference reflecting a higher FGRS in the comorbid sample. The second number reflects the p value of the difference. Given the large number of tests performed, we set a p < 0.0001 as a threshold for statistical significance. (c). The mean standardized FGRSs (± 95% confidence intervals) for MD, AD, BD, SZ, AUD, DUD, ADHD and ASD in individuals with MD only, ASD only and those with both MD and ASD – the comorbid cases. The sample sizes of these three groups are provided at the top of the figure. These FGRS scores are depicted on the Y-axis. The colors of the columns reflect the class of the disorders: Red/Black – Internalizing, Yellow/Dark Gray – Psychotic, Green/Medium Gray – Substance Use, and Blue/Light Gray – Developmental. Under each column for the MD only and ASD only samples, we list the signed magnitude of the difference observed between that FGRS and the parallel one for the comorbid cases, with a positive difference reflecting a higher FGRS in the comorbid sample. The second number reflects the p value of the difference. Given the large number of tests performed, we set a p < 0.0001 as a threshold for statistical significance. (d). The mean standardized FGRSs (± 95% confidence intervals) for MD, AD, BD, SZ, AUD, DUD, ADHD and ASD in individuals with DUD only, SZ only and those with both DUD and SZ– the comorbid cases. The sample sizes of these three groups are provided at the top of the figure. These FGRS scores are depicted on the Y-axis. The colors of the columns reflect the class of the disorders: Red/Black – Internalizing, Yellow/Dark Gray – Psychotic, Green/Medium Gray – Substance Use, and Blue/Light Gray – Developmental. Under each column for the DUD only and SZ only samples, we list the signed magnitude of the difference observed between that FGRS and the parallel one for the comorbid cases, with a positive difference reflecting a higher FGRS in the comorbid sample. The second number reflects the p value of the difference. Given the large number of tests performed, we set a p < 0.0001 as a threshold for statistical significance. (e). The mean standardized FGRSs (± 95% confidence intervals) for MD, AD, BD, SZ, AUD, DUD, ADHD and ASD in individuals with AUD only, BD only and those with both AUD and BD – the comorbid cases. The sample sizes of these three groups are provided at the top of the figure. These FGRS scores are depicted on the Y-axis. The colors of the columns reflect the class of the disorders: Red/Black – Internalizing, Yellow/Dark Gray – Psychotic, Green/Medium Gray – Substance Use, and Blue/Light Gray – Developmental. Under each column for the AUD only and BD only samples, we list the signed magnitude of the difference observed between that FGRS and the parallel one for the comorbid cases, with a positive difference reflecting a higher FGRS in the comorbid sample. The second number reflects the p value of the difference. Given the large number of tests performed, we set a p < 0.0001 as a threshold for statistical significance.

Our 7th pairing included an internalizing disorder AD and a classical psychotic disorder: SZ (Fig. 2b). The comorbid group had significantly greater FGRS scores for 10/16 comparisons with the AD-only and SZ-only groups. Neither of the two primary FGRS were significantly elevated in the comorbid v. the solo disorder groups. Comparing the comorbid to the AD-only group, the largest increases in FGRS were seen for SZ, ASD and DUD. Comparing the comorbid to the SZ only group, the largest increases were seen for the FGRS for AD, DUD and MD.
Our 8th pair examined an internalizing disorder MD and a developmental disorder ASD (Fig. 2c) where the comorbid group has significantly greater FGRS scores for 11/16 comparisons with the MD-only and ASD-only groups. The two primary FGRS were both considerably and significantly higher in the comorbid than in the solo disorder groups. Comparing the comorbid to the MD-only group, the largest other increases in FGRS were seen for ASD, ADHD and MD. Comparing the comorbid to the ASD-only group, the largest other increases were seen for the FGRS for MD, AD and ADHD.
Our 9th pair included an externalizing disorder DUD and a psychotic disorder SZ (Fig. 2d). The comorbid cases had, compared to the DUD-only and SZ-only cases, greater FGRS scores for only eight of 16 comparisons. Neither of the two primary FGRSs was significantly elevated in the comorbid v. solo disorder groups. In fact, both were significantly lower in the comorbid group. Comparing the comorbid to the DUD-only group, the largest increases in FGRS were seen for SZ, ASD and BD. Comparing the comorbid to the SZ only group, the largest increases were seen for DUD, AUD, and AD.
In our final and 10th pairing, we examined an externalizing disorder AUD and a psychotic disorder BD (Fig. 2e). The comorbid group had significantly greater FGRS scores for 12/16 comparisons with the two solo groups. The FGRSAUD was non-significantly higher in the comorbid than AUD-only group, while the FGRSBD was significantly lower in the comorbid than the BD-only group. Comparing the comorbid to the AUD-only group, the largest other increases in FGRS were seen for BD, AD and MD. Comparing the comorbid to the BD only group, the largest other increases were seen for AUD, DUD and AD.
Discussion
We sought, in these analyses, to explore how much an examination of FGRS profiles could provide insight into the underlying nature of the comorbidity frequently observed among psychiatric disorders. Instead of the more typical focus on the pair of disorders the comorbidity of which is the object of study, we expanded our focus to include profiles of FGRS for a broad group of eight diverse disorders.
We here took a descriptive approach trying to understand the broad and diverse results we have obtained. To do this, we examined 10 pairs of conditions representing a diversity of psychiatric and substance use disorders. From the wide array of findings, we would make the following major comments.
First, no consistent pattern of FGRS profiles across disorders was seen in all our 10 pairings of disorders. This suggests that there is no uniform genetic etiologic process will likely explain all if even a large majority of the forms of psychiatric comorbidity.
Second, as a starting point, it is helpful to outline the most common pattern that we observed that was seen in five of our 10 pairings: MD-AD, AUD-DUD, DUD-ADHD, MD-AUD and MD-ASD. This pattern was characterized by two main features:
(i) Both primary FGRS were significantly higher in the comorbid than in the two single-disorder groups.
(ii) The comorbid group also had significantly higher FGRS for all or most other disorders compared to the two solo-disorder groups.
We illustrate this pattern by examining carefully one of these pairings – DUD and ADHD – from the perspective of each of the primary disorders. The 34% of cases of ADHD cases who also had DUD differed from the 66% who did not by having considerably higher FGRSAUD and FGRSDUD along with smaller increases of their family genetic risk for AD, MD, ADHD and SZ. That is, comorbid ADHD cases were, from a perspective of the pattern of FGRS, qualitatively similar to ADHD-only cases but quantitatively more severe. The 13% of the DUD cases who also had ADHD differed from the remaining 87% of DUD-only cases by a very large increase in FGRSADHD, but also by substantial increases in FGRSDUD and FGRSAUD and smaller increases in all the other FGRS. So again, comorbid DUD cases were, from a genetic perspective, qualitatively similar to DUD-only cases but quantitatively more severe. However, this pair of disorders had one qualitative finding which stood out as an exception to the general pattern of quantitative differences. The FGRSASD was lower in the comorbid than the ADHD-only group, suggesting that an elevated FGRS for ASD in ADHD patients protects against the development of DUD. So, for the DUD-ADHD pairing, we have a general quantitative difference in the comorbid cases but with one qualitative difference regarding the FGRSASD.
Third, we next examine the pairing most different from that seen with DUD and ADHD: DUD-SZ. We begin by comparing the 19% of SZ cases who also had a DUD diagnosis with the 81% of SZ cases who did not. The comorbid SZ patients had substantially higher FGRS for our externalizing triad – AUD, DUD and ADHD – and our internalizing dyad – MD and AD – but not for either SZ or ASD. So, these two profiles had some typical quantitative effects – higher FGRS in comorbid cases -- but also key qualitative differences. It cannot, therefore, be claimed that DUD + SZ is genetically like SZ but just “more so.” This is because, among individuals with SZ, the probability of developing DUD was unrelated to their FGRS for SZ or ASD. This occurs despite the two disorders having a substantial OR (9.0) in the general population.
Examining the 97% of SZ cases who did not have DUD to the 3% who did, produced even more striking qualitative differences. Levels of FGRSAUD, FGRSDUD and FGRSADHD are significantly lower in the comorbid than in the DUD-only cases. That is, we see a quantitative difference between the single disorder and comorbid disorder for key FGRS but going in the opposite direction from than seen for the five disorder pairings reviewed above with lower scores in the comorbid group. Among DUD cases, high levels of FGRS for DUD, AUD and ADHD appeared to protect against the development of SZ. It is hard to imagine that the underlying nature of the comorbidity between DUD and SZ has the same origin as that seen for DUD and ADHD or the four other similar pairings.
Fourth, we examine two diagnostic pairings that range between the five with the most typical quantitative pattern and the especially atypical DUD-SZ pair: AD and SZ and ADHD and ASD. We again see in these pairings a mixture of quantitative and qualitative differences in the genetic profiles. Focusing initially on the AD-SZ results, we see that the 20% of SZ cases with a comorbid AD, compared with the 80% of cases without, have considered higher FGRS for MD, AD, AUD, DHD and ADHD. But, they have no increase in FGRSSZ or in FGRZASD. That is, the probability that an individual with SZ might develop a comorbid anxiety disorder is related to their genetic risk to a wide range of common disorders, but not to their genetic risk for SZ or ASD. Comparing the 1% of AD cases with SZ to the 99% without, we see the former group having elevated FGRS for many disorders (SZ, BD, AUD, DUD and ASD), but not for the FGRS to AD (or MD or ADHD). So, the probability that an AD case develops SZ is strongly related to their FGRS for SZ (and a number of other disorders) but not to their FGRS for AD.
Turning to ADHD and ASD, we see that the 11% of ADHD cases that are also diagnosed with ASD have substantially elevated levels of FRGS for ASD, MD and SZ, no change in the level of FGRSADHD and reduced levels of AUD and DUD. The latter finding again suggests that a high FGRS for ASD protects against substance use disorders. Looking at the 24% of ASD cases who also have ADHD, we see a quite different picture. They have highly elevated levels of both FGRSADHD and FGRSASD as well as significant elevation for genetic risk for MD, AD, AUD and DUD. This pairing clearly shows an asymmetry in the comorbid comparisons. That is, while the differences between the ASD only and the comorbid group looks fairly typical with increases in most FGRS, the pattern seen when comparing the ADHD with the comorbid group was quite different.
A few other trends in our findings are also noteworthy. Across our analyses, changes in individual FGRS were correlated in patterns that are consistent with prior analyses of genetic relationships (e.g. Kendler et al., Reference Kendler, Aggen, Knudsen, Roysamb, Neale and Reichborn-Kjennerud2011). That is FGRSMD and FGRSAD tend to rise and fall together, as did the levels of FGRSDUD and FGRSAUD. FGRSSZ and FGRSASD are also often linked. However, this association comes apart in the MD-ASD pairing where FRGSASD is considerably higher in the comorbid v. ASD-only sample, while FGRSSZ is lower. A subtle difference is noted between the related FGRS for AD and OCD. When AD is paired with MD (Fig. 1a), FRGS levels of DUD and AUD increase substantially in the comorbid v. the AD-only group. However, when AD is paired with OCD (Fig. 1d), levels of FGRSDUD and FGRSAUD are slightly lower in the comorbid than in the AD-only group. That is, those with high levels of FGRS for DUD and AUD are enriched in cases with both MD and AD, but rates of such individuals are lowered in those comorbid with OCD and AD.
Finally, a simple explanation for the observed patterns of comorbidity among our disorder pairings is illusive. The five pairs with the simple quantitative results include three closely and two modestly related disorders. Disorders whose FGRS is not significantly increased in the comorbid group of one or more pairings include a wide diversity of disorders: ADHD, OCD, AD, SZ, DUD and BD. Further research is clearly needed to elucidate the key underlying mechanisms involved.
Strengths and limitations
In trying to unravel the contributions of genetic risk factors to patterns of psychiatric and substance use comorbidity, our sample has two important strengths. First, our sample size is large (Table 1) so our analyses are well powered to detect even modest effects. Second, we have complete diagnostic information on all our subjects, so we are not subject to the problem of “re-assembling” our analyses of comorbidity from case–control analyses as has to be done with most polygenic approaches to this problem.
However, this paper should also be viewed in the context of five potentially important methodological limitations. First, these results depend on the reliability of the assigned diagnoses. The validity of the FGRS score is dependent on the quality of the available diagnoses in the Swedish national registries which has been well demonstrated for SZ, BD and OCD (Ekholm et al., Reference Ekholm, Ekholm, Adolfsson, Vares, Osby, Sedvall and Jonsson2005; Lichtenstein et al., Reference Lichtenstein, Bjork, Hultman, Scolnick, Sklar and Sullivan2006; Rück et al., Reference Rück, Larsson, Lind, Perez-Vigil, Isomura, Sariaslan and Mataix-Cols2015; Sellgren, Landen, Lichtenstein, Hultman, & Langstrom, Reference Sellgren, Landen, Lichtenstein, Hultman and Langstrom2011). The validity of MD diagnoses has not been formally assessed but is supported by its prevalence, sex ratio, sibling and twin correlations and associated psychosocial risk factors (Kendler, Ohlsson, Lichtenstein, Sundquist, & Sundquist, Reference Kendler, Ohlsson, Lichtenstein, Sundquist and Sundquist2018; Sundquist, Ohlsson, Sundquist, & Kendler, Reference Sundquist, Ohlsson, Sundquist and Kendler2017). Genetic epidemiological findings for AUD, DUD and eating disorders in Sweden have been similar to those found in other samples (Bulik et al., Reference Bulik, Thornton, Root, Pisetsky, Lichtenstein and Pedersen2010; Kendler et al., Reference Kendler, Sundquist, Ohlsson, Palmer, Maes, Winkleby and Sundquist2012, Reference Kendler, Ji, Edwards, Ohlsson, Sundquist and Sundquist2015, Reference Kendler, PirouziFard, Lonn, Edwards, Maes, Lichtenstein and Sundquist2016; Kendler, Maes, Sundquist, Ohlsson, & Sundquist, Reference Kendler, Maes, Sundquist, Ohlsson and Sundquist2013).
Second, we examined the patterns of comorbidity only for two disorders at a time, which represents a substantial oversimplification of the true patterns of comorbidity for psychiatric and substance use disorders. We begin to approach this problem in appendix Fig. 1 where we present FGRS profiles for the seven subject groups that reflect the possible patterns of comorbidity across three disorders, in this case, MD, AUD and DUD.
Third, our analyses did not formally incorporate one possible cause of comorbidity in which one disorder directly “causes” a second disorder (Neale & Kendler, Reference Neale and Kendler1995). However, this theory, were it responsible for most comorbid cases, would predict a pattern of FGRS profiles not seen in our analyses – that the FGRS profile of the secondary disorder would closely resemble that of the primary disorder. Further analyses that examined FGRS profiles of comorbid disorders as a function of the order of their ages at first registration could potentially provide further insight into the importance of this mechanism which we will pursue in future analyses.
Fourth, of the 36 possible combinations of our disorders, we examined only 10. In appendix Table 4, we present all 36 ORs (none is possible between BD and MD) and the relevant online Supplementary Figs. 2–26 for the 25 not presented here.
Finally, as noted above, our FGRS is an estimate of genetic risk reflecting aggregation of disease in close and distant relatives and is not equivalent to a molecular PRS. To be clear, we do not use “family history” information in the FGRS – that is respondent reports on psychiatric disorders occurring in their relatives. Rather, we have direct assessments, through the Swedish Registries, of the presence of disorders in relatives. Our corrections for cohabitation are approximate. Previous analyses have shown that our final FGRS scores are not highly sensitive to key steps in their calculation, as their deletion produces results that correlate highly with those from the full model with have similar predictive power (Kendler et al., Reference Kendler, Ohlsson, Sundquist and Sundquist2021a, Reference Kendler, Ohlsson, Sundquist and Sundquistb). We have also shown that our key FGRS are relatively stable across cohorts and geography in part because we formally correct for those variables in our calculations, and correlate highly with a quite different recently proposed family history score (Hujoel, Gazal, Loh, Patterson, & Price, Reference Hujoel, Gazal, Loh, Patterson and Price2020).
Conclusions
We examined genetic profiles of 10 pairs of diverse psychiatric and substance use disorders with the goal of describing changes in the patterns of these profiles associated with comorbidity between these disorders. The results were complex and not easily reducible to a few simple precepts. The most common pattern, seen in five of the 10 observed pairings, was simple and quantitative. Comorbid cases had higher FGRSs across all (or nearly all) of the examined disorders compared to both non-comorbid cases. However, the pattern was more complex in the remaining five pairings and included qualitative changes where the comorbid cases showed no increases in FGRS for certain disorders, including for one or both of the two primary disorders, and in a few cases significant decreases. Several comparisons showed an asymmetric pattern of findings with increases, in comorbid cases, of the FGRS for only one of the two comorbid disorders. A range of other interesting findings was observed, including evidence that FGRS for ASD and OCD was associated with lower risk for DUDs. The examination of genetic profiles appears to provide a fruitful line of inquiry to understand in more depth the origins of psychiatric and substance use comorbidity. Further work will be needed, with potential expansions of the analytic approaches to gain deeper insights into the likely complex mechanisms involved.
Disclosures and Acknowledgements
None.
Informed Consent: Informed consent was not obtained from individual participants included in the study.
Location of where work was done: Lund University, Virginia Commonwealth University.
Supplementary material
The supplementary material for this article can be found at https://doi.org/10.1017/S0033291721004268.
Financial support
This project was supported by grants AA023534 and DA030005 from the National Institutes of Health, the Swedish Research Council as well as Avtal om Läkarutbildning och Forskning (ALF) funding from Region Skåne.
Conflict of interest
None of the authors has any conflicts of interest to declare.
Ethical standards
We secured ethical approval for this study from the Regional Ethical Review Board in Lund (No. 2008/409; 2012/795) and the Swedish Ethical Review Authority (No. 2019/01588; 2019/03278).