1. Introduction
A large body of the literature on the relationship between the environment and economic growth has focused attention on the specific relationship between pollutants and per capita income, widely known as the Environmental Kuznets Curve (EKC) literature. The pioneering empirical work in this literature is the work of Grossman and Krueger (Reference Grossman, Krueger and Garber1993, Reference Grossman and Krueger1995). The authors examine the link between environment and economic growth and their findings suggest an inverted U-shaped relationship between the two. Many of the empirical studies following the studies of Grossman and Krueger (Reference Grossman, Krueger and Garber1993, Reference Grossman and Krueger1995) confirm the inverted-U relationship between pollution and income (for example, Selden and Song, Reference Selden and Song1994; Ansuategi et al., Reference Ansuategi, Barbier, Perrings, van den Bergh and Hofkes1998; List and Gallet, Reference List and Gallet1999; Stern and Common, Reference Stern and Common2001; Millimet et al., Reference Millimet, List and Stengos2003). However, recently much of the empirical evidence goes counter to the validity of the EKC hypothesis, mostly depending on the choice of the pollution indicators as well as the method used (see Harbaugh et al., Reference Harbaugh, Levinson and Wilson2002; Bertinelli and Strobl, Reference Bertinelli and Strobl2005; Azomahou et al., Reference Azomahou, Laisney and Nguyen Van2006).
Most of the papers in this literature examine whether such a relationship exists as well as finding the turning point, by employing specific functional forms and various – parametric and nonparametric – econometric techniques. This paper estimates an emission function that resembles the type of equations estimated in the EKC literature. It adds to the literature by examining the relationship between emissions and output through a new perspective; it does not specify an ad-hoc relationship to be estimated and the model which specifies the equation to be estimated comes directly from the mechanism that generates production residuals (emissions) as well as from firms' optimizing behavior. This relationship is estimated using nonparametric econometric techniques as well as threshold regression. The latter is used to identify possible threshold levels in the relationship between emissions and output, and also as a test of the robustness of the empirical findings obtained from the nonparametric estimation.
This study utilizes the dataset on sulphur dioxide (SO2) and nitrogen oxide (NOx) emissions for the U.S. states originally used in two EKC related studies, List and Gallet (Reference List and Gallet1999) and Millimet et al. (Reference Millimet, List and Stengos2003). List and Gallet (Reference List and Gallet1999) use a polynomial seemingly unrelated regressions (SUR) model and estimate the income-emissions relationship for the U.S. states by allowing for different income slopes across states. Their estimates produce EKC across U.S. states. Millimet et al. (Reference Millimet, List and Stengos2003) estimate semiparametric specifications and compare them with pooled time and individual-fixed effects cubic models and spline regressions. The test results indicate that the null hypothesis of the parametric models is rejected for both pollutants. They obtain EKC-shaped relationships for per capita NOx and SO2 emissions. Aslanidis and Xepapadeas (Reference Aslanidis and Xepapadeas2006) also utilize the dataset used in List and Gallet (Reference List and Gallet1999) and estimate thresholds of per capita income to examine the emissions-income relationship. In a later paper, Aslanidis and Xepapadeas (Reference Aslanidis and Xepapadeas2008) use a panel dataset of ambient concentrations of SO2 and smoke for various countries and extend their 2006 work by formulating a theoretical model. As in their 2006 paper, pollution abatement or regulations are not explicitly accounted for – instead they define an environmental policy function where environmental stringency depends on various levels of per capita income; as per capita income increases above some threshold level, then environmental stringency also increases.
Nonparametric estimation has recently gained more popularity in this literature. Among the papers that use nonparametric estimation techniques is that of Taskin and Zaim (Reference Taskin and Zaim2000) where they use a nonparametric pooled regression to examine the relationship between a CO2 environmental efficiency index and GDP per capita for a panel of countries. Their results indicate a U-shaped relationship followed by an inverted U relationship. Bertinelli and Strobl (Reference Bertinelli and Strobl2005) employ a partially linear model in a cross-country context and find that a linear relationship between per capita income and SO2 and CO2 emissions cannot be rejected. Azomahou et al. (Reference Azomahou, Laisney and Nguyen Van2006) examine the relationship between CO2 emissions per capita and GDP per capita using a pooled country-fixed effects nonparametric regression and their results indicate a monotonically increasing relationship. Bertinelli et al. (Reference Bertinelli, Strobl and Zou2012) investigate the relationship between CO2 emissions per capita and GDP per capita by applying a kernel regression estimator to a panel of countries. They find that for some developed countries the relationship between output and pollution after 1960 has been heterogeneous (for some rising, for some falling, and for others flat). For almost all the developing countries in their sample, they find that the relationship is always upward sloping.
In Murdoch et al. (Reference Murdoch, Sandler and Sargent1997), Ansuategi (Reference Ansuategi2003) and Maddison (Reference Maddison2006, Reference Maddison2007), another dimension is added to the empirical EKC literature, that of pollution spillovers between a set of EU countries (Maddison's (Reference Maddison2006) dataset is for a set of 135 countries). The empirical papers that account for transboundary pollution examine the implications of strategic interaction between countries, if any. Murdoch et al. (Reference Murdoch, Sandler and Sargent1997) account for the spatial dispersion of sulphur and NOx emissions when empirically investigating the emissions reductions required by the Helsinki Protocol in 25 European countries. They find that the demand for emissions reduction is higher, the higher the deposition from neighboring countries. Their model works well for sulphur but their results are less satisfying for NOx.
Ansuategi (Reference Ansuategi2003) examines whether accounting for transboundary pollution affects the emissions-income relationship. He categorizes countries into four groups according to their emissions and the amount of pollution they receive from other countries and estimates EKCs for each group. He finds different results for different groups. Helland and Whitford (Reference Helland and Whitford2003) find that emissions releases are higher where it is likely that emissions cross state borders. On the contrary Rupasingha et al. (Reference Rupasingha, Goetz, Debertin and Pagoulatos2004), when examining the EKC hypothesis using U.S. county data for toxic releases, conclude that the EKC relationship they find is unaffected when they account for spatial dependence. U.S. data are also used in a study on water pollution by Sigman (Reference Sigman2005); she uses state-level data for water quality in state rivers and finds evidence that states free ride. Finally, Maddison (Reference Maddison2007) finds that the quantity of transboundary imports of sulphur is statistically insignificant. But he finds that countries follow the environmental quality (per capita emissions) of their neighbors (Maddison, Reference Maddison2006, Reference Maddison2007).
This paper differs from Millimet et al. (Reference Millimet, List and Stengos2003) and Aslanidis and Xepapadeas (Reference Aslanidis and Xepapadeas2006, Reference Aslanidis and Xepapadeas2008) in the following ways. First, the reduced form model to be estimated comes from the explicit modelling of the pollution generating mechanism as well as from solving the cost minimization problem. That is, this paper formalizes the approach used in Millimet et al. (Reference Millimet, List and Stengos2003) at a theoretical level. This results in defining a U.S. state-level emission function that is not only a function of output but also a function of the input prices (capital, labor, materials and energy); the price of energy and materials being important determinants of emissions. Second, unlike all previous EKC-related studies, the concept of gross output rather than value added output is used. Using gross output in examining the relationship between output and pollution in a model where pollution is generated during the production process is essential; the pollution generating mechanism, where emissions are generated from polluting inputs like energy and materials (intermediate inputs), implies that the correct measure of output to be used is gross output. Third, all variables are used in levels and not in per capita terms. To use variables in per capita terms in the emission function one needs to make assumptions about the degree of homogeneity of the function. Even if assumptions about the degree of homogeneity might hold for the production function or the input demand functions, these might not be true for the function representing the production of residuals.Footnote 1 Fourth, the emission function explicitly accounts for the effect of pollution abatement. In the context of the empirical EKC literature, abatement is usually not (explicitly) accounted for; in fact, apart from a few papers, abatement has generally been neglected from this literature.Footnote 2 Fifth, as in Murdoch et al. (Reference Murdoch, Sandler and Sargent1997), Ansuategi (Reference Ansuategi2003) and Maddison (Reference Maddison2006, Reference Maddison2007), the spatial dispersion of emissions between states is also taken into account. Finally, the threshold regression is employed in order to identify possible threshold levels in the emissions-output relationship. Contrary to the papers of Aslanidis and Xepapadeas (Reference Aslanidis and Xepapadeas2006, Reference Aslanidis and Xepapadeas2008), this paper explicitly accounts for the effect of pollution abatement in defining thresholds in the relationship between emissions and output.
Summarizing, this study specifies and estimates an emission function that for the first time takes into account, all at the same time, a number of factors previously unaccounted for or used only individually in the related literature. Specifically, this research makes contributions in six respects. First, the relationship to be estimated comes from the pollution generating mechanism, which models emissions as a by-product, along with cost minimization; these two are used as the main tools in order for an emission function to be defined. Second, the proposed emission function depends on the level of gross output and not value-added output. Moreover pollution abatement is also accounted for. Third, since the proposed emission function depends also on the prices of the inputs this research evaluates other determinants of emissions such as energy and material prices. Prices are significant policy tools and can be taken into account in environmental policy situations. Controlling for the input prices captures the effect of, e.g., a change in energy prices; an increase in energy price can result in reduction in the use of energy that might affect the level of emissions. The use of prices and not quantities of the inputs offers the additional advantage of avoiding double counting when abatement is also used; there is no need to distinguish between abatement inputs and production inputs. Fourth, pollution spillovers, capturing the spatial dependence between states, are also accounted for. Fifth, using U.S. state-level data provides a comparable set of advance economies, so the evidence of the relationship between emissions and output is much more reliable. Finally, a combination of econometric modeling assumptions is used; semiparametric estimation to uncover the shape of the relationship and threshold estimation to identify the threshold level of output where the relationship changes (if it does so).
Considering the above, this study may potentially have important implications for environmental and economic policies, not only for advanced economies but even more so for the developing countries, especially the ones trying to balance the tension that exists between economic growth and environmental degradation. Furthermore, the use of the econometric methodology that we adopt, both in terms of the semiparametric specification and the use of the threshold regression model, allows us to test for the stability of our specification in a general way that does not rely on the presence of predetermined break points. Our findings suggest that the relationship that includes abatement is the only one that is stable, while the absence of abatement leads to a model with structural breaks that is inherently unstable. This finding of a stable relationship between output and SO2, NOx with abatement can be very useful for policy analysis as it indicates that abatement is a crucial and indispensable component of any stable model that deals with environmental pollution measurement.
The nonparametric estimation results show that there is a positive and increasing relationship between states' emissions and output. Furthermore, this relationship is nonlinear; a linear parametric model and the usual nonlinear parametric model adopted in several studies are both rejected against the semiparametric model. The threshold estimation results indicate that there is no threshold level of output for which the relationship between emissions and output changes. Clearly there is no EKC type of relationship (for both pollutants, SO2 and NOx). Moreover, pollution spillovers do not affect the relationship found. As far as pollution abatement is concerned, the results show that, as expected, the relationship between emissions and abatement is negative; for any level of output, emissions can be reduced as long as pollution abatement increases (represented by a downward shift of the emission-output function), given all else equal. More importantly, abatement turns out to be a key variable in the determination of the shape of the emissions-output relationship; excluding abatement produces an EKC type of relationship between emissions and output.
The paper is structured as follows. The model and the empirical analysis are presented in sections 2 and 3, respectively. Section 4 discusses the empirical results and section 5 concludes.
2. Model
The relationship between economy and waste (such as emissions) comes through the use of matter and energy. That is why thermodynamic concepts, which are the laws explaining the behavior of matter and energy, are closely related to environmental economics. Ayres and Kneese (Reference Ayres and Kneese1969) first introduced the materials balance approach and only recently this approach has started gaining attention in the modeling of emissions (or residuals) in economics. According to Dasgupta (Reference Dasgupta1982: 162), the ‘materials balance approach is not really an approach as such but rather an accounting device based on the law of mass conservation designed to ensure that economic activities are correctly described.’ To clarify the concept of the materials balance condition and its connection with economics, one must first understand that the production process is essentially the transformation of materials and energy into outputs. But due to physical laws – the law of mass conservation, first law of thermodynamics, and the entropy law, the second law of thermodynamics – the transformation of materials and energy results not only in desired outputs (consumer goods) but also in undesirable ‘outputs’ (residuals) that are considered to be harmful to the environment. Murty and Russell (Reference Murty and Russell2002) and Murty et al. (Reference Murty, Russell and Levkoff2012), define a residual generating mechanism that relates the generation of production residuals with the use of polluting inputs or material inputs as defined by others (e.g., Pethig, Reference Pethig2003, Reference Pethig2006).Footnote 3 They also show how abatement can be explicitly accounted for in a regulated economy where abatement output is also produced.Footnote 4
Let e be emissions, x e a vector of L residual generating inputs, and a the pollution abatement that a firm or a state is forced to undertake under a regulated economy. The residual generation mechanism is described by:
 $$e=g\lpar x_e \comma \; a\comma \; t\rpar \comma \; $$
where t is a time trend capturing technological change in the emission production. Equation (1) describes a technological, not behavioral, relationship; the production of emissions is a result of chemical and physical reactions that take place in nature when firms engage in production of intended outputs. This means that whenever a pollution generating input is used, a certain amount of residual and a given amount of emissions released into the environment are generated at that instant, and this holds always. In other words, there is always a positive technological relationship between x e and emissions; the second law of thermodynamics implies that  $g_{x_{e_{l} }} \gt0\comma \; $ for every l, l = 1, …, L (Baumgärtner et al., Reference Baumgärtner, Dyckhoff, Faber, Proops and Schiller2001). That is, increases in the usage of the polluting inputs cause emissions to increase. Furthermore, g a < 0; abatement increases cause emissions reductions.
Having defined the technology of emission generation, the next step is to define the production of output technology. The model describes an economy that produces two outputs: gross output, y, and abatement output, a. A vector of M non-residual generating inputs, x c, as well as the vector of the L residual generating inputs, x e, are used in the production process. Production is also a function of pollution spillovers, p, used in order to capture the effect of neighboring states' emissions. Finally, the technology of output production is accounted for with the use of an output technology index, t, measured by time trend. The production process is described by the following transformation function:
 $$T\lpar y\comma \; x_c \comma \; x_e \comma \; a\comma \; p\comma \; t\rpar =0. $$
Moving to the cost minimization problem, if ω c is the input price vector of the non-residual generating inputs, ω e the input price vector of the residual generating inputs, x c and x e the corresponding input vectors, then the cost minimization problem is
 $$\mathop {\min }\limits_{x\comma x_e} {\omega}^{\prime}_{c} x_{c} + {\omega}^{\prime}_{e} x_{e}\, st \, T\lpar y\comma \; x_{c}\comma \; x_{e}\comma \; a\comma \; p\comma \; t\rpar =0.$$
Solving the cost minimization problem, the vectors of the conditional input demands, for given y and a, are derived:
 $$\eqalign{ x_c & = s\lpar y\comma \; a\comma \; p\comma \; \omega \comma \; t\rpar \cr x_e &=h\lpar y\comma \; a\comma \; p\comma \; \omega \comma \; t\rpar \comma \; } $$
where ω, is the input price vector of all inputs. The interest of the paper is for the L conditional demands of the residual generating or ‘dirty’ inputs, i.e., for the x e = h(y, a, p, ω, t) vector. The conditional input demands satisfy the usual properties of homogeneity of degree zero in input prices. The partial derivative of an input demand with respect to abatement can take any value;  $\partial h_{l} /\partial \alpha \displaystyle{{\gt}\over{\lt}}0$ for l = 1, …, L.Footnote 5 The sign of the partial derivative of the demand of input l with respect to p is also undefined,
 $\partial h_{l} /\partial p\displaystyle{{\gt}\over{\lt}} 0\, \hbox{for}\ l=1\comma \; \ldots \comma \; L$; the reaction of states, if any, to a change in neighbors' emissions and the analogous change in the usage of inputs defines the sign of ∂h l/∂p. Substituting the residual generating input demands x e = h(y, a, p, ω, t) from (3) in the technological relationship (1) results in the following emission function:
 $$e=g\lpar h\lpar y\comma \; a\comma \; p\comma \; \omega \comma \; t\rpar \comma \; a\comma \; t\rpar =G\lpar y\comma \; a\comma \; p\comma \; \omega \comma \; t\rpar.$$
Emissions depend on output, y, abatement, a, pollution spillovers, p, the prices of the inputs, ω, and time, t, that now represents the combined technological change in both the production of output and the production of emissions.
Following the signs and properties of (1) and (3), the emission function (4) satisfies  ${\partial e} /{\partial y}=\sum\nolimits_{l=1}^{L} {\lpar {\partial g} /{\partial h_{l} }\rpar \lpar {\partial h_{l} } /{\partial y}\rpar } \ge 0\comma \; l=1\comma \; \ldots\comma \; L$. This nonnegative sign is straightforward:
 $g_{x_{e_{l} } } >0$ from (1) and h y ≥ 0 from (3). The sign of
 ${\partial e} /{\partial a}=\sum\nolimits_{l=1}^{L} {\lpar {\partial g} /{\partial h_{l} }\rpar \lpar {\partial h_{l} } /{\partial a}\rpar } +\lpar {\partial g} /{\partial a}\rpar $ is ambiguous; the first term on the right hand side can be anything since ∂g/∂h l > 0 and
 $\partial h_{l} /\partial \alpha \displaystyle{{>}\over{<}} 0$, whereas the second term is negative, ∂g/∂a < 0.Footnote 6 For the case in which ∂h l/∂a ≥ 0, it is expected that the second term effect (∂g/∂a < 0) is stronger than the first and therefore higher in absolute value; thus the overall effect is expected to be negative. As far as the effect of the input prices on emissions is concerned, this depends on the relationship between the inputs in production. That is, for l − 1, …, L and for any k, k = 1, …, L + M, the effect of a change in the price of the input k on emissions is
 $\partial e/\partial \omega _{k} =\sum\nolimits_{l=1}^{L} {\lpar \partial g/\partial h_{l} \rpar } \, \, \lpar \partial h_{l} /\partial \omega _{k} \rpar \displaystyle{{>}\over{<}} 0$. Finally, the sign of the partial derivative of emissions with respect to p can be anything,
 $\partial e/\partial p=\sum\nolimits_{l=1}^{L} {\lpar \partial g/\partial h_{l} \rpar \lpar \partial h_{l} /\partial p\rpar } \displaystyle{{>}\over{<}} 0$. It suggests that increases in pollution spillovers can have a nonnegative or a nonpositive effect on a state's emissions. According to the model, this depends on the sign of ∂h l/∂p. If ∂h l/∂p is nonnegative (nonpositive) then ∂e/∂p is nonnegative (nonpositive). Therefore it depends on changes in the usage of the polluting inputs, if any.
3. Empirical analysis
3.1 Data
A large part of the critique on the empirical investigations on the EKC concerns the set of sample countries, the comparability of data across countries, and the poor quality of pollution data (Stern et al., Reference Stern, Common and Barbier1996). One way to avoid such problems is to use data on the U.S. states, which provides a comparable set of advanced economies. As a result, the ‘...analysis provides better evidence of whether…emissions actually do fall at high-income levels’ (Aldy, Reference Aldy2005: 49). The focus of this paper is on the 48 contiguous U.S. states. It employs state-level data on SO2 and NOx emissions, gross output, the prices of the inputs (labor, capital, energy and materials) and pollution abatement expenditures. The use of gross output and not value added output deserves special attention; the resulting emission function in (4) incorporates the implications inherited from the material balance approach which dictate the use of intermediate inputs (energy and materials). This in turn implies that the concept of gross output rather than value added output should be used. This is important because, in settings where residuals are generated during the production process, the materials balance approach reveals that using only capital and labor and disregarding the material and energy inputs is inconsistent.
State-level data on gross output are not available. To construct gross output for each state, two datasets are used: the dataset by Jorgenson (Reference Jorgenson, Berndt and Triplett1990) and Jorgenson and Stiroh (Reference Jorgenson and Stiroh2000), as well as the state-level data on the value-added output from regional economic accounts of the Bureau of Economic Analysis (BEA, 2006). The dataset of Jorgenson (Reference Jorgenson, Berndt and Triplett1990) and Jorgenson and Stiroh (Reference Jorgenson and Stiroh2000) contains information, by sector for the U.S., on the value, prices and quantities of: gross output, labor, capital, energy and materials. The value-added output by state and sector (from the BEA) is used in order to construct shares and apportion the U.S. sector data from Jorgenson (Reference Jorgenson, Berndt and Triplett1990) and Jorgenson and Stiroh (Reference Jorgenson and Stiroh2000) to the state level. The state-level pollution abatement expenditures data employed in the paper come from the Pollution Abatement Cost and Expenditures (PACE) survey conducted annually from 1973 to 1994 (with the exception of 1987) by the US Bureau of the Census (2002). The PACE surveys provide the most complete source of pollution abatement costs and expenditures associated with environmental protection in the U.S. The data were again collected for 1999 and 2005 but the 1999 PACE survey was quite different from the previous ones, raising compatibility issues (Becker and Shadbegian, Reference Becker and Shadbegian2005). The latest 2005 PACE survey, although it is more compatible to the earlier surveys, is not accounted for due to the long break in the time series. Therefore the time span of the data in this paper is confined to the period from 1973 to 1994. The paper then focuses only on operating costs which are more consistent across years. Abatement operating expenses, as opposed to capital expenses directed toward pollution abatement (abatement capital expenses), are easier to be identified and reported separately from other nonpollution abatement expenses (Levinson, Reference Levinson1999). More details on the data and the sources are provided in the online appendix.
The pollution spillover variable for state i at time t, p it, constructed in order to capture the effect of neighboring states' emissions, is defined as:
 $$p_{it} =\sum_{i\ne j}^n {w_{ij} s_{jt} }\comma \; $$
where w ij is the weight used to define the relationship between states i and j, and s jt is the emission density of state j. The latter is defined as the emissions of state j divided by the area of state j. When w ij is positive, then states i and j are classified as ‘neighbors’. Two issues arise regarding the construction of the spillover pollution variable. The first is the choice between emissions and ambient concentration rates and the second is the choice of the weight.
For the first issue, emissions and not ambient concentration rates are used for this calculation. Ansuategi (Reference Ansuategi2003) argues that ambient concentration rates measure the local impact of polluting activities but the source of the polluting activities, that is, the origin of emissions, is ignored. Using emissions, although it accounts for the origin of the polluting activities, does not account for the area in which they are released or for the possible locations of the impact. This is dealt with by using emission density for the calculation of spillover pollution. In this way the emissions of the states that are assigned a nonzero weight, the ‘neighboring’ states, are adjusted according to the size of area in which they are released. That is, bigger states typically absorb more of their own emissions. The unknown probable location of the impact of emissions is then dealt with by calculating the pollution spillovers using specific weighting schemes.
This gives rise to the second issue concerning the choice of weights. Fredriksson and Millimet (Reference Fredriksson and Millimet2002), when analyzing whether there is strategic interaction between the states as far as environmental stringency is concerned, emphasize the importance of the choice of the weight matrix; they use various geographical and/or income/population based weights. States can be interconnected in various ways. The spatial weights matrix can use inverse geographical distances between states or indicating which states share a common border.Footnote 7 Two alternative spatial weighting matrices are employed in the analysis. The one discussed in the empirical analysis is the ‘nearest neighbor’ weighting scheme. The weight matrix for this weighting scheme defines two states as neighbors if the distance between the two states is less than the median distance between two states in the sample (median distance is 1091 miles). Further details about the weighting schemes as well as descriptive statistics of all the data used in the analysis are provided in the online appendix.
3.2 Empirical methods
This study uses mainly two complementary methodologies in order to investigate the emission function in (4). First, nonparametric econometric techniques are used in order to uncover possible nonlinearities in the data and provide the shape of the relationship without imposing restrictive functional form assumptions. Second, a threshold regression model is employed in order to identify possible threshold levels in the relationship between emissions and output, and also as a test of the robustness of the empirical findings obtained from the nonparametric estimation. A parametric version of the model is also provided.
3.2.1 Semiparametric partially linear (PLR) model
Allowing emissions to be a function of output and assuming that the other determinants of emissions have a linear effect on emissions, the objective is to estimate the following equation, for state i at time t:Footnote 8
 $$\eqalign{e_{it} & =X_{it} \beta +\theta \lpar y_{it} \rpar +\varepsilon _{it} \comma \; \cr i & = 1\comma \; \ldots\comma \; N\comma \; \, \ t=1\comma \; \ldots\comma \; T\comma \; } $$
where e it represents emissions of SO2 and NOx, for state i at time t. Each pollutant is addressed individually and the vector X it contains the variables linearly related to emissions. More precisely, X it = (D i, t, a it, ω 1it, ω 2it, ω 3it, e it−1, p it−1) is the linear part of the model that includes state specific dummiesD i, time trend t, abatement a it, and the relative (to the price of labor) input prices, the relative price of capital ω 1it, the relative price of materials ω 2it and the relative price of energy ω 3it. It also includes the lagged dependent variable and the lagged spillover pollution. Relative prices and not price levels are used to ensure the homogeneity of degree zero of the inputs demands with respect to prices. The lagged dependent variable is used as a regressor in order to capture any dynamic effects that exist that otherwise would be missed as well as to capture possible serial correlation problems. Lagged spillover pollution is used mainly to avoid the endogeneity of the spillover variable arising in strategic interaction models. The latter issue is further discussed below.Footnote 9β is a vector of parameters (qx1) and θ is an unknown function of the output, y it. The error term satisfies E(ε it|X it, y it) = 0.
The estimation of the function θ(y) is obtained by implementing Robinson's (Robinson, Reference Robinson1988) kernel based approach. Robinson provided a method of obtaining a  $\sqrt n $ consistent estimator of β and then deriving the estimator of θ (y) from the nonparametric regression of
 $e-X\hat {\beta }$ on y. More precisely, to obtain estimates of the function θ (y), the nonparametric estimates of E(e/y) and E(X/y) are obtained. The estimate of the function θ is:
 $$\hat {\theta }\lpar y\rpar =\hat {m}_e \lpar y\rpar -\hat {\beta }\hat {m}_X \lpar y\rpar \comma \;$$
where  $\hat{m}_{e}(y)$ and
 $\hat{m}_{X}(y)$ are the nonparametric estimators of the regression functions E(e/y) and E(X/y) respectively.Footnote 10
 $\hat{\beta}$ is the OLS estimator of
 $e-\hat {m}_{e} \lpar y\rpar =\beta \lpar X-\hat {m}_{X} \lpar y\rpar \rpar +u$.
A main issue arises in estimating equation (6). This is attributed to the use of the spillover pollution variable in the regression. Spillover pollution contains the emissions of other states but the state in question. The dependent variable being emissions of the state in question ranks the model in the class of strategic interaction models. Estimating such models of strategic interaction between states can create problems. It is well known from the spatial econometrics literature that two main econometric issues arise: the endogeneity of the spillover variable and the possible spatial error dependence (see Anselin, Reference Anselin1988). There are two methods used to get around these issues. Some use Maximum Likelihood Estimation (MLE) methods and others use the Instrumental Variables (IV) approach (Case et al., Reference Case, Rosen and Hines1993; Murdoch et al., Reference Murdoch, Sandler and Sargent1997).
Besides these two standard methods some, such as Fredriksson and Millimet (Reference Fredriksson and Millimet2002), avoid the endogeneity issue entirely by using lagged values of the right hand side weighted variable.Footnote 11 This paper also uses lagged values of the spillover pollution variable. The reasons for this specification are fourfold. A state's reaction to other states' emissions might occur with a lag. If so, as Fredriksson and Millimet (Fredriksson and Millimet, Reference Fredriksson and Millimet2002: 109) argue, ‘...ignoring lagged effects may miss much of the strategic interaction effect’. Second, it controls for the possible bias stemming from the spatially correlated time-specific unobservables and it also solves the problem of reverse causation because current emissions cannot affect neighboring states' past emissions (Fredriksson and Millimet, Reference Fredriksson and Millimet2002). The fourth reason is related to the nature of the estimation methods employed in this study. Because of the complexity of the nonparametric methods, using the IV method to obtain estimates is beyond the scope of this paper. This is also true for the threshold regression model. Finally, to avoid spatial error dependence, this study uses state dummies to capture time invariant state-specific attributes.
3.2.2 Threshold regression model
Moving to the threshold regression model, the objective is to estimate the following:
 $$\eqalign{ e_{it} & =Q_{it} \beta _1 +u_{it} \comma \; \, \, y_{it} \le y_0 \cr e_{it} & =Q_{it} \beta_2 +u_{it} \comma \; \, \, y_{it} >y_0\comma \; } $$
where Q it = (D i, t, y it, a it, ω 1it, ω 2it, ω 3it, e it−1, p it−1) is a vector of the independent variables. Output, y it, is the threshold variable and y 0 is the threshold value. As before, e it measures emissions of SO2 and NOx, in state i at time t.
The threshold regression model can identify the threshold level of output and test for such a relationship above and below the threshold. In Hansen's (Hansen, Reference Hansen2000) algorithm, the values of y 0 are searched for by using conditional OLS regressions based on a sequential search over all y 0 = y n, where n is the number of observations in the sample. Following Hansen (Reference Hansen2000), the estimation method involves a heteroskedasticity-consistent Lagrange Multiplier (LM) bootstrap procedure to test the null hypothesis of a linear specification against a threshold specification alternative.
3.2.3 Parametric model
As is common in the literature, a parametric version of the model is also provided. The model considered is
 $$e_{it} =\alpha _i +X_{it} \beta +\gamma _1 y_{it} +\gamma _2 y_{it}^2 +\gamma _3 y_{it}^3 +\nu _{it} \comma \; $$
where, X it = (D i, t, a it, ω 1it, ω 2it, ω 3it, e it−1, p it−1) as in the semiparametric model.
4. Empirical results
4.1 Semiparametric estimation
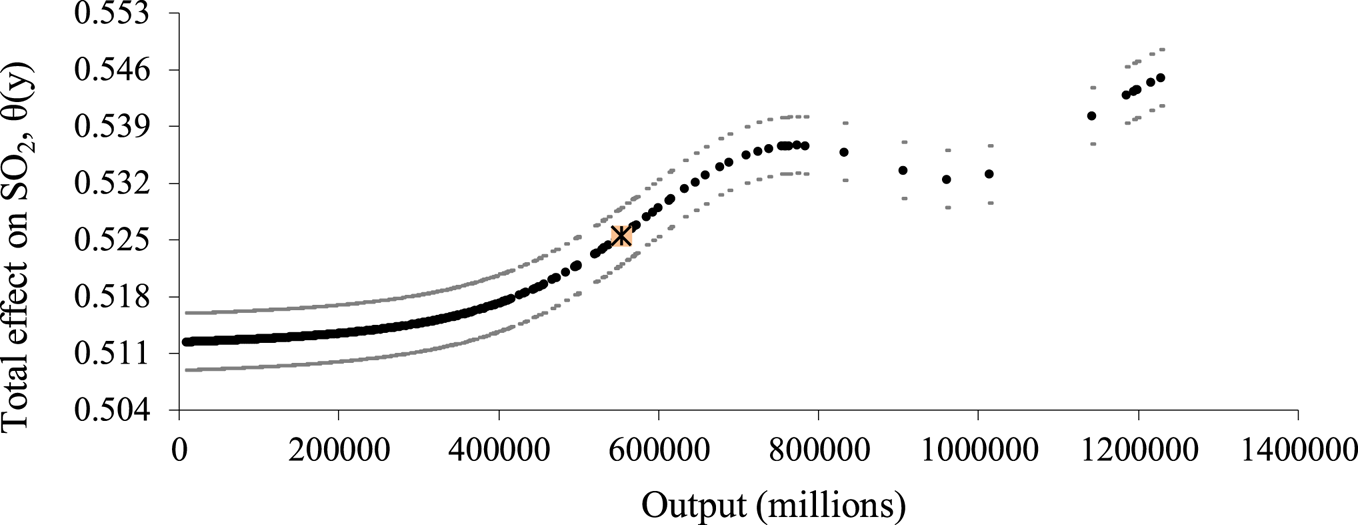
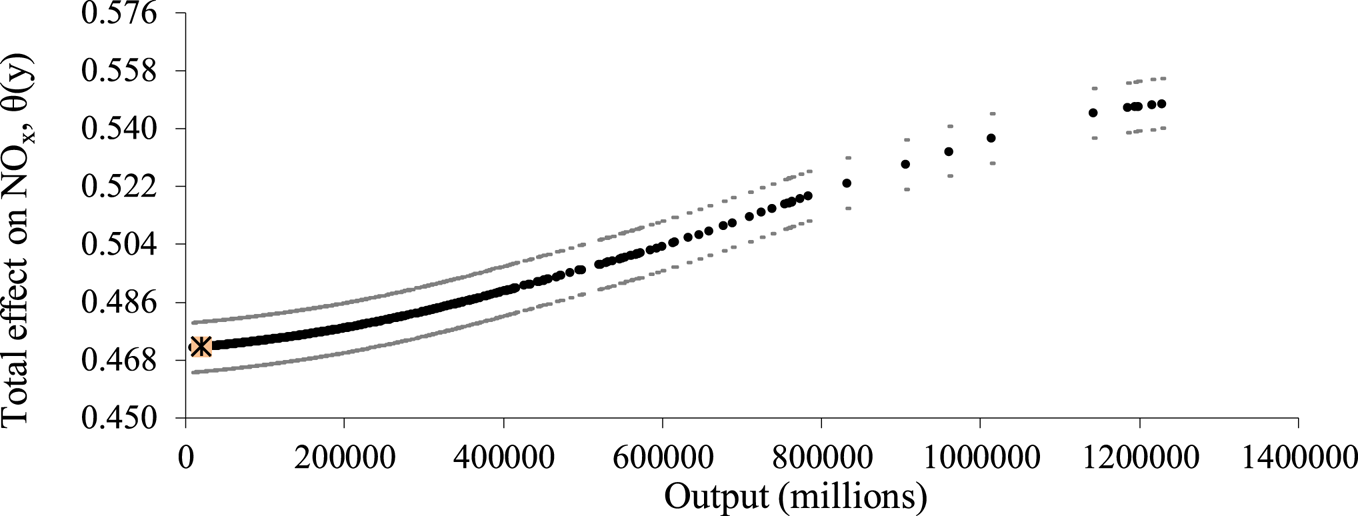
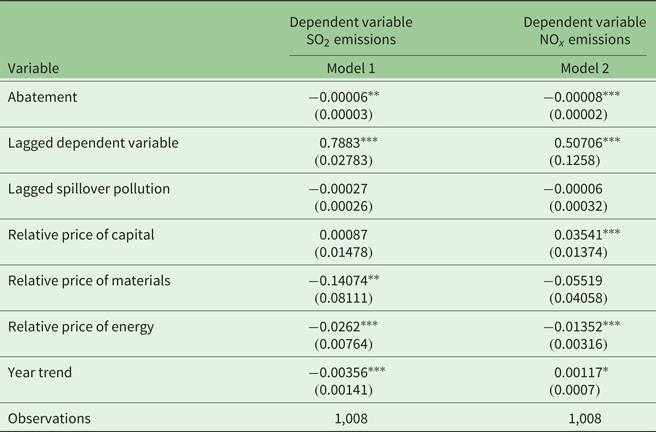
The results of the semiparametric estimation of equation (6) are presented in figures 1 and 2 and table 1. The bandwidth parameter used in the nonparametric kernel estimation is obtained by cross-validation and the Gaussian kernel is used. Note that this estimation method creates a problem of non-identification of an unrestricted intercept term. This results in a scaling issue when comparing the semiparametric results with parametric alternatives. Millimet et al. (Reference Millimet, List and Stengos2003) and Bertinelli and Strobl (Reference Bertinelli and Strobl2005) deal with this issue by using standardized data. The same is applied in the data here.Footnote 12
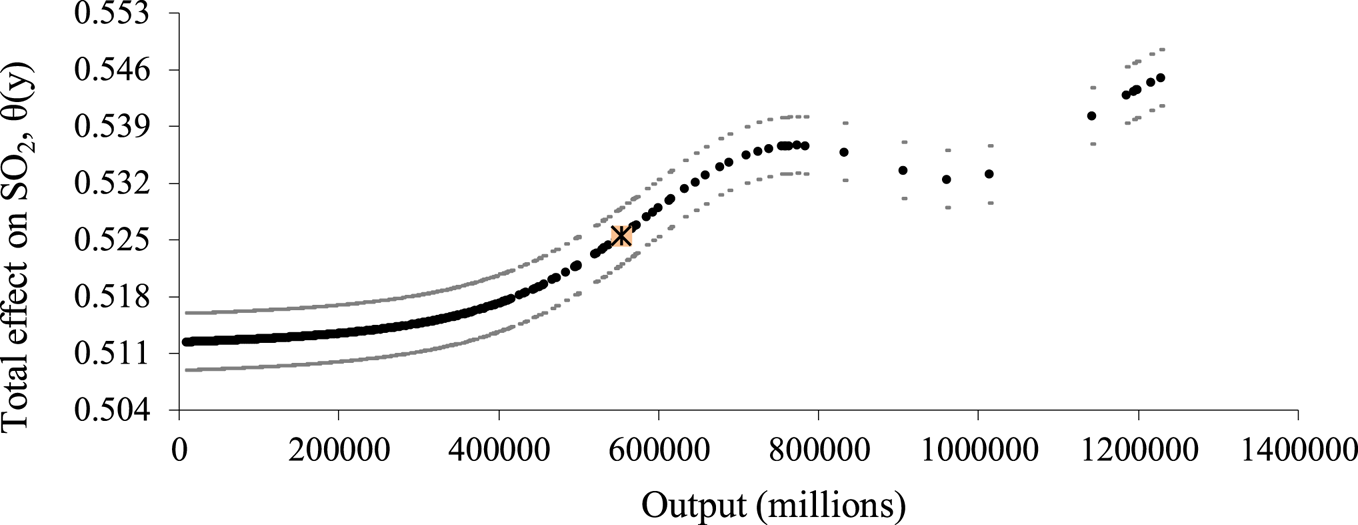
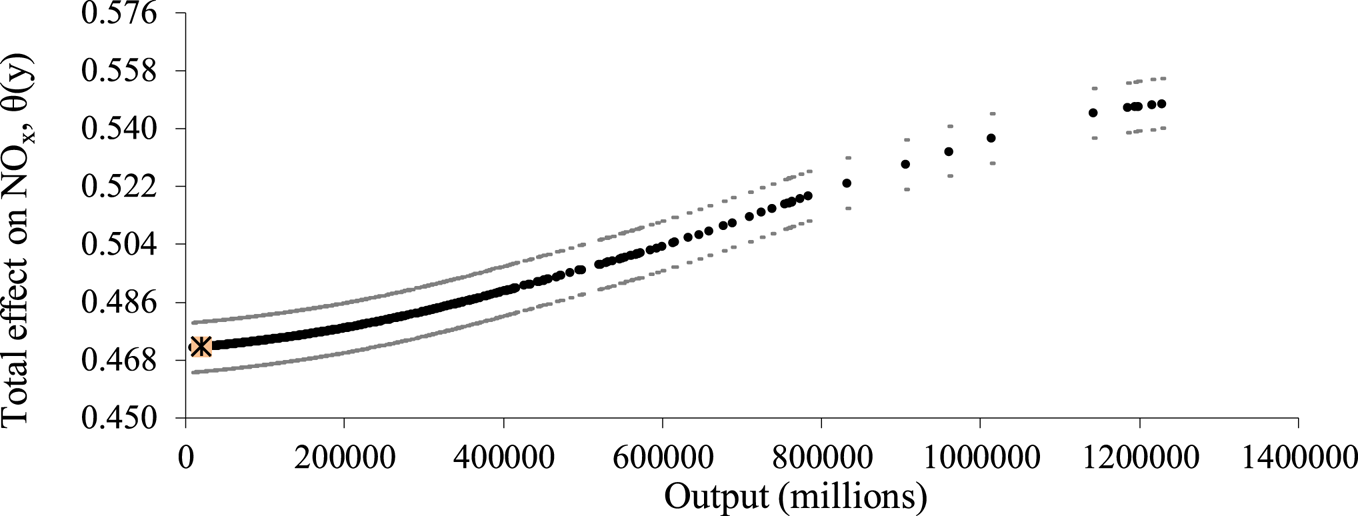
Effect of output on SO2 emissions.
Effect of output on NOx emissions.
Semiparametric model (1973–1994)
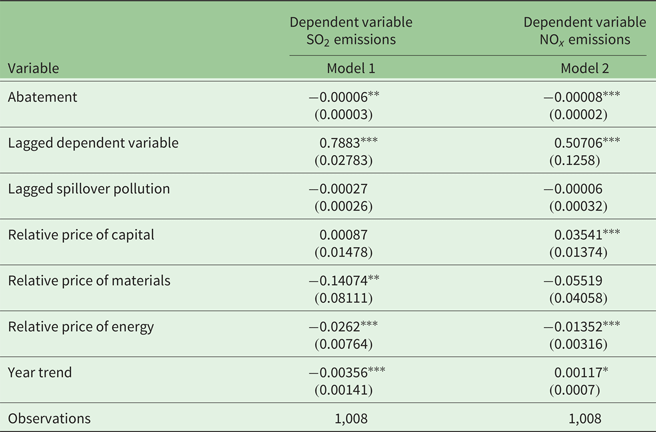
Notes: The estimated model includes state specific effects. Emissions are measured in million tons. Gross output and abatement are measured in millions of 1992 US$. The 48 contiguous states are included in the dataset. The states of Alaska, District of Columbia and Hawaii are excluded from the sample.
The weight used for the construction of the spillover pollution variable is: weight = 1 if distij ≤ median distance between states i and j. The sample median distance between states is 1,091 miles (mean distance is 1,194.5 miles).
***p < 0.01, ** p < 0.05, *p < 0.1.
To test the validity of the semiparametric model specification in (6) against a more general semiparametric model where abatement is also included in the θ function, the nonparametric test proposed by Fan and Li (Reference Fan and Li1996) is performed.Footnote 13 The p-value of the test is 0.35 and 0.43 for SO2 and NOx, respectively. Therefore the null hypothesis of the semiparametric model in (6) cannot be rejected and emissions are found to be linear in abatement. Next, looking at the results for NOx in figure 2, it looks like a straight line can be fitted through the confidence bands. In order to test if the model (6) that generated the plotted results is linear (for both SO2 and NOx), a specification test proposed by Li and Wang (Reference Li and Wang1998) is carried out. The test results indicate that the null hypothesis of a linear parametric model is rejected for both pollutants in favor of the semiparametric model (the p-value is 0.02 for SO2 and 0.01 for NOx).Footnote 14 The Li and Wang test is also performed to test the nonlinear parametric model in (8) against the semiparametric model in (6). Although the test results are marginal (the p-value is 0.05 for SO2 and 0.04 for NOx), the evidence is still against the null and therefore the nonlinear parametric model is rejected against the semiparametric alternative.
Finally the test is performed for the null hypothesis of a quadratic parametric model (equation (8) but without the cubic term) against the semiparametric model in equation (6). The quadratic parametric specification gives rise to an inverted-U shaped relation (i.e., EKC), hence the results of this specification test are of particular interest.Footnote 15 The test results indicate that the null hypothesis of a quadratic parametric model is rejected for both pollutants in favor of the general semiparametric model (the p-values are 0.03 for both SO2 and NOx). This indicates that the semiparametric model allows for a more general nonlinear structure that includes possible interactions that cannot be captured by the quadratic parametric specification. Summarizing, since the model is tested and it is not linear, then a model that is free from functional from restrictions on the output is always preferable.
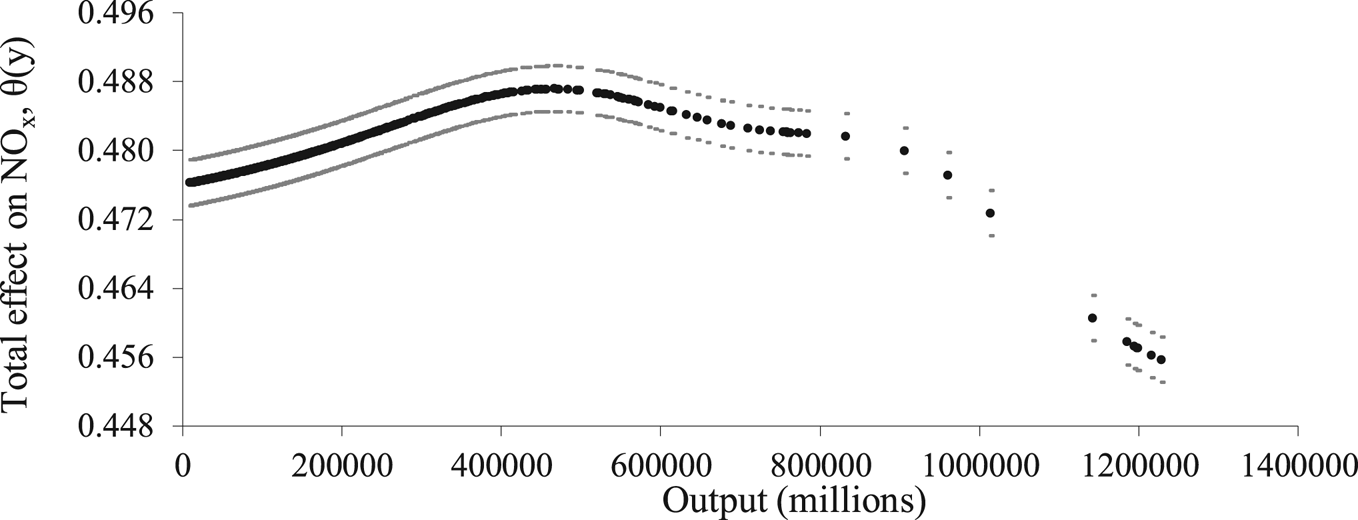
The estimated shape of the relationship between emissions and output is plotted in figures 1 and 2, for SO2 and NOx respectively. The estimated function θ (y it) on the vertical axis, along with the 95 per cent upper and lower pointwise confidence intervals, are plotted against the level of output on the horizontal axis. The estimated shape for SO2 shows that the effect of output on emissions follows an increasing pattern that flattens out before increasing again at higher output levels, indicating that the relationship is nonlinear. The effect of output on NOx emissions is also positive and follows an increasing pattern.Footnote 16 Overall, according to the plotted nonparametric estimates, there is no indication that an EKC type of relationship exists between emissions (of each of the pollutants) and output.
Table 1 presents the semiparametric estimates of the variables included in the linear part of model (6). Abatement has a negative effect on emissions as expected; all else equal, emissions are reduced as long as pollution abatement increases (this can be represented graphically by a downward shift in the emission-output function). The relative prices of the inputs (except for the relative price of capital) also have a negative effect on emissions. That is, all else equal, the emission-output function shifts down when the relative prices of the inputs increase. The results for the price of energy and the price of materials are the most interesting and intuitively appealing since energy and materials are considered to be the main pollution generating inputs. It seems that increases in the price of, for example, energy result in energy reductions in the production of both the output and abatement activities with the former being the dominant one thereby causing emissions to fall.
What is also interesting is that when the relative price of capital increases, emissions increase. This effect is statistically significant only for NOx. The relative price of capital having a positive effect on NOx emissions indicates that capital and the ‘dirty’ inputs (at least one of the two) are substitutes in production; an increase in the price of capital results in increased energy and/or materials usage, thus causing emissions to rise. It could be that as capital becomes more expensive, capital is not renewed and that obsolete technologies are in use. Obsolete technologies usually require more fuel (become more pollution-intensive), thus causing NOx emissions to rise. For example, since more than half of NOx emissions come from mobile sources, this can be related to the technology of fuel combustion related to mobile sources. By the same argument, decreases in the price of capital can lead to investment in renewed technologies that require less energy and/or materials usage, thus causing emissions to fall. Further argumentation on this requires additional empirical investigation.
As far as the effect of ‘neighboring’ states' emissions, with neighbors being the states that are less than 1,091 miles (median distance) away from each other, the sign of the pollution spillover variable is negative but statistically insignificant for both pollutants. This means that, given all the other factors affecting emissions, states do not change their emissions according to the emissions of their neighbors. Overall, excluding pollution spillovers altogether from the analysis has no effect on the remaining variables and on the shape of the relationship between emissions and output.Footnote 17
This finding is in contrast to Maddison's (Maddison, Reference Maddison2006) results. He uses a similar weighting scheme in which he specifies countries as neighbors if the distance between them is less than 1,750 miles. Using this weighting scheme, he accounts for the effect of neighboring countries emissions per capita when estimating EKCs for a group of 135 countries. He finds that the coefficient of neighbors' per capita emissions is positive and statistically significant (for the emissions of SO2 and NOx). Maddison (Reference Maddison2007), using a set of 25 European countries, also finds that countries follow the emissions per capita of their neighbors. The different dataset and the variables he employs in both papers allow no further comparisons between the results.
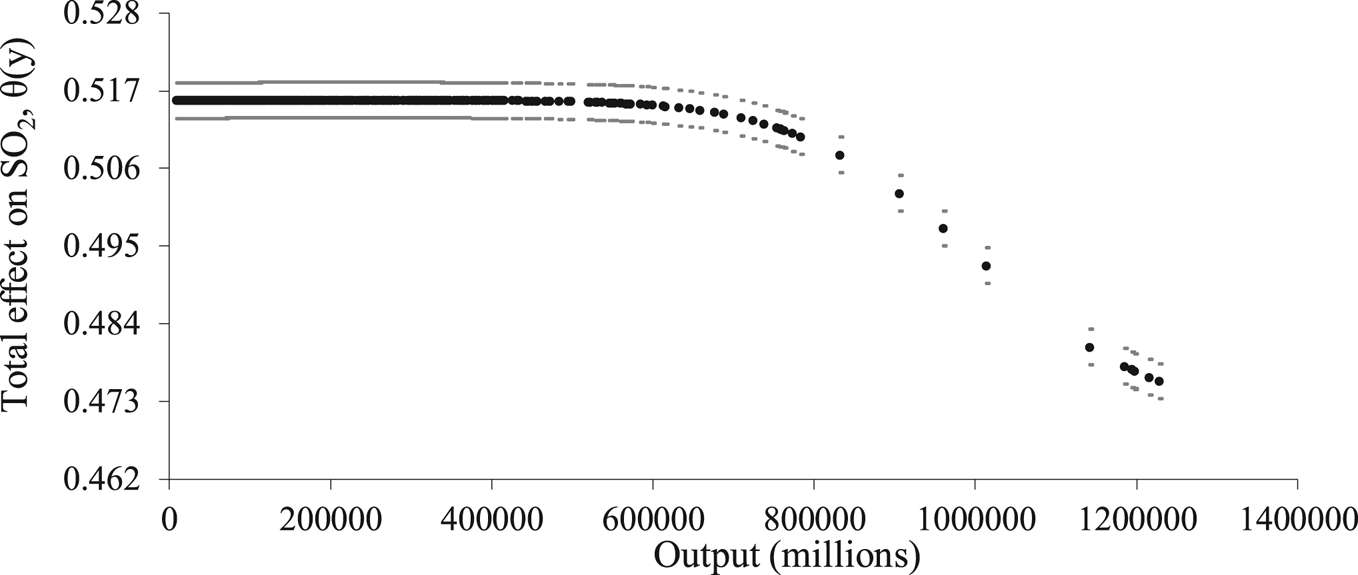
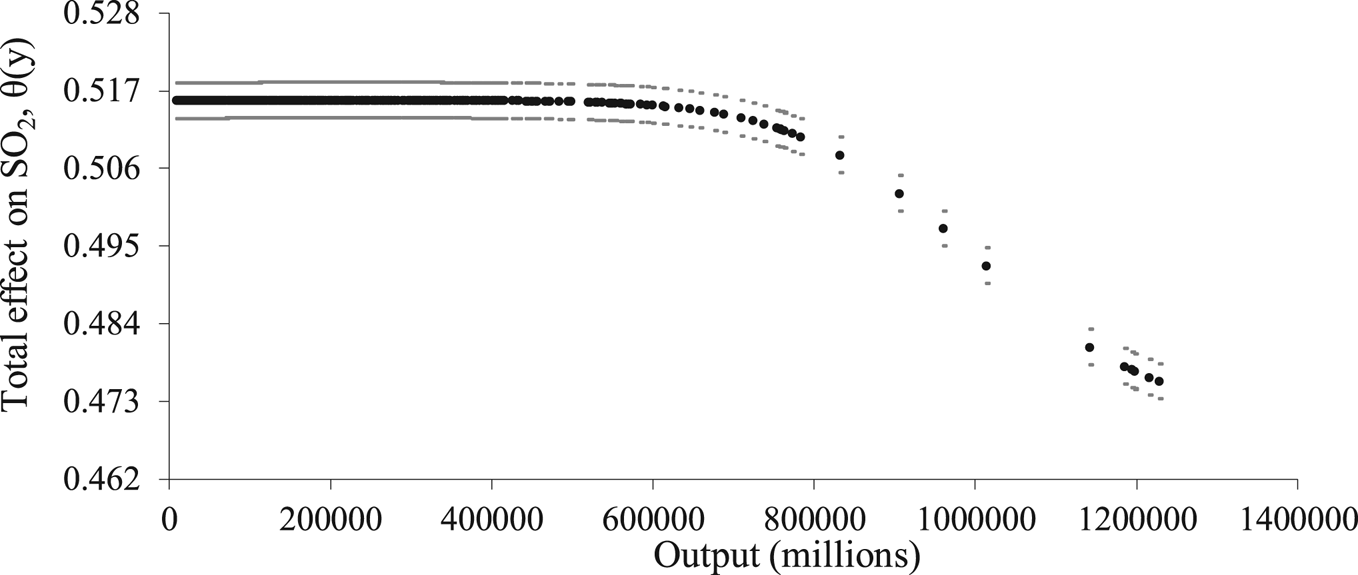
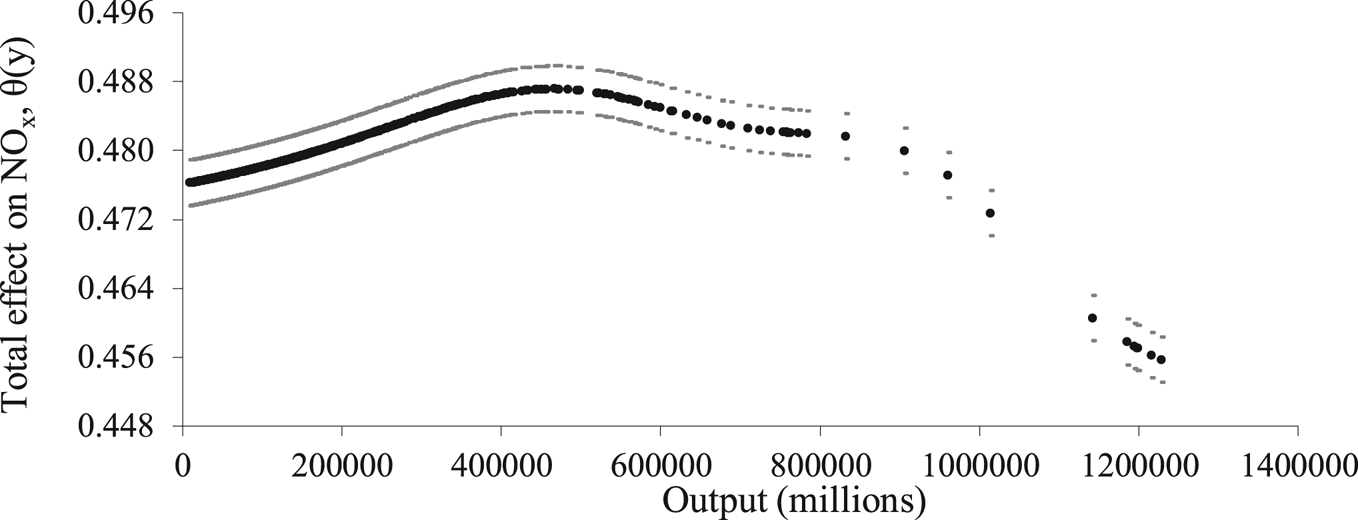
As a final step, it is interesting to see what happens when the model in (6) is estimated without abatement. Figures 3 and 4 plot the relationship between emissions and output (for SO2 and NOx respectively) when abatement is not included amongst the regressors. Interestingly, the shape of the relationship between the two pollutants, SO2 and NOx, and output now turns around. That is, the increasing (and somewhat convex for SO2) effect of output on emissions has now turned into a more concave one.Footnote 18 Now at high levels of output, the positive effect of output on emissions starts to diminish with increases in output and falls at very high output-state observations. It seems that by not including abatement in the regression, output is capturing the omitted abatement effect resulting in an EKC type of relationship between emissions and output.Footnote 19
Effect of output on SO2 emissions (abatement excluded).
Effect of output on NOx emissions (abatement excluded).
In the literature three theoretical explanations are put forward about the EKC (for an overview, see Israel and Levinson, Reference Israel and Levinson2004). These are: the technology constraints explanation (John and Pecchenino, Reference John and Pecchenino1994; Stokey, Reference Stokey1998), the institutional constraints explanation (Jones and Manuelli, Reference Jones and Manuelli2001), and the returns to scale explanation (Andreoni and Levinson, Reference Andreoni and Levinson2001; Plassmann and Khanna, Reference Plassmann and Khanna2006). The last explanation argues that as countries become richer, abatement becomes cheaper. Israel and Levinson (Reference Israel and Levinson2004: 3) note that ‘Each of these three explanations predicts that pollution levels will rise and then fall with economic growth. They are, therefore, indistinguishable empirically using only data on countries’ incomes and pollution levels.’ The explicit use of abatement in this study allows only for general inferences related to the third theoretical explanation; comparing the results with and without abatement, these show that the absence of pollution abatement is a driving force for an EKC to emerge. Managi (Reference Managi2006), using a panel dataset for the 48 U.S. states, also accounts for (water-related) pollution abatement expenditures explicitly when investigating the existence of an EKC relationship for agriculture environmental degradation. He also finds that abatement does play a significant role in defining the relationship between indicators of environmental degradation and output.
Summarizing with regard to the role of pollution abatement, the estimation shows that with abatement in the model,  ${\partial e} / {\partial a}=\sum\nolimits_{l=1}^{L} {\lpar {\partial g} /{\partial h_{l} }\rpar \lpar {\partial h_{l} } /{\partial a}\rpar +\lpar {\partial g} /{\partial a}\rpar <0} $. For the effect of abatement to be negative, it means that the last term, which is negative, is larger in absolute value from the first term – in the case that this is nonnegative – thus causing emissions to fall. Controlling for the effect of abatement, an EKC type of relationship between emissions and output is clearly rejected. When abatement is omitted from the regression, output captures this omitted effect which, as it seems, is larger in magnitude than the positive (marginal) effect of output on emissions, thereby causing emissions to increase but at a diminishing rate and eventually fall at high levels of output. Omitting abatement from the regression leads to misspecification biases, as far as the effect of output on emissions is concerned, which might lead to the acceptance of an EKC relationship. It is widely argued in the literature that abatement is one of the major driving forces for an EKC relationship to emerge. This paper provides empirical proof of that.
4.2 Threshold estimation
As complements to the results of the semiparametric estimation, the threshold regression results are presented below. The specification of the model in the threshold regression – below and above the threshold level – is linear; nonlinearities throughout the sample are best revealed by the nonparametric estimates. The main purpose of the threshold regression is to identify thresholds in output, if any, and to serve as a test for the robustness of the nonparametric results.Footnote 20
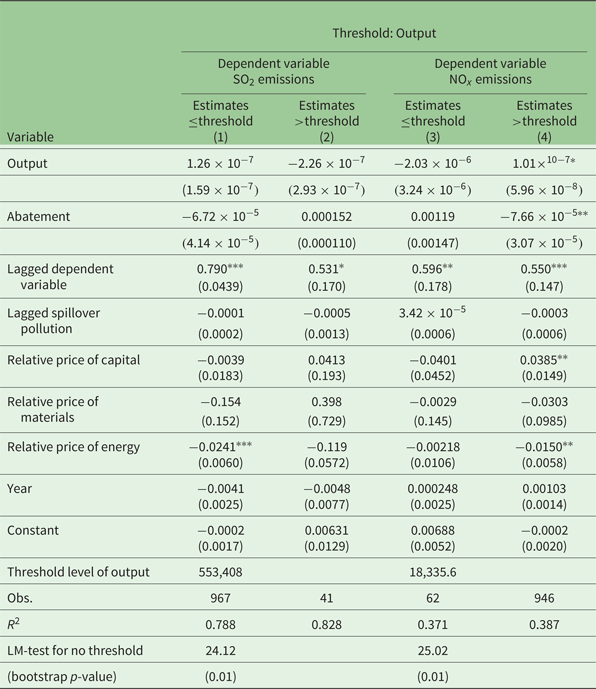
The estimated model in equation (7) is presented in table 2. Columns (1) and (3) correspond to estimates below the threshold level of output for SO2 and NOx respectively, and columns (2) and (4) correspond to estimates above the relevant thresholds. In order to determine if the threshold regression model is statistically significant relative to a linear specification, the following null hypothesis is tested:H 0 : β 1 = β 2 for equation (7).Footnote 21 The values of the Lagrange Multiplier (LM) test are 24.12 and 25.02 for SO2 and NOx respectively. The p-value for this test is 0.01 in all cases. Thus, based on 1,000 bootstrap replications, the null hypothesis of no threshold is rejected, for both pollutants.
Threshold regression estimates (1973–1994)
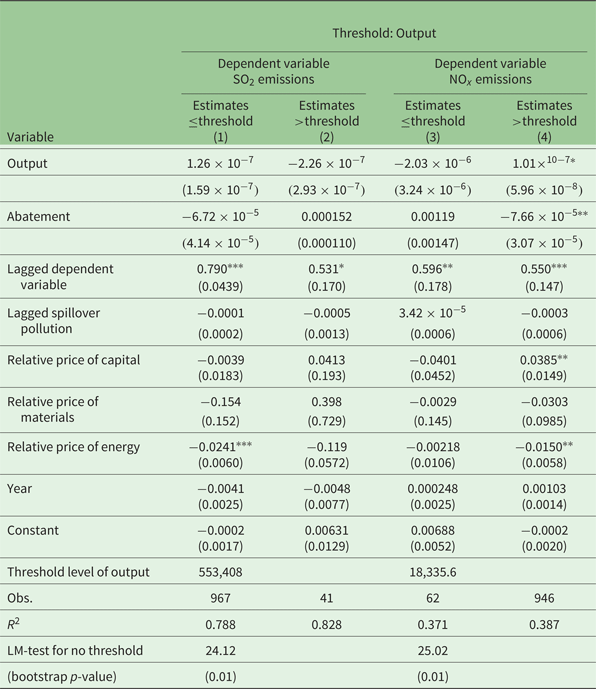
Notes: Robust standard errors in parentheses. These are the Driscoll and Kraay (Reference Driscoll and Kraay1998) standard errors which are robust to both heteroskedasticity and serial correlation of unknown form as well as cross sectional dependence.
The estimated model includes state specific effects.
Emissions are measured in million tons. Gross output and abatement are measured in millions of 1,992 US$. The 48 contiguous states are included in the dataset. The states of Alaska, District of Columbia and Hawaii are excluded from the sample.
***p < 0.01, **p < 0.05, *p < 0.1.
The threshold model gives a threshold of output at the level of 553,408 for SO2 and 18,335.6 for NOx.Footnote 22 Although the threshold is statistically significant, it is nevertheless at a point in the data where the number of observations below (for SO2) and above the threshold (for NOx) does not allow for valid inferences. For SO2 the number of observations below the threshold estimate of output is 967 (only 41 observations above the threshold); that is, most of the data are below the threshold. For NOx, the number of observations above the threshold estimate is 946 (only 62 observations below the threshold). When the threshold regression was estimated and tested for just the output term (controlling for the other regressors), the results show that the threshold variable value (output) is now, 170,910 for the SO2 regression and 676,546 for the NOx regression (in millions of 1992 US$). The values of the LM (p-value) test are 7.17 (0.14) and 5.54 (0.27) for SO2 and NOx respectively. The p-values indicate that, based on 1000 bootstrap replications, the null hypothesis of no threshold cannot be rejected, for both pollutants. That is, no statistically significant thresholds exist in the relationship between each of the two pollutants and output.Footnote 23
The threshold levels of output, for both SO2 and NOx, are marked in figures 1 and 2 of the nonparametric estimates.By looking at the thresholds placed on the figures, it becomes more evident that the threshold levels of output are at a point in the output data series where they cannot be taken as a point of change in the relationship between emissions and output. Specifically for NOx, it is rather the beginning of an upward sloping relationship. Aslanidis and Xepapadeas (Reference Aslanidis and Xepapadeas2006), who also utilize the same data on the two pollutants and estimate thresholds of per capita income when examining the emissions-income relationship, find an inverse-V shaped emissions-income relationship. Contrary to Aslanidis and Xepapadeas (Reference Aslanidis and Xepapadeas2006), the estimates in this paper show that no threshold exists in support of such a shaped relationship. The different findings can be attributed, first of all, to model and variable differences; a main difference is that they do not explicitly account for pollution abatement or regulations. Instead they set environmental stringency to depend on various levels of per capita income. Also the time period of the data is different.
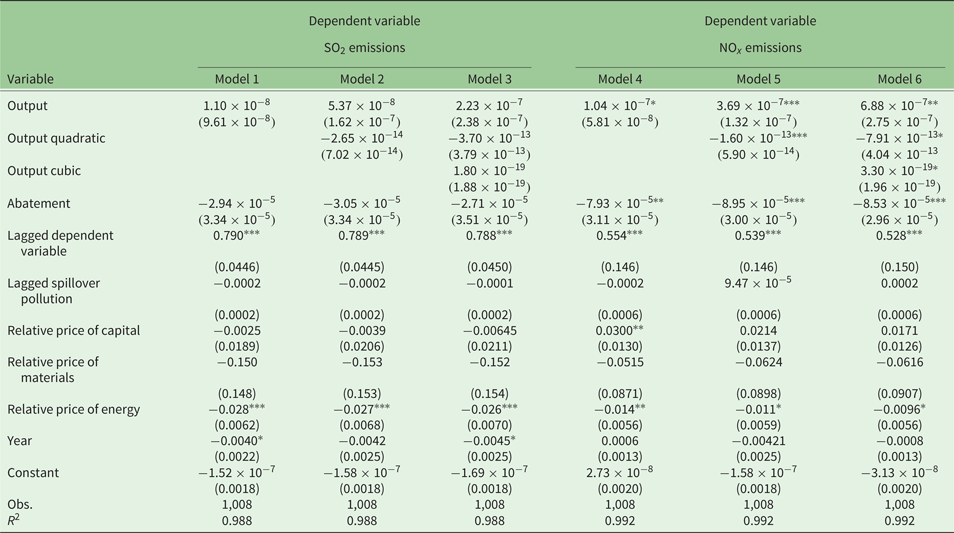
Last, as is common in the literature and for comparison purposes, three parametric specifications of the model are estimated: a linear model (output enters linearly in the regression); a quadratic model (output square is added as a regressor); and a cubic model (the output variable entering up to its cubic term (equation (8)). The results are given in table 3. Overall the parametric results imply a weak relationship between SO2 emissions and output, whereas the emissions of NOx appear to have a nonlinear relationship with output. Given that, according to the specification test results, the parametric model is rejected against the semiparametric one, the conclusions rest on the estimates of the semiparametric model.
Parametric estimation results (1973–1994)
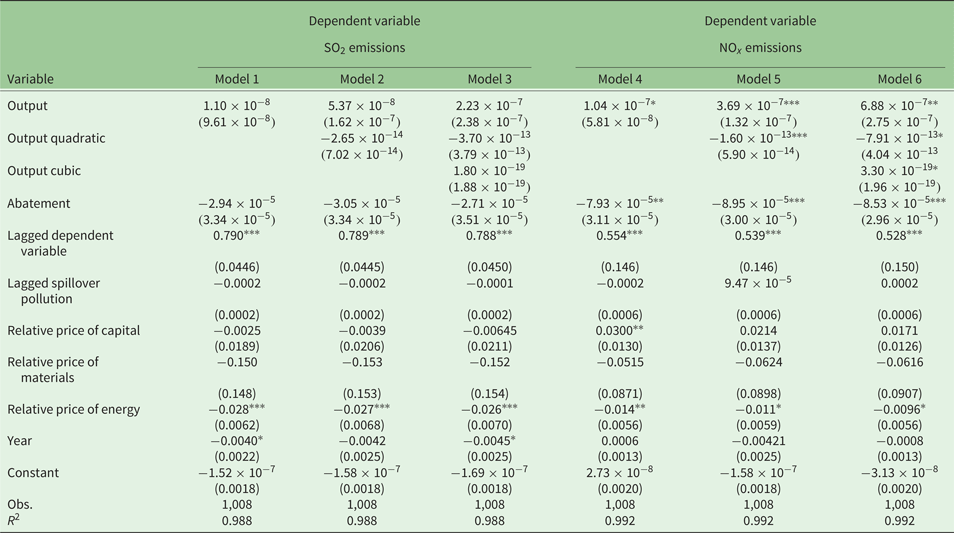
Notes: Robust standard errors in parentheses. These are the Driscoll and Kraay (Reference Driscoll and Kraay1998) standard errors which are robust to both heteroskedasticity and serial correlation of unknown form as well as cross sectional dependence.
The estimated model includes state specific effects. Emissions are measured in million tons. Gross output and abatement are measured in millions of 1,992 US$. The 48 contiguous states are included in the dataset. The states of Alaska, District of Columbia and Hawaii are excluded from the sample.
***p < 0.01, **p < 0.05, *p < 0.1.
5. Conclusion
This paper offers a comprehensive framework through which an emission function is derived. The mechanism that generates production residuals together with firms' cost minimization problem result in an emission function that depends on the level of the inputs optimally chosen in production. These conditional input demands depend on variables such as input prices. Thus a number of factors are accounted for: the relative prices of the inputs (capital, energy and materials), the neighboring states' emissions, the combined technology of output and emissions production, and the level of output and pollution abatement.
This function is estimated using a state-level dataset for the period 1973–1994. Two main estimation methods are employed: semiparametric estimation to uncover the shape of the relationship between emissions and output, and threshold estimation to identify possible threshold levels where the relationship changes. Specification testing shows that the semiparametric model best describes the data; the results clearly reject an inverted-U shaped relationship between emissions and output (EKC). The threshold model provides support for the semiparametric results; no significant threshold is found in the relationship between emissions and output.
Abatement is negatively related to emissions; all else equal, for any given level of output, emissions can be reduced (represented by a shift in the emission-output function), as long as pollution abatement increases. What is most interesting is that when abatement is not accounted for, an EKC emerges. This change in the relationship shows that the omission of abatement causes biases in the relationship between emissions and output which lead to the acceptance of an EKC relationship. According to the arguments in the literature, abatement is one of the major driving forces for an EKC relationship to emerge; this paper provides empirical proof of that. More importantly, the model without abatement is found to be unstable as there are significant structural breaks present in the form of thresholds.
The relationship between emissions and output is robust to the inclusion of the other determinants of emissions like the relative (to the price of labor) prices of the inputs, capital, materials and energy. With the exception of the relative price of capital, the estimates show that the input prices are negatively related with emissions; the emission-output function shifts in the opposite direction to the change in the input prices. Accounting for neighboring states' emissions (pollution spillovers) turns out to be statistically insignificant; states' emissions seem to be unaffected by the emissions of their neighbors.
The future of this research lies mostly in its applicability to settings investigating the relationship between pollutants and the production side of the economy. It can be applied to different pollutants, types of pollutants and sets of countries to further advance knowledge in the field and offer more informed insights for policy-making. It is thus especially useful for the developing economies that are facing the challenges of setting the right policies to cope with the tradeoffs between economic growth and environmental degradation.
Supplementary material
The supplementary material for this article can be found at https://doi.org/10.1017/S1355770X19000172
Acknowledgements
We would like to thank two anonymous referees and the guest editor of the journal for useful comments and suggestions that improved both the substance and the presentation of the paper.