I. INTRODUCTION
Energy storage has become more important in this century due to world's increasing energy demand and energy supply ratio. Lithium polymer batteries are acquiring an important role as energy storage devices in various important markets, in particular, consumer electronics as well as electric or hybrid cars. However, safety issues surrounding these batteries must be addressed before they can be widely utilized, because highly flammable organic solvents pose significant fire hazards under the abuse condition. Reference Yun, Song, Lee, Kim and Kim1,Reference Yuna, Kima, Leeb, Shimc and Kima2 Therefore, the research for safer and more reliable electrolyte systems is urgent, and polymer electrolytes (PEs) are promising candidates in this context. Reference Tarascon and Armand3–Reference Lee, Ju, Kim, Hwang, Choi, Sun, Kim, Scrosati and Kim5 Accordingly, there is an increasing trend in the preparation and characterization of gel PEs that exhibit high ionic conductivity, high energy density, good cyclability, flexible characteristics, and safety. Reference Yuna, Kima, Leeb, Shimc and Kima2,Reference Susan, Kaneko, Noda and Watanabe6–Reference Lu, Yan and Texter10
Nanostructured materials are currently of interest for lithium-ion storage devices because of their high surface area, porosity, etc. Ceramic fillers such as SiO2, Al2O3, TiO2, ZrO2, and BaTiO3 have also been incorporated along with the host polymer to obtain composite PEs. They improved the ionic conductivity as well as enhanced the mechanical strength and stability of the materials. Reference Borghini, Mastragostino, Passerini and Scrosati11–Reference Das, Mandal and Bhattacharyya16 The ceramic fillers promote electrochemical properties, but only by physical action without directly contributing to the lithium-ion transport process. By suitable surface modification of the ceramic particles, they can also act as the source of charge carriers. Reference Choi, Lee, Lee, Lee and Park17–Reference Nordström, Matic, Sun, Forsyth and MacFarlane19 It is of great interest to introduce inorganic materials containing dissociative lithium ions, which are based on core–shell structure with unique advantages in terms of control of the final morphology.
Over the years, borate and boronate esters have been studied for different applications. Reference Steinberg20 Mehta and Fujinami Reference Mehta and Fujinami21,Reference Mehta and Fujinami22 have produced polymers by the condensation reaction of boron trioxide and poly(ethylene glycol)s. Recently, several studies on electrolytes based on boron chemistry have been studied, indicating an increasing interest for electrolytes containing Lewis acids. Reference Forsyth, Sun, Zhou and MacFarlane23–Reference Pennarun, Jannasch, Papaefthimiou, Skarpentzos and Yianoulis27
In our previous works, boron comprising grafted and crosslinked polymers was synthesized by using BH3/THF to link different PVAs, PEGMEs, and poly(ethylene glycol)s. The resulting different polymer matrices were doped with trifluoromethane sulfonate (CF3SO3Li) at several stoichiometric ratios to get ion conductive PEs for Li-ion batteries. Reference Aydın, Şenel, Erdemi, Baykal, Tülü, Ata and Bozkurt28 Homogeneous, jel, and thermally stable materials were obtained.
In the present study, we have produced nanocomposite polymer electrolytes (NCPEs) based on borate ester graft copolymers, nano-TiO2, and CF3SO3Li for Li-ion batteries. The NCPEs were characterized by Fourier transform infrared spectroscopy (FTIR), scanning electron microscopy (SEM), thermogravimetry, and differential scanning calorimeter (DSC). Li-ion conductivity of the materials investigated by dielectric-impedance analyzer and the conductivity isotherms are expressed by the Vogel–Tamman–Fulcher (VTF) equation.
II. EXPERIMENTAL
A. Materials
PVA (degree of hydrolyzation ≥98% M w = 72,000 and 145,000 g/mol) and dimethylsulfoxide (DMSO, analytical reagent) were obtained from Merck (Germany). H3BO3, TiO2, and PEGME (average Mn = 350, 550, and 750 g/mol) were purchased from Aldrich (Germany). CF3SO3Li 97% was received from Alfa Aesar (Germany) and stored in the glove box.
B. Synthesis of the graft copolymer electrolytes
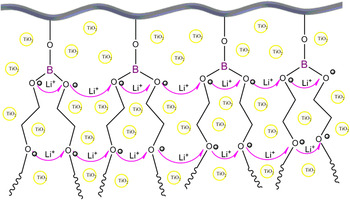
The synthesis of the boron comprising graft copolymers was carried out under the reflux, according to the esterification reaction as shown in Fig. 1. In principle, the polymers were prepared by using H3BO3 to link different PVAs and PEGMEs via the formation of borate esters. PVAs with different molecular weights were used as main host matrix. PEGMEs with different molecular weights (X = 350, 550, and 750 g/mol) were used to introduce branches or side chain segments. The molar ratio between the reactants (H3BO3, PVA, and PEGME) was kept at 1:1:2, respectively. First, PVA was dissolved in DMSO, and then PEGME and TiO2 were admixed. The nanosized TiO2 concentrations were fixed to 3 and 5 wt%. The solution was stirred continuously under nitrogen for 1 h at 80 °C until forming a homogenous milky solution. Second, H3BO3 was dissolved in DMSO, and added slowly to the previous solution. Finally, lithium trifluoromethane-sulfonate (CF3SO3Li, 97%) was added into the reaction medium. Ethylene oxide:lithium (EO:Li) ratios were adjusted to 20 and 40. The final mixture was further stirred under nitrogen atmosphere at 100 °C for 24 h.
Schematic representation of the structure of PVAPEGMEX-Y-T polymers.

Boron containing NCPEs were produced and abbreviated as PVA1PEGMEX-Y-T and PVA2PEGMEX-Y-T (PVA1 = 72,000 and PVA2 = 145,000 g/mol; X = 350, 550, and 750 g/mol; Y = 20 and 40 EO/Li; T = 3 and 5%). The materials were dried in a vacuum oven at 80 °C for several days to remove residual solvent. Finally, white and soft solid PEs were obtained and stored in a glove box under protective argon atmosphere.
C. Characterizations
The FTIR spectra (4000–400 cm−1, resolution 4 cm−1) were recorded at room temperature using a Bruker Alpha-P (Germany) in ATR system coupled to a computer.
Thermal stabilities of the obtained PEs were examined by thermogravimetry analysis (TGA) with a Perkin Elmer Pyris 1. The samples (∼10 mg) were heated from room temperature to 750 °C under nitrogen atmosphere at a heating rate of 10 °C/min.
The thermal behavior of the obtained PE samples was investigated by DSC using a Perkin Elmer Pyris 1 instrument. The samples were first cooled from room temperature to −40 °C, kept isothermally for 10 min, and then heated up to 150 °C. After the samples were cooled to −40 °C, and then finally heated to 250 °C. All thermograms were recorded at a rate of 10 °C under nitrogen flow. All DSC experiments were done in duplicate and the thermograms shown refer to the final heating.
The morphologies of NCPE films were observed by SEM (Philips XL30S-FEG, Netherlands). All of the samples were sputtered with gold for 150 s before SEM measurements.
The ionic conductivities of the NCPE samples were measured using a Novocontrol dielectric-impedance analyzer in the frequency range from 0.1 Hz to 3 MHz as a function of temperature. The samples with a diameter of 10 mm and a thickness of 0.5–1 mm were sandwiched between two gold-coated electrodes and their conductivities were measured at 10-K intervals in a dry nitrogen atmosphere.
III. RESULT AND DISCUSSION
A. FTIR study
The characteristic absorptions of the pure PVA are located at 3300, 2934, and 1100 cm−1, corresponding to ν O–H, ν C–H, and ν–C–C–O–, respectively. The peak at 1145 cm−1 (C–O, ν = 1090–1150 cm−1) can be attributed to C–O stretching. Reference Aydın, Şenel, Erdemi, Baykal, Tülü, Ata and Bozkurt28 The spectra of PEGME contain a peak at 3400 cm−1, which corresponds to the absorption by hydroxyl units. Reference Pennarun and Jannasch26 They also show strong bands at 2960–2800 cm−1 due to C–H stretching. Reference Chetri, Dass and Sarma29 In the spectrum of pure TiO2, the peaks at 550 and 1479 cm−1 show stretching vibration of Ti–O and Ti–O–Ti, respectively. Reference Venckatesh, Balachandaran and Sivaraj30
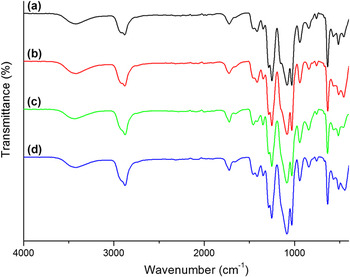
The FTIR spectra of the NCPEs containing various amounts of TiO2 nanoparticles are shown in Fig. 2. A broad and weak vibration peak at 3400 cm−1 is ascribed to OH stretching vibrations, indicating that there can be a hydrogen bond interaction between TiO2 and polymer chains. Compared to pure PVA, the intensity of −OH peaks is lowered, which illustrates high conversion to borate esters. Reference Pennarun and Jannasch26,Reference Aydın, Şenel, Erdemi, Baykal, Tülü, Ata and Bozkurt28 The vibration peaks at 2960 and 2800 cm−1, which are assigned to nonsymmetrical and symmetrical stretching vibration of CH2 groups, shifted to the lower frequencies of 2925 and 2825 cm−1 because of the interaction between –CO– and TiO2. Reference Zhou, Gao, Li, Lei, Zhao and Yi31
Comparison of FTIR spectra of PVA1PEGME350-20-3 (a), PVA1PEGME350-20-5 (b), PVA1PEGME550-20-3 (c), and PVA1PEGME550-20-5 (d).

In addition, PEs show the absorption peak at 514 cm−1 assigned to the characteristic vibration of TiO2 and weak peaks at 667 cm−1 due to B–O units. Reference Aydın, Şenel, Erdemi, Baykal, Tülü, Ata and Bozkurt28,Reference Chetri, Dass and Sarma29,Reference Şenel, Bozkurt and Baykal32 The absorption bands at ∼1029 and ∼1350 were assigned to the vibration of B–O–C bond and to the anti-symmetric stretching vibration of B–O, respectively, Reference Pennarun, Jannasch, Papaefthimiou, Skarpentzos and Yianoulis27,Reference Aydın, Şenel, Erdemi, Baykal, Tülü, Ata and Bozkurt28 which confirms the reaction of H3BO3 with hydroxyl units of both PVAs and PEGMEs. After increasing the doping ratio, there is a broadening of the C–O–C peaks indicating a higher degree of interactions by co-ordination between Li+ and ethylene oxide. Reference Aydın, Şenel, Erdemi, Baykal, Tülü, Ata and Bozkurt28 The peak at 640 cm−1 belongs to CF3SO3Li. Consequently, these results demonstrate that NCPEs are successfully synthesized.
B. Thermal properties
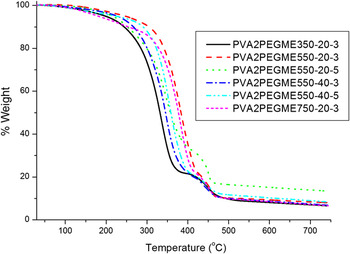
The thermal stability is an important property for PEs during application in rechargeable lithium polymer batteries. The thermal stability was evaluated by TGA for the NCPE samples with various TiO2 and Li-salt for further application in technological devices. The degradation temperature of pure PVA2 (M w=145000 g/mol) is approximately 225 °C. Reference Aydın, Şenel, Erdemi, Baykal, Tülü, Ata and Bozkurt28 Figure 3 shows the TGA results of the NCPEs PVA2PEGMEX-Y-T.
Comparison of the weight loss of PVA2PEGMEX-Y-T. The heating rate was 10 °C/min.

For all the NCPEs, two steps of weight losses were noticed within the temperature range of measurement. The elusive weight change up to 200 °C may be due to the evaporation of absorbed solvent (DMSO), which may not be removed during drying process. On the other hand, it may be due to the loss of low molecular weight compounds produced through molecular rearrangements of the polymer. The second step of the weight loss, which starts above 250 °C, is due to degradation of the materials. Above 400 °C, the NCPEs continue to decompose slowly. It is clear that the dried polymers are thermally stable up to 250 °C, which is far higher than the operating temperature of lithium-ion batteries (40–70 °C). Reference Uma, Mahalingan and Stimming33
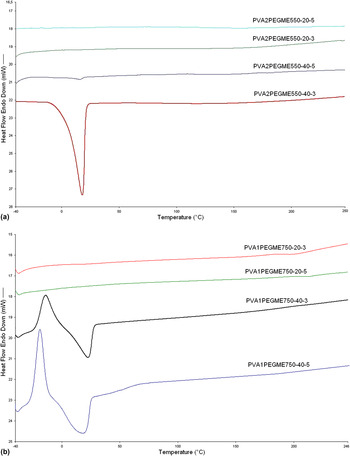
The thermal properties of the NCPEs were investigated using DSC as well. Figures 4(a) and 4(b) show the melt endotherms of NCPE samples. For all NCPE series, there is no definite T g. The PVA1PEGME550-Y-T and the PVA1PEGME750-20-T electrolyte series were fully amorphous, whereas the PVA1PEGME550-40-3, PVA1PEGME750-40-3, and PVA1PEGME750-40-5 electrolytes displayed melting transitions at 18, 22, and 18 °C respectively.
DSC curves of (a) PVA2PEGME550-Y-T and (b) PVA1PEGME750-Y-T PEs. Second heating run endotherms are presented at a heating rate of 10 °C/min.

A cold crystallization was observed at −14 °C and −19 °C in the thermogram of the electrolytes PVA1PEGME750-40-3 and PVA1PEGME750-40-5 before the melting peak. Clearly the material showed more crystalline behavior with increasing molecular weight of PEGME side chains.
C. SEM study
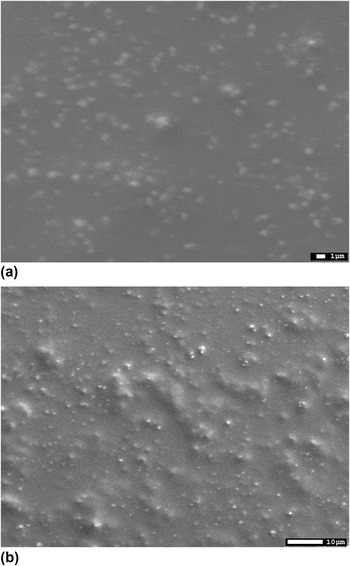
The morphology of the NCPE samples was characterized by SEM observations. Figures 5(a) and 5(b) show the surface morphology of PVA2PEGME350-20-5. For this sample, a homogeneous dispersion of white dots was observed and has been associated with the presence of TiO2. It is possible to see a very good dispersion of TiO2 nanoparticles for films, as there is not a rough area or large agglomeration. The incorporation of salt has no effect on the TiO2 dispersion, which may be controlled by polymer/TiO2 interaction, dispersion process, and solution viscosity. Reference Alloin, D’Apreaa, Kissi, Dufresne and Bossard34
SEM images of PVA2PEGME350-20-5 sample 1 µm (a) and 10 µm (b).

D. Ionic conductivity
Lithium-ion conductivity of NCPE series PVA1PEGMEX-T-Y and PVA2PEGMEX-T-Y with different interchain PEGME spacer units was measured by the dielectric-impedance analyzer. The PE films were cut into disks of 10 mm in diameter sandwiched between Pt electrodes and subjected to the impedance analyzer in a completely water-free environment. The frequency dependence of the conductivity at various temperatures has been analyzed for all samples.
The AC conductivity measurements of the NCPEs were done at 20–100 °C temperature range and at 1 Hz–3 MHz frequencies. The frequency-dependent AC conductivities, σac (ω), were measured using Eq. (1):
 $${\rm{\sigma }}\prime {\rm{(\omega )}} = {\rm{\sigma }}_{{\rm{ac}}} {\rm{(\omega )}} = {\rm{\varepsilon\prime\prime }}{\rm{(\omega )\omega \varepsilon }}_{\rm{0}} \quad ,$$
where σ′(ω) is the real part of conductivity, ω = 2πf is the angular frequency, ε0 is the vacuum permittivity (ε0 = 8.852 × 10⁻¹⁴ F/cm), and ε″ is the imaginary part of complex dielectric permittivity (ε*).
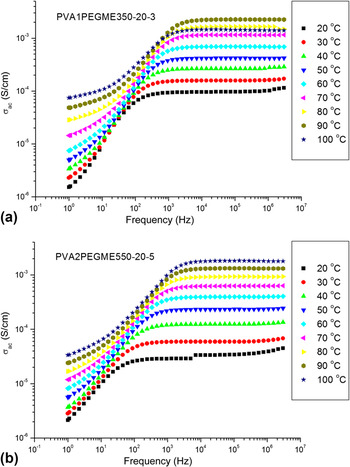
The frequency-dependent AC conductivity curves show a general trend for all samples and at all temperatures in the log–log plot. The frequency dependence of the AC conductivities (σac) of PVA1PEGME350-20-3 and PVA2PEGME550-20-5 samples at various temperatures is shown in Figs. 6(a) and 6(b). It can be observed that the AC conductivity versus frequency for various temperatures exhibits almost linear increase at low frequencies, which are assigned to the polarization of the blocking Pt electrodes, whereas well-developed frequency-independent plateaus are observed at higher frequencies.
AC conductivity versus frequency of anhydrous (a) PVA1PEGME350-20-3 and (b) PVA2PEGME550-20-5 at various temperatures.

The switchover from the frequency-independent to frequency-dependent region marks the onset of conductivity relaxation that gradually shifts to higher frequencies as temperature increases [Figs. 6(a) and 6(b)]. The frequency-independent conductivity is, in general, identified with the DC conductivity (σdc). The DC conductivities were derived from the plateaus by linear fitting of the frequency-independent region of the σac. A similar kind of frequency dispersion was observed for all other compositions as well.
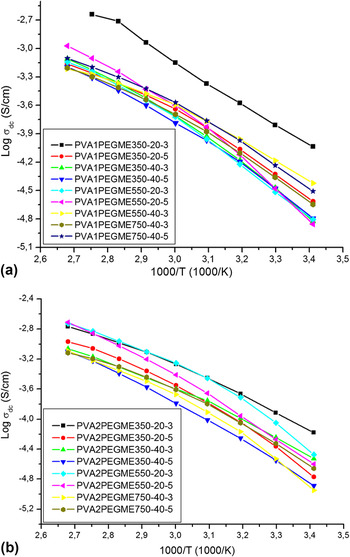
Figures 7(a) and 7(b) show the obtained σdc variation of the PVA1PEGMEX-T and PVA2PEGMEX-T as a function of temperature. It is obvious from the plots that the temperature dependence of ion conductivity did not follow the Arrhenius behavior. The curved lines indicate that the ion conduction in these NCPEs can be explained by the concept of the free volume, Reference Cohen and Turnbull35,Reference Grest and Cohen36 which is expressed by the VTF equation [Eq. (2)]. To have better insight into the temperature dependence of σdc, the conductivity data have been fitted to the equation.
 $${\rm{\sigma }} = {{\rm{\sigma }}_{\rm{0}}}{\rm{exp}} - B{\rm{/}}k{\rm{(}}T - {T_{\rm{0}}}{\rm{)}}\quad {\rm{,}}$$
where σ0 is the prefactor, T is the absolute temperature, k is the Boltzmann constant, B is an apparent activation energy, and T 0 is the equilibrium glass transition temperature at which the “free” volume disappears or at which configuration free entropy becomes zero (i.e., molecular motions cease).
Temperature dependence of the DC conductivities of (a) PVA1PEGMEX-Y-T and (b) PVA2PEGMEX-Y-T based materials.

The lithium-ion conductivity of the NCPEs can be related to TiO2 containing copolymer structure and it is reasonable to draw a model for lithium salt in this host matrix system. In this context, the copolymer has boron containing PVA backbone and flexible side chains (PEGME) as the matrix for ion transport (Fig. 1). In the novel nanocomposite containing graft copolymer system and lithium trifluoromethane sulfonate salt can be easily dissociated into cations and anions, which can be stabilized by oxygen atoms in ethylene groups of copolymer chains.
A comparison between the conductivities of the NCPEs is shown in Figs. 7(a) and 7(b). It indicates that at a given temperature, the conductivities of the PEs related to the length of PEGME incorporated in the polymer main chain and the TiO2 content. The conductivities of the NCPEs decrease with the TiO2 content for low molecular weight EO spacers and increase with the TiO2 content for high molecular weight EO spacers. Previously Raghavan et al. Reference Raghavan, Zhao, Kim, Manuel, Chauhan, Ahn and Nah37 studied the influence of Al2O3, BaTiO3, and SiO2 on the electrochemical properties of PEs based on P(VdF-co-HFP). These studies showed that the incorporation of ceramic fillers caused an enhancement in ionic conductivity, ion transference number, lithium electrode–electrolyte interfacial stability, and mechanical properties. Wall et al. Reference Walls, Zhou, Yerian and Fedkiw38 also reported that addition of nano-fillers (SiO2) in poly(ethylene glycol) dimethyl ether causes an increase in elastic modulus and mechanical strength, and simultaneously, an increase in ionic conductivity due to the increase in flexibility of the polymer chains and number of charge carriers.
It is generally considered in PEs that ionic conduction occurs by segmental motion of polymer chains in the amorphous region. Reference Shriver and Farrington39–Reference Tipton, Lonergan, Ratner, Shriver, Wong and Han41 T g is correlated with flexibility of EO chains, i.e., T g is correlated with segmental motion of EO chains. Accordingly, mobility of carrier ions in PEs is correlated with T g. Reference Papke, Ratner and Shriver42–Reference Bandara, Dissanayake and Mellancer44 The ionic conductivities of the materials in the present study [Figs. 6(a) and 6(b)] are measured above their glass transition temperatures. Maximum ionic conductivity was measured for PVA1PEGME350-20-3 as 1.58 × 10⁻⁴ S/cm at 30 °C.
IV. CONCLUSIONS
In this work, novel boron containing nanocomposite graft copolymer electrolytes, which consist of nanosized TiO2, were produced and characterized. They were doped with lithium salt at several molar ratios, with respect to EO/Li ratios. The EO units of the polymer are capable of forming donor:acceptor type bonds by complexing with the lithium ion. These PEs were characterized using FTIR, SEM, TGA, DSC, and dielectric-impedance spectroscopy. FTIR spectroscopy confirmed both the formation of graft copolymer and the existence of complexation between the nano-TiO2 and host polymer matrix. The samples are thermally stable up to 250 °C. DSC results showed that nanocomposite electrolyte showed more crystalline behavior with increasing PEGME molecular weight. Also the increase in lithium salt contents lead to an amorphous character. The conductivity studies illustrate that the ionic conductivity of these NCPEs was found to be dependent on side chain length, the TiO2 and the Li+ content. The polymer electrolyte PVA1PEGME350-20-3 illustrated a satisfactory ionic conductivity of 1.58 × 10⁻⁴ S/cm at 30 °C. These materials have high ion conductivity and can be suggested for application to lithium-ion batteries.
ACKNOWLEDGMENT
Financial support was provided by the Fatih University research funding (project number: P50021005_G) and partially supported by the Turkish Academy of Science (TÜBA).