

Presidents do many important things while in office, but few have as profound an impact as changes to the judiciary. Courts produce policy through their decisions, and the individuals who serve in the judiciary affect how law develops. Due to the lifetime tenure of federal judges, judicial appointments are one of the longest lasting legacies that presidents leave behind. The climate of 2020 made the importance of judicial appointments, and the balance of the judiciary, all the clearer. Indeed, with the passing of Ruth Bader Ginsburg in September 2020, less than two months before the 2020 election, in which the incumbent, Donald Trump, seemed likely to lose, the discussion of both appointments and the judiciary as a whole took center stage. Between disagreements over who should fill the vacancy and discussions of packing the Supreme Court should a nomination and confirmation be squeezed in before the election, the political role the judiciary holds, and the importance of who sits on the Court and how they are selected, was evident.
Because of the importance of judicial appointments, a rich literature has developed examining various aspects of the appointment process (Goldman Reference Goldman1999; Moraski and Shipan Reference Moraski and Shipan1999; Epstein and Segal Reference Epstein and Segal2005). However, each of these scholars approach the appointment process as an individual decision.Footnote 1 I propose conceptualizing appointments instead as a portfolio decision. Instead of considering what the president thinks about appointing an individual judge, considering how the president approaches choosing the best slate of judges that will create the best judiciary as a whole.
This approach does not seem particularly out of step with how the president and Senate tend to approach the issue. At no time was this more evident than during the Trump administration. Soon into the Trump administration, a narrative emerged about the changes that the president, along with the Republican majority in the Senate, were making in the judiciary due to the large number of appointments that were made (Johnson Reference Johnson2020). Trump appointed more judges to the appeals courts in four years than his predecessor Barack Obama was able to appoint in eight (Johnson Reference Johnson2020). The discussion was not about individual nominations, but about the broad shifts that were made to the judiciary as a whole. With a Republican Senate, Trump appointed over 225 judges to the federal bench, many of whom were young and very conservative, ensuring a rightward shift to the judiciary for years to come.
This is not isolated to the Trump administration. In examining nominations to the federal judiciary, it is clear that great consideration goes into each individual nomination. However, there is also evidence to suggest that vacancies are not necessarily considered individually. In fact, multiple nominations are often sent to the Senate at once. It is not uncommon for upwards of fifty names to be submitted simultaneously. At no time is this clearer than the first round of nominations that a president makes. For example, approximately four months after taking office in 2001, President George W. Bush submitted eleven nominations to the Senate on the same day.Footnote 2 In looking at nominations following a Senate recess where nominations have been returned to the president, it is even more common for nominees to be submitted together. In January 2014, at the start of the second session of the 113th Congress, President Obama submitted more than 50 names, out of a possible 92 vacancies, to the Senate on the same day.
It is possible that when thinking about nominations, the president does not think about vacancies individually. Instead, he thinks of how nominees fit together to form a judiciary that best exemplifies his preferences. A look at the distribution of nominations that are submitted together supports this idea. It is fairly common to see the president appoint multiple judges to the same court on the same day. The eleven nominations submitted by President Bush in 2001 included three to the Fourth Circuit, and two each to the DC Circuit, Fifth Circuit, and Sixth Circuit. This suggests that the president could be thinking about the overall impact he can have on a court, rather than thinking about an individual nomination.
Additionally, when names are sent together to the Senate, they are often considered together. This means that the judges are either confirmed together or returned to the president together. Of the eleven sent to the Senate in May of 2001, only one was confirmed.Footnote 3 The other ten were returned to the president under Senate Rule XXXI, Paragraph 6 in August of that year.Footnote 4
The pattern of appointments made to the judiciary suggests that neither the president, nor the Senate, necessarily thinks about these nominations individually. Rather, the two key players who choose judges consider judicial nominations more holistically: thinking about the entire judiciary, rather than individual vacancies or judges.
In this paper, I develop a simulation-based model that considers how the president chooses to fill all vacant positions in the judiciary. The model produces a portfolio of judicial appointments. These predictions include not only who is selected, but also which positions remain vacant. As a result, this is the first model of the appointment process that is able to predict behavior at multiple stages of the process (delay in selection of nominees as well as the actual nominees selected). The simulation-based approach I take allows me to formulate hypotheses about information for which good data does not exist, primarily, the role of the possible judges the president could appoint, but does not.
Judicial appointments
This paper contributes to a widely understudied aspect of judicial appointments: selection. Countless scholarly projects have focused on judicial appointments; however, most focus on easily quantifiable aspects of the appointment process, such as confirmation votes (Segal, Cameron, and Cover Reference Segal, Cameron and Cover1992; Martinek, Kemper, and Van Winkle Reference Martinek, Kemper and Van Winkle2002; Epstein and Segal Reference Epstein and Segal2005) and delay in confirmation votes (Shipan and Shannon Reference Shipan and Shannon2003; Epstein and Segal Reference Epstein and Segal2005). Far fewer projects focus on the selection stage itself (Moraski and Shipan Reference Moraski and Shipan1999; Nemacheck Reference Nemacheck2008) due, in large part, to data limitations. As a result, scholars analyzing selection have done so through formal theory (Moraski and Shipan Reference Moraski and Shipan1999; Krehbiel Reference Krehbiel2007) or by providing in-depth case studies about the appointment strategies of individual presidents (Goldman Reference Goldman1999; Slotnick 2003). Where scholars have taken an empirical approach to the selection stage, they have focused on aspects of selection decisions where data are readily available, such as the timing of the president’s selection decision (Massie, Hansford, and Songer Reference Massie, Hansford and Songer2004) and factors that affect promotion either within the federal judiciary (Savchak et al. Reference Savchak, Hansford, Songer, Manning and Carp2006; Epstein, Landes, and Posner Reference Epstein, Landes and Posner2013) or from state supreme courts (Bratton and Spill Reference Bratton and Spill2003).
The literature on appointments to the federal judiciary has developed a thorough under-standing of many aspects of the appointment process. While the results produce detailed and important differences across levels and different points in the selection process, one set of findings is consistent throughout: the ideology and qualifications of nominees, and constraint from the Senate, are important determinants of who is selected and confirmed and when. In particular, scholars have found that when the president is unconstrained by the Senate, either because they face a friendly Senate or the court in question is so extreme that the Senate would accept any nomination, the president is expected to choose a nominee located at his own ideology (Moraski and Shipan Reference Moraski and Shipan1999). As the president faces opposition from the Senate, either through divided government or because the court itself is centrist, the president must find middle ground with the Senate either by moving the court towards the Senate’s ideology or choosing a judge located at the court’s current position, status quo, so as not to change the ideological location of the court (Moraski and Shipan Reference Moraski and Shipan1999). Ideology also factors into the decision made by the Senate, with the senators being more likely to vote to confirm nominees that are ideologically similar to themselves (Segal, Cameron, and Cover Reference Segal, Cameron and Cover1992). Qualifications can mediate the role of ideology in the Senate: the role of ideology in confirmation votes decreases, though does not necessarily disappear, for more qualified judges (Segal, Cameron, and Cover Reference Segal, Cameron and Cover1992; Epstein et al. Reference Epstein, Lindstadt, Segal and Westerland2006). Qualifications have only recently made their way into the study of the selection of judges, but the literature suggests there may be a tradeoff to be made for valence characteristics of nominees above and beyond ideology (Cameron, Kastellec, and Mattioli Reference Cameron, Kastellec and Mattioli2019).Footnote 5
Given the running trend of the role of ideology and qualifications throughout the nomination and confirmation process, perhaps, rather than each step of the process occurring in isolation, one singular process produces these results. The model I create below seeks to uncover a broader theory to explain what we already know about the appointment process while at the same time providing new information and highlighting previously unexplored aspects of the process. In the model that follows, I bridge together existing theories, relying on what is known about appointments from decades of scholarly work.
Selecting judges: A portfolio of appointments
Standard selection models in political science are not adequately structured to handle portfolio-type problems. However, models of portfolio decisions are exceedingly common in economics, where scholars have developed models that optimally match two groups of people or one group of people to goods or jobs (König Reference König1931; Votaw Reference Votaw1952; Gale and Shapley Reference Gale and Shapley1962; Roth and Sotomayor Reference Roth and Sotomayor1990; Pentico Reference Pentico2007).
In creating a model of judicial appointments, I start by conceptualizing the model in a vein similar to these economic models. I am interested in finding the portfolio of judges that maximizes the president’s payoff. To create a model of the appointment process, a number of things must be considered. First, the model must be able to select the optimal set of judges for multiple vacancies in the judiciary. Second, ideology and qualifications together determine the optimal set of judges. Third, the model must be flexible to allow positions to remain unfilled. Finally, although this is a model of presidential decision-making, the Senate can reject the president’s choices.
The best way to approach this is through computer simulation. To achieve the goal of finding a portfolio of judges that maximizes the president’s utility, it is necessary to find a set of best judges. The heart of the question is game theoretic. From a game theoretic perspective, the question is complex. While there are many models that can solve for a single judge to maximize the president’s utility (Moraski and Shipan Reference Moraski and Shipan1999; Krehbiel Reference Krehbiel2007), the question is more complicated as additional judges are added and the computations necessary to answer the question increase exponentially with each additional judge added to the equation. To solve these challenges, computational simulation is a reasonable solution. This approach also allows for evaluation of a component of the appointment process for which data has always been lacking: potential judges. Even the existing game theoretic work, which considers who the president chooses, has essentially assumed an infinite set of potential judges, with the president able to choose a judge with a particular ideal point chosen from an infinite space (Moraski and Shipan Reference Moraski and Shipan1999; Krehbiel Reference Krehbiel2007). Quantitative work has faced even greater challenges, as good data for judges that were considered, but not chosen, by the president does not exist. While good, although incomplete, data exists at the Supreme Court level, with the president’s short lists (Nemechek Reference Nemacheck2008), no such data is readily available for lower courts. With this simulation approach, I have an opportunity to see how this group of potential judges affects the president’s ultimate decisions.
For this model, I assume there is some “talent pool” of individuals within the population that could be selected for a position in the judiciary who I refer to as “potential judges.” The number of potential judges may vary.Footnote 6 Potential judges can be appointed to any position in the judiciary.Footnote 7 Judges can also be promoted within the judiciary. As a result, the choice set for the supreme court consists of the talent pool and all judges on the district and circuit courts; the choice set for circuit courts consist of the members of the talent pool living in the circuit and all judges on the district courts in the circuit; and the choice set for district courts consists of all members of the talent pool living in the district.Footnote 8
The president’s objective is to select a portfolio of judges that maximizes his payoff. The president’s payoff is determined in part by his distance from each court (ctj), for all J courts in the judiciary.Footnote 9 J is equal to the one supreme court, the C circuit courts, and the D district courts.Footnote 10 For efficiency, I consider four district courts and two circuit courts.Footnote 11 This allows comparison within each level as well as across levels. It is generally assumed that Supreme Court appointments are more important to the president. To account for this, I incorporate weights, w level(j) , which reflect the importance of the court in the judicial system, where level(j) indicates whether court j is a district, circuit, or supreme court. I assume the weight increases for each level of the judiciary.Footnote 12 The president’s payoff is also determined in part by the qualifications of the judges who are appointed. I assume the president pays some cost for choosing unqualified judges.Footnote 13 The cost varies by the level of the appointment (ca,level(i)), with costs increasing for higher courts and is multiplied by the inverse of the judge’s qualification score, qi∈ (0,1]. The penalty is greater for less qualified judges. The cost is paid only when the judge’s qualifications fall below some threshold, which increases in levels of the judiciary.
The payoff function for the president consists of two components: ideological distance and qualification costs. The president’s payoff function is:
 $$ {u}_P\hskip0.35em =\hskip0.35em -\sum \limits_{j=1}^J{w}_{level(j)}{\left({ct}_j-p\right)}^2-\sum \limits_{i=1}^N{c}_{a, level(i)}\left(\frac{1}{q_i}\right) $$
Some may question whether all three levels of the judiciary should be incorporated into a single model. Previous studies have shown that for appointments to all levels of the judiciary, decisions are dictated largely by the ideology and qualifications of the judges (Segal, Cameron, and Cover Reference Segal, Cameron and Cover1992; Martinek, Kemper, and Van Winkle Reference Martinek, Kemper and Van Winkle2002; Epstein and Segal Reference Epstein and Segal2005; Binder and Maltzman Reference Binder and Maltzman2009). The weights in the model allow the president to place greater emphasis on certain appointment decisions without dictating a specific behavior with respect to where judges are placed. By incorporating different weights and different costs for vacancies at each level, the model is able to handle these differences in the importance of vacancies at each level of the judiciary.
The Senate’s preferences are not incorporated into the president’s payoff function; there is no reason to anticipate that the president gains or loses utility based on whether the Senate’s utility is maximized. Instead, the Senate blocks or accepts nominees. I assume perfect information, where the president knows whether the Senate will accept a nominee based on her ideology and qualifications.Footnote 14 The Senate makes its decisions with respect to its own payoff function.
The president’s strategy is to appoint judges such that the appointments maximize his overall payoff subject to approval by the Senate. The Senate’s payoff is also determined by the court locations and qualifications of the judges. For the most part, the Senate’s payoff function is identical to the president’s payoff function. However, the Senate also pays a cost,
 $ {c}_{r,level(i)} $
, multiplied by the judge’s qualification score, for rejecting qualified judges.Footnote
15 Similar to the cost for appointing unqualified judges, the cost is greater for higher courts and increases for judges who are better qualified. The Senate’s payoff function is:
 $$ {u}_S\hskip0.35em =\hskip0.35em -\sum \limits_{j=1}^J{w}_{level(j)}{\left({ct}_j-s\right)}^2-\sum \limits_{i=1}^N{c}_{a, level(i)}\left(\frac{1}{q_i}\right)-\sum \limits_{i=1}^M{c}_{r, level(i)}\left({q}_i\right) $$
A broad literature suggests that there are multiple important and potentially pivotal actors in the Senate (see e.g., Krehbiel Reference Krehbiel1998; Primo, Binder, and Maltzman Reference Primo, Binder and Maltzman2008). In this model, I limit the complexity of the Senate by utilizing a single ideology score. This is, primarily, a model of presidential decision making, and, while the Senate is important as it potentially constrains the president, the internal workings of the Senate only matter to the extent that they constrain the president. Since, there is always some ideology that is potentially constraining, summarizing the Senate with a solitary ideology is sufficient. In fact, in many models of interactions between Congress and other political institutions, Congress is summarized through a solitary ideology or an interval of ideologies (Segal Reference Segal1997; Hettinger and Zorn Reference Hettinger and Zorn2005).Footnote 16
The goal of this model is to find the portfolio of judges that maximize the president’s payoff. To find the optimal portfolio, I create an algorithm that considers judges from the talent pool for vacant positions in the judiciary. A graphical depiction of the process is shown in Figure 1. The algorithm is as follows:
-
1. Vacancies occur randomly.Footnote 17
-
2. Lists of judges or potential judges located between the president’s ideology and the status quo are compiled for each court.Footnote 18 , Footnote 19
-
3. The lists for each court are aggregated into a master list.
-
4. Starting with the judge whose ideology is closest to the president, the president’s payoff is calculated for each possible appointment for that judge.Footnote 20
-
5. If the president receives a higher payoff for appointing the judge to at least one of the positions than for not appointing her to any, the judge is appointed to the position that gives the president the highest payoff that the Senate will confirm.
-
6. If the president does better by not appointing the judge (or if the Senate will block the appointment to any position), the president moves on to the next closest judge.
-
7. Steps 4 through 6 repeat until all vacancies are filled or all judges have been considered for all positions.
Simulation Algorithm.

A few final notes on the computational setup for the model. The model is dynamic only in the sense that the president’s actions in the last round affect his options in the current round.Footnote 21 Each round (or iteration) represents a year. To ensure that there are adequate simulated appointments for new presidents and continuing presidents, I update the ideologies of both the president and Senate based on the United States election cycle. Changes to the ideologies of the Senate and president occur every two and four years, respectively. Every four years, with some probability, the president stays in office and the ideology of the president carries over for another four years, otherwise a new president is randomly chosen. Every two years, with some probability the Senate’s ideology shifts slightly (the same party retains control), and a small value is added to the Senate’s ideology score, otherwise a new ideology score is chosen at random. To reflect natural changes in the pool of potential judges, at the end of each year, some set of judges leave the talent pool and are replaced by a smaller group of potential judges centered around the president’s ideal point.Footnote 22 Programming details for the computational model can be found in the online appendix. To help clarify this algorithm, a small example can also be found in the online appendix.
I have simulated 5,000 iterations of the model for each of three different initial talent pool sizes. For each run, I store information for only the latter 3,000 simulations.Footnote 23 The Supreme Court consists of nine members; the two circuit courts have 29 and 17 judges, respectively; the district courts have 28, 13, 19, and 12 judges, respectively.Footnote 24 The 9,000 simulated portfolios that I have saved provide roughly 66,000 appointments. In the next section, I describe the patterns of the simulated appointments.
Results
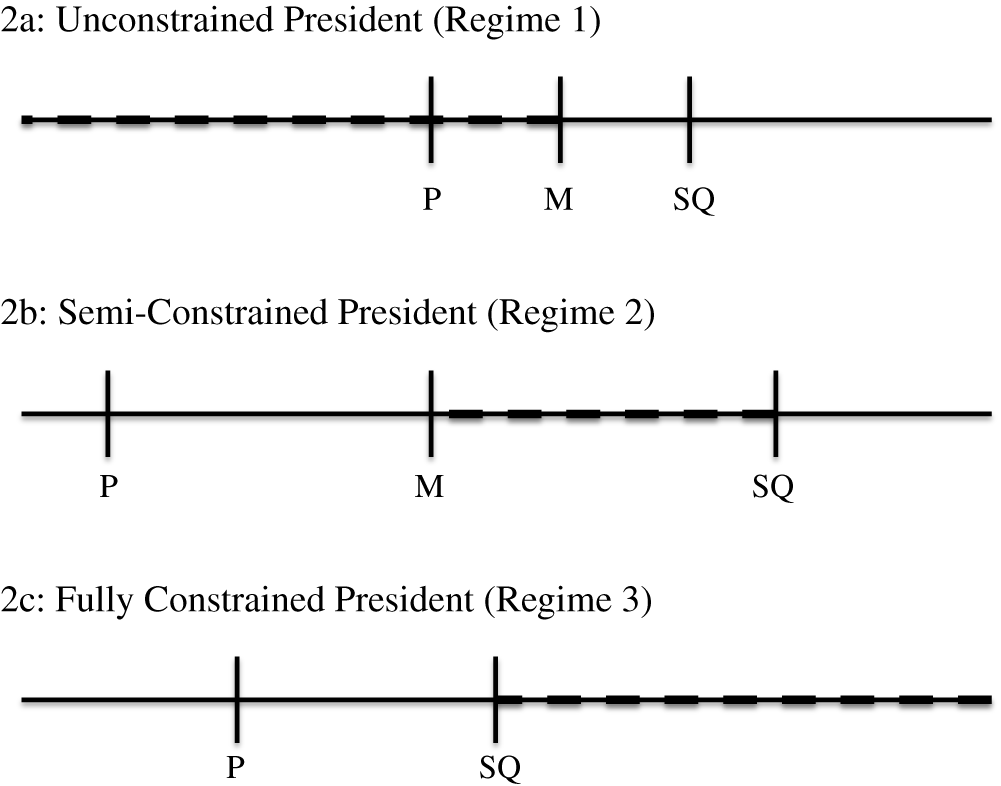
To assess the results of the simulations, I will utilize the concept of constraint found in previous literature. I conceptualize constraint in two ways: either binary where the president is either constrained or unconstrained or as “regimes” of constraint; the president is either unconstrained, semi-constrained, or fully constrained, stemming from Moraski and Shipan (Reference Moraski and Shipan1999). I utilize the latter approach, regimes, when discussing individuals who have been selected, as these regimes have been shown to yield different expectations about who is selected. Figure 2 shows how the preferences of the president, Senate, and status quo determine the level of constraint the president faces. The president is unconstrained when the Senate is located to the left of M, the midpoint between the president and the status quo, which is the dashed region in Figure 2a. If the Senate is located in this region, the president can appoint a judge at his ideal point and the Senate will prefer the appointment of the judge to the status quo. The president is semi-constrained when the Senate is located between M and the status quo, the dashed region in Figure 2b. In this region, the Senate prefers the location of the status quo to the president’s ideal point, so is more likely to reject a judge located at the president’s ideal point.Footnote 25 The president is fully constrained if he and the Senate are located on opposite sides of the status quo, the Senate is located in the dashed region in Figure 2c. In this regime, the Senate prefers the location of the status quo to any movement of the court towards the president’s ideal point. I utilize a binary approach when discussing results for which the individual selected is not important, particularly when discussing whether the president chooses to fill a vacancy at all. I utilize this approach rather than the regimes of constraint, since previous literature has shown that the president can improve the status quo when either unconstrained or semi-constrained, but not when constrained (Moraski and Shipan Reference Moraski and Shipan1999). My expectation is that the president would choose to fill all vacancies for which he can improve the status quo first, and then focus on filling vacancies where he cannot only so long as nominees exist that at least maintain the status quo. To simplify, the binary classification (constrained or unconstrained) will suffice for any outcome of the model in which it only matters whether the president and the Senate can agree on which direction to move the status quo – for example, when considering whether the president fills a given vacancy. However, this is not as informative when considering who is actually appointed, so I take the “regimes” approach for any analysis considering the actual individual selected.
President’s level of constraint. The arrangement of preferences of the president, senate, and stats quo determine the level of constraint the president faces from the senate. P represents the president’s ideal point, SQ represents the status quo, or the location of the court before any of the vacancies are filled, and M is the midpoint between the president and status quo. The president faces a particular level of constraint when the Senate is in the dashed region of that figure.

Ideology of judge
There are a number of moving parts in the model. One question that this model can answer that has not been addressed in previous literature is where the president appoints judges whose ideologies are most similar to his own. Since the president’s strategy is to maximize his payoff through his appointments throughout the judiciary, a baseline expectation is that the president would simply appoint judges directly at his ideal point. Previous literature has highlighted the role of the Senate in constraining the president’s ability to do so; however, he must also contend with finite resources. To get a sense of the ideologies of the appointed judges, I have graphed the average distances between the president and the selected judges in Figure 3. I have plotted the means for different levels of presidential constraint and for different levels of the distance between the president and the status quo.Footnote 26
Proximity of Appointed Judge. The x-axes are the level of constraint. The y-axes are the mean distances between the president and appointed judges. Values towards the top of the graph represent judges located farther from the president. 95% confidence intervals are graphed around the means.

The first thing that is evident from Figure 3, is that the judges the president selects are located farther away when the president is constrained which is consistent with previous research (Moraski and Shipan Reference Moraski and Shipan1999). The simulation also uncovered a novel result in relation to this effect: the effect is larger the farther the president is from the status quo. When the president is located farther from the status quo, there is more room for negotiation with the Senate in terms of producing judges who are favorable to the status quo. As the president’s distance from the status quo increases, he is more willing to accept judges farther from his ideology.Footnote 27 This might help to explain why at times we see the president is more active in appointments to particular courts over others. Perhaps one of the reasons that the president is more active in appointments to particular courts is because he is located farther from these courts, presenting more possible appointees and greater room for agreement with the Senate.
Of greater interest is where the judges who are most ideologically similar to the president are appointed. For all measures of the distance between the president and status quo, judges who are closest to the president are selected to higher courts when the president is unconstrained, but the judges appointed to the lower courts are closer to the president than the supreme court when the president is fully constrained.Footnote 28 When the president is semi-constrained, the placement of the president’s closest ideological allies is dependent on the distance between the president and the status quo. When the president is closer to the status quo, he continues to place the judges who are closest to him on the supreme court; when he is a moderate or greater distance from the status quo, his ideological allies are placed on circuit courts first. This suggests that the extent to which the president is constrained in this region may depend on how far he is from the status quo.
This initial result is promising. Conventional wisdom about judicial appointments suggests that judges who are most similar to the president will be appointed to higher courts, which is mostly confirmed in the results presented here. However, while the model is structured such that there is some bias towards this result (with greater weights afforded to higher courts), it does not hold for each iteration of the model, nor does this finding hold when the president is most constrained. This suggests that some conventional wisdom may not hold when considering how individual appointment decisions influence other similar decisions. More importantly, this provides us with new information about what we should expect from the president based on how far he is from the status quo, especially when he is constrained. Also, this might provide us with an insight into why the president at times focuses on particular courts to the neglect of others.
To demonstrate what this means practically, I compare two presidents: Obama and Trump. What this result suggests is that while the Trump was able to make a lot of appointments, and many of the appointments were at the lower courts, that the judges he appointed to the Supreme Court – Kavanaugh, Gorsuch, and Coney Barrett – would be the closest to him ideologically. Manning, Carp, and Holmes (Reference Manning, Carp and Holmes2022) show that Trump’s appointees to the district courts have been consistently conservative, more so than other Republican president. As to how that compares to his appointees to the Supreme Court, it is hard to say for certain, since there are not comparable metrics across the judiciary; however, the three nominees were consistently discussed as conservative nominees and the Gorsuch and Kavanaugh Segal-Cover scores are in the same range as other Republican nominees appointed during periods of a unified Senate and president.Footnote 29 In contrast, for Obama, this would suggest that while facing an opposition Senate during his last two years in office, the president would have had to compromise on higher courts, focusing his ideological allies on the lower courts, who would serve time and maybe someday be promoted by another Democratic president. Again, direct comparison is difficult, but one quick comparison would be the nominations of Sotomayor, Kagan, and Garland. Garland was the only of the three nominated during divided government. While Sotomayor and Kagan were seen as reliably liberal, Garland on the other hand was seen as very moderate. There is no evidence to suggest the same shift occurred, however, for the lower court judges that Obama nominated during this same period. While the overall confirmation rate of the nominees in this two-year period was low both due to usual obstruction and the fact that it was the end of Obama’s second term, the nominees that were confirmed appear to have provided reliable liberal decisions once on the bench. This would suggest that had the Garland nomination been successful, the closest appointees in this two-year period would have been to lower courts.
Qualifications
Another dynamic of interest is the appointed judges’ qualifications. The mean qualifications of the judges appointed in the simulations are plotted in Figure 4. The qualifications are graphed per court for each level of constraint.
Qualifications of Appointed Judge. The y-axis is the qualifications of the appointed judges. Values towards the top of the graph represent judges with higher qualifications. The x-axis measures the level of constraint the president faces from the senate. 95% confidence intervals are shown around each mean.

The qualification scores of the appointed judges always increase for higher positions. This result follows from the structure of the model. The qualification thresholds are higher for higher courts, so more qualified judges are appointed to these courts. More interestingly, qualifications increase as the president becomes more constrained. As the president becomes more constrained, he has a greater incentive to choose judges whose qualifications are above the threshold at which the Senate would pay a cost to reject the judge. This ensures that the Senate will be more likely to confirm the judge and will do so if the cost of rejecting exceeds the shift in the court location away from the Senate’s ideal point. Moreover, while the variance in qualification scores is roughly equal when the president is unconstrained and semi-constrained, the variance is smaller when the president is fully constrained for each level of the judiciary, since he must select judges whose qualifications are above the rejection threshold or the Senate will reject his nominees.
This suggests a new way to think about the findings of Epstein et al. (Reference Epstein, Lindstadt, Segal and Westerland2006). They find that the effect of ideology is lessened when the nominee’s qualifications are high. A strategic president would thus be more likely to choose qualified judges when trying to appoint judges whose ideologies might otherwise be objectionable. Thus, when the Senate presents more of a threat to the president’s ability to choose nominees with the ideology that he wants, he is more likely to choose better qualified judges so that he has an increased chance at getting his nominees through the Senate. Normatively speaking, this would suggest that divided government is potentially good in that it leads to better qualified nominees.
Practically speaking, again comparing the Trump presidency to the Obama presidency, this result would suggest that we could expect better qualified nominees coming from Obama in his last two years during divided government than Trump throughout his presidency. Anecdotally, this seems to be the case, looking at the American Bar Association’s (ABA) ratings of the nominees presented to the Senate, none of Obama’s nominees received a rating of “not qualified,” while ten of Trump’s nominees received this rating. Since the ratings across presidencies might reflect the biases of the ABA, a look within Obama’s presidency also suggests that his last two years under divided government produced better qualified judges. While none of his nominees received a “not qualified” rating as the majority score, several received them as a minority rating. Looking just at Obama’s second term, 15 of his nominees received a “not qualified” minority rating in the 113th Congress, while only six did in the 114th, when he faced a Republican Senate.
Vacancies
A final dynamic of interest is how often the president leaves positions vacant.Footnote 30 In terms of language often used in empirical literature, this is a measure of when to expect delay in nominations. Figure 5 shows the percentage of vacancies left open when the president is constrained and unconstrained for each level of the judiciary.Footnote 31 The interplay between the president and Senate is often mentioned as the reason that many vacancies exist in the judiciary. Even the Chief Justice of the United States Supreme Court will specifically appeal to both in his year-end report (Rehnquist Reference Rehnquist and illiam2002; Roberts Reference Roberts2010). Figure 5 shows that a larger percentage of positions are left open when the president is constrained. This effect is largest for the Supreme Court, with smaller effects for the circuit and district courts.
Percentage of unfilled vacancies. They-axis measures the percentage of vacancies that are still open at the end of each round of the model. The x-axis measures the level of constraint the president faces. 95% confidence intervals are shown around each mean.

Still, Figure 5 is not overly compelling, particularly for district and circuit courts. If constraint does not fully explain judicial vacancies, what other factors might play a role? One possibility is the “accumulation” of vacancies. For lower courts, it is not uncommon for several vacancies to carry over from year to year without a nomination or confirmation. The result is an increase in the total number of positions that the president must fill beyond the vacancies that open in a given year. It is possible that these cumulative vacancies are too great for the president to fill from his available resources. Figure 6 shows how the number of vacancies left vacant in the previous round affects the president’s ability to fill vacancies in the current round. To create this graph, I take the average percentage of vacancies left open at the end of each round on each court.Footnote 32 I graph new presidents (where the ideology of the president has changed in that round) and continuing presidents separately.Footnote 33 I do so because if a president did not fill the vacancy in the last round, he is less likely to fill the vacancy in the current round as the turnover in the talent pool is minimal.
Percentage of unfilled vacancies. The y-axis measures the percentage of vacancies that remain unfilled at the end of each round. The x-axis measures the number of vacancies that were open at the start of the round, before new vacancies are realized. The relationship is modeled for new presidents, presidents in their first year, and continuing presidents, those in any year other than their first. 95% confidence intervals are graphed around the means.

When vacancies carry over from one round to the next, it affects the rate of unfilled vacancies but only for continuing presidents. For new presidents, the rate of unfilled vacancies is almost always lower than for continuing presidents and does not increase as the number of “accumulated vacancies” increase. This is to be expected as new presidents fill as many vacancies as possible to begin changing the judiciary towards their preferences. Continuing presidents, in contrast, fill fewer vacancies as the number of vacancies that they did not fill in the last round increases. This suggests that as the president appoints the judges whose ideologies are most similar to his own out of his talent pool, there are fewer judges to consider in future rounds, and the president prefers to leave positions vacant rather than move the court away. Interestingly, this could also suggest that while the effect of constraint in an individual year is small, this small effect translates to more vacancies to fill later. Since the president has already considered much of his talent pool, the expectation is that without a change in the Senate, he will likely be unable to fill new and old vacancies in the following round since much of his talent pool stays the same from year to year. These effects are compounded the longer the president faces an opposition Senate. Thus, the explanation for the type of delay we see might be a combination of political considerations and resource constraints, such as an insufficient pool of potential judges with ideologies similar to the president’s or who are acceptable to both the president and the Senate.
This connection between constraint and number of vacancies is supported in looking at the number of vacancies in the federal judiciary. If we look at the vacancies in the federal judiciary under the Obama administration under both unified and divided government, this effect is fairly clear. Looking only at the vacancies after the implementation of the nuclear option, where the senate voted to lower the number of senators required to stop a filibuster of a nomination from 60 to 50 in November 2013, the number of vacancies went from 94 to 43 at the end of the 2012 Senate term when Democrats had the majority. If we compare this to the 2014 Senate term, when the Republicans had the majority, the number of vacancies more than doubled from 43 to 112. This shows that vacancies stack up under divided government, while under unified government, the Senate and president continue to find acceptable candidates.
To further expand on the effects of resource constraints, Figure 7 shows the percentage of vacancies that are left open on each court for each initial talent pool size.
Percentage of unfilled vacancies. The y-axis measures the percentage of unfilled vacancies. The x-axis measures the initial talent pool size. 95% confidence intervals are shown around each mean.

There is a noticeable decrease on district and circuit courts for larger talent pool sizes in Figure 7. This result is to be expected: as there are more people to appoint, the president fills more vacancies. The results for the Supreme Court are a little more complex. The president leaves more positions vacant when the talent pool size is 1,000 than when it is 500 or 2,000 and the percentage of vacant positions is statistically indistinguishable between 500 and 2,000. While the choice set for the Supreme Court is the largest, the talent pool has far fewer judges who are good candidates for the Supreme Court than candidates for lower courts. Because qualifications are such a large part of the consideration of judges, particularly for the Supreme Court, where the thresholds for costs are much higher, the judges in the talent pool with low qualifications are often not good candidates for the Supreme Court. Because service on a court is considered an added qualification, and is built into the model as such, this suggests that much of the choices the president makes for the Supreme Court come from the judges already in the judiciary rather than the talent pool. Thus, larger talent pool sizes have little effect on the appointments made to the Supreme Court. This is consistent with the recent history of appointments to the United States Supreme Court, where for the last 40 years, many Supreme Court Justices have come from within the judiciary. In this time frame, there has more often been divided than unified government, which may explain why we have seen so many promotions within the judiciary. When the president and Senate have diverging preferences, the president is incentivized to choose the most qualified judges to increase the potential costs the Senate would pay to reject. The most qualified individuals happen to already be serving in the judiciary. Again, this suggests that the resources that are available to the president can play a large role in the choices he makes, particularly the choice of whether to fill a vacancy or leave it vacant.
This result is particularly illuminating as we consider what the president faces when appointing nominees. We know very little about the president’s talent pool of potential judges. What this result suggests is that the larger the scope of individuals that the president considers for an appointment to the federal judiciary, the better chance he will have of filling the vacancies in the federal judiciary. Particularly, as there is discussion on the imbalance of representation from non-ivy league law schools within the federal judiciary, perhaps this suggests the president should be open to considering potential judges from outside the ivy league while creating their pool of potential judges.
Discussion and conclusion
In this paper, I have presented a model appointing potential judges to positions within the judiciary. This work considers the portfolio of judges appointed to the judiciary rather than individual appointments, which lends itself to a particular method: simulation. This approach provides new insights that have not been explored in previous literature. In addition, this approach allows me to examine multiple stages of the appointment process simultaneously. The model predicts not only who is selected, but also when the president delays filling vacancies.
What is encouraging is that many of the results presented are consistent with previous research or conventionally held wisdom about judicial appointments: the president appoints judges located as close to his ideal point as possible, the “best” judges are placed on higher courts, and disagreement with the Senate affects both the timing to nomination and the ideology of judges selected.
However, there are also a number of insights that this model provides that have not been previously explored. This includes hypotheses about where the president chooses to focus his ideological allies, expectations about the qualifications of judges that are selected in different political environments, the long-term effect of constraint on the number of vacancies the president is unable to fill, and the role of the size of the talent pool that the president considers.
As with any theoretical model, this model is an abstraction of the process. Many of the important, complex features of the appointment process were necessarily abstracted away for the sake of efficiency and simplicity. As a result, a number of potential extensions to this model could and should be explored in future research. Such extensions include the following: incorporating multiple pivotal players in the senate; adding additional players, such as interest groups; incorporating uncertainty about Senate rejections; incorporating uncertainty about judges’ ideologies and qualifications; and allowing judges’ ideologies to shift once on the court. Additionally, varying certain components of the model that were held constant, such as the weights applied to each level of the judiciary, the qualification thresholds for costs, and even the costs themselves would yield important information about the structure of choices the president makes in filling vacancies in the judiciary.
Judicial appointments are an important part of any presidency. The model presented here shows that a number of key elements factor into the decisions that the president makes. First, the composition of the judiciary and pool of judges from which the president can appoint affect the number of vacancies in the judiciary, as well as the ideology and qualifications of the judges selected. Second, a large determinant of delay is the number of vacancies that carry over from year to year. As the president depletes his talent pool of judges and begins to leave positions vacant, it makes filling future vacancies more difficult. Thus, if the president does not have an influx of new individuals to consider throughout his presidency, this would explain the sizable vacancy counts that we often see in the United States Federal Judiciary. Lastly, Senate constraint affects every aspect of judicial selection.
This new approach can and should inform future empirical research. The results show that there is a great effect of the pool of possible judges available to the president. While there is not great data about what the pool looks like, one proxy that emerges is the distance between the president and the various courts in the judiciary. When the president is farther away, we can presume the set of available candidates that will improve the location of the court is larger. This is something that should be considered in future research. Another potential proxy is the number of vacancies that there are to fill. When there are more vacancies, it might take longer to see nominations, as this could be an indication of a dwindling talent pool. While previous research has explored the effect of constraint and divided government, the results here suggest that there is a time element as well. We might expect more obstruction or maybe fewer appointments the longer the president faces an opposition Senate. Both of these approaches come from the portfolio-type approach in this paper. When the president’s choice is considered as not just a solitary choice but a slate of choices, it informs how to think about how he approaches each individual vacancy.
Acknowledgments
I would like to thank Andrew Martin, Michael Nelson, John Patty, Keith Schnakenberg, and James Spriggs for helpful comments on drafts of this paper and John Miller and Scott Page for helpful comments on early versions of the model.
Competing Interests
The author declares no conflict of interest.
Data Availability Statement
Replication materials for this article are available at the Journal of Law and Courts’ Dataverse archive.
Supplementary Materials
To view supplementary material for this article, please visit http://doi.org/10.1017/jlc.2022.9.