INTRODUCTION
Previous studies have shown that it is possible to grow potatoes in the lower zones of Burundi (around 800 masl) where they have not been grown previously because of high temperatures. However, their yields were lower in these conditions than when they were grown in the cooler highlands (unpublished data). Five potato genotypes appeared to be less affected by heat and therefore to be better adapted to the lowlands than others. These genotypes are: 390663.8, 395194.9, 388972.22, and 388611.22 and Victoria from the International Potato Center (CIP). In the present study, our objective was to test if cropping techniques adapted to this new potato environment for Burundi could increase the crop performance. Interest was focused on two aspects of crop management: increase of planting density by decreasing the interval between rows and use of rice straw mulch.
By increasing the number of plants per unit area, an increase of tuber yields could be expected as reported previously (He et al., Reference He, Struik, He and Zhang1998; Midmore, Reference Midmore1988; Rykbost and Maxwell, Reference Rykbost and Maxwell1993). Among the reasons for this increase are the rate at which complete crop cover is achieved and the resulting modification of the microenvironment so that is is more favourable for potato development in hot conditions (Midmore, Reference Midmore1988). Normally, farmers in Burundi are accustomed to plant potato in rows 80 cm apart from each other with a distance of 30 cm between plants within rows (Harahagazwe et al., Reference Harahagazwe, Bararyenya, Hakizimana, Inamahoro, Niko and Niyongabo2007). The distance between plants within the row corresponds to the minimum distance between planting holes made by the standard hoe and would be difficult to decrease. Therefore plant density was increased through reduction of spacing between rows.
Another possible means to increase tuber yield is through mulching. Mulching has been reported to be effective for increasing potato yield in hot climates (Awan, Reference Awan1964; He et al., Reference He, Struik, He and Zhang1998; Kar and Kumar, Reference Kar and Kumar2007; Midmore, Reference Midmore1983; Midmore et al., Reference Midmore, Roca and Berrios1986a; Reference Midmore, Roca and Berrios1986b). In India, a study was conducted in 2002 and 2003 in an area (139 masl) where the mean monthly maximum temperature ranges from 29.4 °C (December) to 46.2 °C (May). Mulch and irrigation were the main factors affecting yields; it was found that application of rice straw mulch (6 t ha−1) increased tuber yield up to 24–42%, depending on the irrigation systems (Kar and Kumar, Reference Kar and Kumar2007). According to the same authors and confirming numerous other studies, this yield increase in mulched plots may be explained by a reduction of maximum soil temperatures (4–6 °C), conservation of soil moisture and increased availability of phosphorus, potassium and organic carbon in comparison to non-mulched plots. The effect of straw mulch in reducing soil temperature (Döring et al., Reference Döring, Brandt, Heß, Finckh and Saucke2005; Midmore, Reference Midmore1983; Reference Midmore1984; Ramakrishna et al., Reference Ramakrishna, Tam, Wani and Long2006) is due to interception of incoming solar energy by a poorly conducting surface (Döring et al., Reference Döring, Brandt, Heß, Finckh and Saucke2005; Midmore et al., Reference Midmore, Roca and Berrios1986b). In addition to yield increase, the use of straw mulch has been shown to be effective for crop sanitation such as virus incidence reduction (Döring et al., Reference Döring, Brandt, Heß, Finckh and Saucke2005; Midmore, Reference Midmore1983) and weed control (Ghosh et al., Reference Ghosh, Dayal, Bandyopadhyay and Mohanty2006; Midmore, Reference Midmore1983; Ramakrishna et al., Reference Ramakrishna, Tam, Wani and Long2006).
MATERIALS AND METHODS
Experimental sites
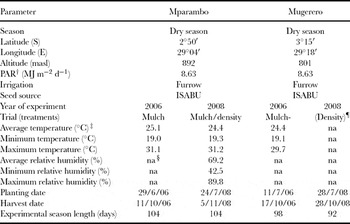
Four trials were carried out at Mparambo (892 masl) and Mugerero (801 masl), two research stations of ISABU (Institut des Sciences Agronomiques du Burundi). The planting dates were: 26 June 2006, 11 July 2006, 24 July 2008 and 28 July 2008. The sites are described in Table 1. They are typical of the hot lowlands of Burundi where potato has not been grown previously. These zones are called lowlands in this study but we are aware they are not strictly lowlands. At Mparambo, the mulch trial was conducted twice (2006 and 2008) whereas at Mugerero this trial was carried out only once (in 2006). The density trial took place in 2008 only and was also conducted at Mparambo and Mugerero. However, due to repeated flooding caused by irrigation water, no reliable data could be obtained at Mugerero, and the density trial at that site was not taken into account.
Description of experimental sites and experiments for the mulch and density trials conducted in 2006 and 2008.

†Photosynthetically active radiation. Figures were obtained by using FAO data for Bujumbura (FAO, 1984). PAR at Mparambo and Mugerero may be considered as similar to the radiation recorded at Bujumbura according to their respective geographic position.
‡Average temperature during the growth cycle of the experiments.
§na: not available.
¶No reliable data were obtained at Mugerero because of due to repeated flooding, so the density trial at that site was excluded from analysis.
Genotypes used
The genotypes used in our experiments were chosen for their adaptability to hot conditions, according to information obtained from CIP and from our preliminary trials. Another factor that determined our choice was the availability of seed potatoes. Initially, it was planned to include variety aspects in our trials as it has been reported that effects of treatment (differences in crop management) may vary with the genotype used (Midmore, Reference Midmore1984) but the seed stock was limited. Two genotypes from CIP were used for the mulch trials: variety Victoria (clone 381381.20) in 2006 and clone 388611.22 in 2008 due to lack of seed stock of Victoria. Victoria was also used for the density trial in 2008. Selected for the first time in Uganda, Victoria was brought to Burundi for release in 1998. It is normally grown in traditional potato cropping areas. Both clones belong to the same species Solanum tuberosum, but Victoria belongs to the tuberosum subspecies whereas clone 388611.22 comes from a breeding program at CIP which used the subspecies andigena as source of extreme resistance to potato virus Y (Bonierbale, CIP, personal communication).
Experimental design
Mulch trials. The mulch trials were carried out in a randomized complete block design (RCBD) with three replications in 2006 and four replications in 2008. Each plot comprised four rows of five hills in 2006 and five rows of ten plants each in 2008. Two treatments were compared in 2006: mulch and control (no mulch). Four treatments, instead of two, were tested in 2008: one application of mulch at planting time (MP), one application at emergence time (ME), two applications of mulch (at planting and emergence time, MPE) and control (no mulch). The mulch consisted of rice dry straw spread to form a uniform layer over the soil.The rate of application was 9 t ha−1. In both seasons, the trials were planted at a spacing of 80 cm between rows and 30 cm between hills (planting holes) within rows. Visual observations made in the field showed that the mulch was gradually decomposed during the growth cycle. However, around 50% of the soil surface was still covered by rice straw mulch in decomposition at final harvest for the treatments MP and ME against 70% for the MPE.
Density trial. Exclusively conducted at Mparambo in 2008, the density trial was carried out in a RCBD with four replications. Four distances between rows were compared: 80 cm (D80), 70 cm (D70), 60 cm (D60) and 50 cm (D50). These intervals correspond to different plant population, respectively: 4.17, 4.76, 5.56 and 6.67 plants m−2. In this case, it is known that the difference between treatments is not only plant density but also spatial arrangement at planting time (Tetio-Kagho and Gardner, Reference Tetio-Kagho and Gardner1988). The distance between two neighbouring plants, within the row, was 30 cm for all treatments. Each plot comprised 50 seed tubers distributed on five rows of ten hills (planting holes) each.
Crop management
The trials were planted and harvested at various dates as reported in Table 1. For each experiment, the trials were conducted as follows. Hoes were used for land preparation, planting and weeding. A deep planting system was adopted on a flat surface so that enough soil would be available for hilling. Two weeks before planting, lime was spread on the soil at a rate of 2 t ha−1 as recommended by ISABU (Harahagazwe, Reference Harahagazwe and Kaboneka2001). Organic cow manure (500 g) was placed in each planting hole. Mineral fertilizer was applied, adding 14.3 g of N-P-K fertilizer to each hole in all experiments. With a spacing of 80 cm × 30 cm, this was equivalent to the application of 85 kg ha−1 of urea, 340 kg ha−1 of di-ammonium phosphate and 170 kg ha−1 of KCl which represents 100:150:100 units of N, P2O5 and K2O respectively as used by ISABU (unpublished data).
During the growth cycle, weeds were controlled three times by hoe at both sites in order to control the high development rate of grasses in this hot environment. Furrow irrigation (approx. 30 minutes of watering) was performed at one-week intervals. There was no equipment for measurement of the water potential of soil to determine precisely the timing of irrigation and the quantity of water to apply. Thus the plants could have been exposed sporadically to some water stress (drought or flooding). It should be noted, however, that the rains of the long rain season started at all sites when the crop was at the beginning of maturity.
Chemicals were used to control pests and diseases. At plant emergence, the fields were sprayed with Ridomil Gold MZ 68WP. This is a systemic fungicide with active ingredients mancozeb 64% and metalaxyl-M 4% making the product systemic and protective against late blight caused by Phytophthora infestans. Three follow-up applications were made at two-week intervals with Dithane M-45, a contact fungicide containing mancozeb as active ingredient up to 80% (Dow AgroSciences). Together with the fungicides, dimethoate, an organophosphate insecticide which controls aphids, the main vectors of virus and virus-like diseases, was also applied. Prior to harvesting, the plants were not dehaulmed in order to allow the crop to complete its whole growth cycle (natural senescence).
Data collection
Temperature was regularly recorded under shelter at one-hour intervals by HOBO data loggers for the two years. They recorded, at the same time, the relative humidity during the 2008 trials. It was not possible to record at the same time soil temperature for better understanding of effects of mulching on crop characteristics. Experimental data collected from the emergence to the harvest time are described below.
Total emergence. All the emerged plants for all experiments were counted, plot by plot, every two weeks. This counting ended six weeks after planting when all the plants were estimated to have emerged. The total emergence was defined as the percentage of emerged plants out of the number planted.
Ground cover. The percentage of the ground covered with green foliage was recorded in 2008 with the aid of a wooden grid divided into 100 rectangular cells by a nylon rope as outlined by Kooman et al. (Reference Kooman, Fahem, Tegera and Haverkort1996a). For each plot, three readings at different locations were done at 64 days after planting (DAP). Those three readings were used to calculate the average ground cover for each plot. This parameter was recorded in 2008 only.
Leaf characteristics. Leaf area was determined in three blocks and for each block one plant was harvested. This occurred at 69 DAP when the crop had finished its leaf growth. To calculate the leaf area per plant, necessary for further calculation of LAI in our density trial conducted at Mparambo in 2008, the relation between leaf area (S) and the product of leaf length (L) and maximum leaf width (W) was computed by sub-sampling 46 (compound) leaves of one plant harvested in one plot, and counted and weighed separately (Fleisher and Timlin, Reference Fleisher and Timlin2006; Vos and van der Putten, Reference Vos and van der Putten1998; Vos et al., Reference Vos, Uhan and Sutarya1995).
Harvest parameters. In trials conducted in 2006, tubers at harvest were graded into those larger and smaller than 40-mm diameter, and weighed and counted. Three sub-samples of 200 g each of tubers and stems plus leaves were oven dried at 105 °C for 72 h. Harvest index (HI) for each treatment was calculated by dividing dry tuber weight by the total dry matter comprising stems, leaves and tubers as well but not roots (Condori et al., Reference Condori, Mamani, Botello, Patiño, Devaux and Ledent2008). For trials conducted in 2008, the same methodology was applied at harvest time except that here the harvested tubers were divided into four different categories of tuber size determined by diameter: <40 mm, 40–60 mm, 60–80 mm and >80 mm.
Data analysis
GenStat Release 7.2 DE was used for descriptive statistics and analysis of variance (VSN-International, 2007). Comparison contrasts were also made in the analysis of the mulch trial conducted in 2008:
i Are treatments with application immediately after planting better than no application or application after emergence or application both at planting and after emergence?
ii Was it useful to mulch the crop?
iii When applied, should the mulch be applied once or twice during growing season?
iv What was the best time to apply the mulch: at planting or at emergence?
A simple linear regression analysis (Gomez and Gomez, Reference Gomez and Gomez1984) on parameters measured in the density trial conducted at Mparambo was tested to relate ground cover, LAI, biomass and HI variables to the distance between rows and plant population density. This analysis was done using SigmaPlot software (Systat Software, 2004).
RESULTS AND DISCUSSION
Weather data
In 2006, the mean air temperature recorded by data loggers ranged from 24.4 °C (Mugerero 2006 and Mparambo 2008) to 25.1 °C (Mparambo 2006). The maximum air temperature ranged from 29.7 °C (Mugerero 2006) to 31.1 °C (Mparambo 2008) during the same period. During the trials conducted at Mparambo in 2008, the data logger recorded the following absolute air temperatures: 35.3 °C for the maximum and 16.4 °C for the minimum.
All trials, both sites and seasons, were conducted under hot conditions according to the definition given by Midmore (Reference Midmore and Harris1992). Indeed, the daily mean minimum air temperature was always greater than 18 °C and maximum air temperature greater than 28 °C during the growth cycles (Table 1). According to the literature, potato is known to be suitable for an environment whose average temperature ranges from 14 to 22 °C (Kooman et al., Reference Kooman, Fahem, Tegera and Haverkort1996b). Potato is not normally grown for commercial purpose in an environment for which monthly mean air temperature is out of the 5–25°C range (Haverkort and Kooman, Reference Haverkort and Kooman1997) and furthermore, potato is not expected to grow below 2 °C (Burt, Reference Burt1964). This may be the major reason why potato is grown throughout the country except in the lowlands of the Imbo region due to high temperatures in the latter (unpublished data). When temperature is above 25 °C, the photosynthesis process is limited by the stomatal and mesophyll resistances (Ku et al., Reference Ku, Edwards and Tanner1977).
In trials conducted in 2006 at Mparambo and Mugerero, the long rains season started a few days before harvest. In 2008, rain started 51 days after planting of the trials conducted at Mparambo. Plants received water from rain and irrigation at the end of the growth cycles.
Growth parameters
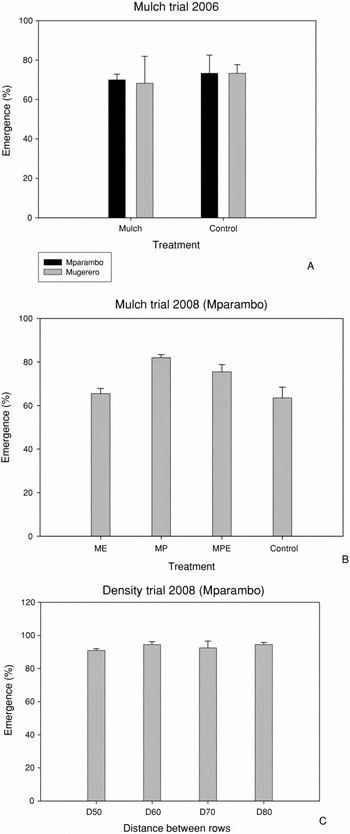
Plant emergence was not affected by plant density (Figure 1). Mulching affected significantly the total emergence only in 2008 but the average emergence values for the mulch trials conducted at Mparambo and Mugerero in 2006 were very similar (71.7% and 70.8% respectively). In the 2008 mulch trial, the emergence rate of plots mulched immediately after planting was significantly higher than the mean emergence rate of the control and the plots mulched at full emergence. Emergence rate was 78.8% when mulch was applied at planting time against 64.5% in the controls (no mulch). The following contrasts were also found to be significant (p < 0.01): control (63.5%) versus mean of treatments with mulch (74.3%), and mulch at planting time (82.0%) versus mulch at emergence time (65.5%). On the other hand, emergence rate of twice-mulched treatment (75.5%) did not differ significantly (p = 0.05) from the average emergence rate of plots mulched only once (at planting and after emergence, 73.8%). The average emergence rate of all trials varied from 70.8% (2006 mulch trial at Mugerero) to 93.1% (2008 plant density trial) as shown in Figure 1.
Emergence (%) of mulch trials carried out at Mparambo and Mugerero in 2006 (A) and 2008 (B), and a plant density trial conducted at Mparambo in 2008 (C). Vertical bars indicate standard errors of treatment means. The treatments are: ME (mulch at emergence), MP (mulch at planting time), MPE (mulch at planting and emergence time), control (no mulch), D50, D60, D70 and D80 correspond to distance between rows (50, 60, 70 and 80 cm, respectively).

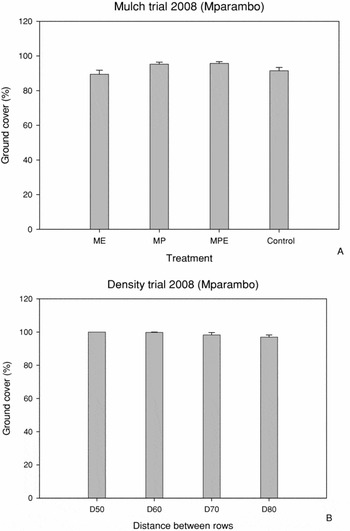
Analysis of data on ground cover did not reveal significant differences between treatments in the mulch and plant density trials carried out in 2008 at Mparambo except when plots mulched at planting time were compared to the others (p < 0.05). The average ground cover obtained from those experiments is shown in Figure 2A and B. Organic mulch and denser plant population are usually reported to enhance foliage development and canopy cover of the soil (He et al., Reference He, Struik, He and Zhang1998; Midmore, Reference Midmore1984; Midmore et al., Reference Midmore, Roca and Berrios1986a).
Ground cover of the mulch (A) and plant density (B) trials, and LAI (C) for the plant density trial conducted at Mparambo in 2008. Vertical bars indicate standard errors of treatment means. See abbreviations in Figure 1.

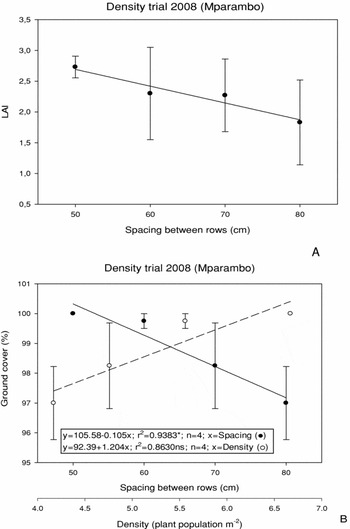
The ANOVA for LAI obtained from the density trial at Mparambo 2008 did not show significant differences of LAI between the four spacing intervals (p = 0.05). However, a negative linear regression (r 2 = 0.919, p < 0.05; n = 4) was obtained between the two variables (Figure 3A). The lack of significance on the ANOVA may be explained by the high coefficient of residual variation obtained (48.9%). As with LAI, ground cover appeared to be negatively related to the distance between rows. However, unlike for LAI, this relationship did not reach significance when plant population was used as an independent variable (Figure 3B). Nevertheless, the values of r 2 obtained in these two cases (relation of LAI with row distance or plant population) were close to each other. The fact that plant density is proportional to the inverse of row distance might explain this discrepancy (the relation is not linear). Moreover, ground cover and not LAI is influenced by overlapping between leaves. Also, at high densities the relation between LAI and density is no longer linear (individual plants decrease in size).
The estimated linear relationships between LAI (A) or ground cover (B), and the distance between rows (●) or plant population density (○) from a trial conducted at Mparambo in 2008. Vertical bars are standard errors of treatment means.

Nevertheless, the analysis of data in Figure 3A and B indicates that both LAI and ground cover may be related to the spacing between rows and therefore they should be related to each other as reported in other studies (Condori et al., Reference Condori, Mamani, Botello, Patiño, Devaux and Ledent2008; Jefferies and Mackerron, Reference Jefferies and MacKerron1989). It is also important to note that these agronomic trials conducted in the lowlands did not suffer from diseases and pests due to regular chemical applications. There were very few scattered holes in leaves caused by unidentified pests and, therefore, leaves were apparently healthy when parameters such as ground cover and LAI were measured.
Yield and components
In each trial, the different treatment factors (mulch and plant density) did not significantly affect tuber number per plant or per tuber size category. The average tuber number per plant varied from five to eight tubers per plant. This is in agreement with earlier findings of seven tubers per plant in the same region using eight genotypes for three years (unpublished data). The only significant effect was for the proportion of tubers in the 60–80 mm category, which varied with the spacing interval (p < 0.05) in the plant density trial.
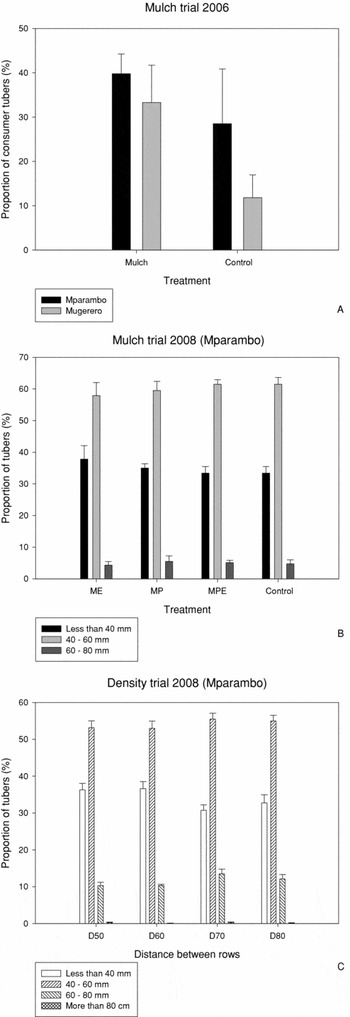
The proportions of tubers harvested in the different categories defined by tuber size are presented in Figure 4 (A to C). Unlike the plant density trial at Mparambo in 2008 (Figure 4C), no tuber reached a diameter of 80 mm in the mulch trial conducted in the same year and same location (Figure 4B). This may be due to the difference in genotypes used (Victoria for the density trial and 388611.22 for the mulch trial) in the two trials.
Proportion of tubers in mulch trials carried out at Mparambo and Mugerero in 2006 (A) and 2008 (B), and in a plant density trial conducted at Mparambo in 2008 (C). Vertical bars indicate standard errors of treatment means. See abbreviations in Figure 1. Consumer tubers are defined here as tubers with a diameter exceeding 40 mm.

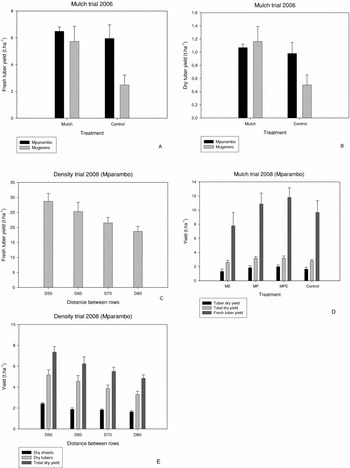
Fresh or dry tuber yields for each trial did not differ significantly between treatments for the two factors (density and mulch) probably due to high coefficients of variation ranging from 20.6% (density trial, Mparambo 2008) to 34.8% (mulch trial, Mparambo 2008). Nevertheless, fresh (Figure 5A) or dry (Figure 5B) tuber yield tended to increase when mulch was used or when the spacing interval between rows was decreased (Figure 5C and E). The average fresh tuber yield in the mulch trials ranged from 4.1 (±0.9) t ha−1 for Victoria cultivar (Mugerero 2006) to 10 (±1.6) t ha−1 for clone 388611.22 (Mparambo 2008). The average fresh tuber yield in the plant density trials was 23.5 (±2.3) t ha−1, equivalent to 4.2 (±0.4) t ha−1 of dry matter. For this trial, a yield of 33.8 t ha−1 of fresh tubers (or 6.1 t ha−1 of dry matter) was recorded in one of the plots (D50, block 2). To our knowledge, these yields have never been reached before in potato experiments conducted previously in the lowlands of Burundi.
Fresh and dry yields obtained from trials conducted in 2006 and 2008 at Mparambo and Mugerero: 2006 (A and B) and 2008 (D) mulch trials, and plant density trial (C and E). Vertical bars indicate standard errors of treatment means. See abbreviations in Figure 1.

The mean dry matter concentration per trial varied from one season or location to the other. In 2006 (mulch trial), the mean tuber dry matter concentration was 16.5% at Mparambo against 20.3% at Mugerero using Victoria in both sites. In the trials conducted at Mparambo in 2008, the tubers of clone 388611.22 from the mulch trial contained 17% of dry matter at harvest time, whereas the dry matter concentration of Victoria for the plant density trial was 18%. These variations of the overall means per trial may be attributed to the confounding effects of genotypes, years (water stress, weeds) and locations (soil) that prevailed during the respective trials. It is already known that water stress can raise dry matter concentration by up to 2% (of increase) in field trials (Lahlou et al., Reference Lahlou, Ouattar and Ledent2003). Normally, consumer potato tubers contain at least 18% dry matter (Woolfe, Reference Woolfe1987).
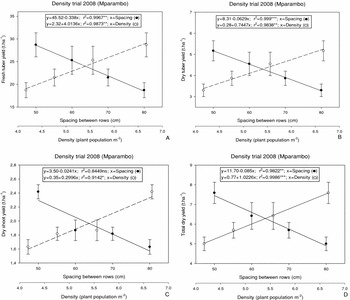
Regression analysis of data obtained from the density trial conducted at Mparambo in 2008 showed very highly significant linear regressions between yields and the spacing between rows. This applies to fresh and dry tuber yield (Figure 6A and B) and total dry biomass yield (Figure 6D) but not to dry shoot yield (regression non significant (Figure 6C). The slope of all those linear regressions was negative. However, when the row spacing was replaced by the corresponding plant population density, these regressions became positive and remained significant as for LAI. Moreover, the regression involving dry shoot yield became significant (Figure 6).
The estimated linear regression between biomass yield and the spacing between rows (●) or plant population (○) from the density trial conducted at Mparambo in 2008: fresh tuber yield (A), dry tuber yield (B), dry shoot yield (C) and total dry biomass yield (D). Vertical bars are standard errors of treatment means.

Data collected at harvest time at Mparambo in 2008 allowed us to calculate the HIs for tested treatments by trial type (mulch and plant density). Analysis of variance did not show significant differences of HI between treatments, each trial being analysed separately. On average, an HI of 0.56 (±0.044) was obtained for the mulch trial against 0.68 (±0.018) for the plant density one. Again the difference between trials is difficult to interpret due to confounding effects of differences in genotypes (388611.22 in the mulch trial and Victoria in the density trial) and crop management (use of mulch versus plant density).
Effects of mulching and plant population density on crop emergence
For all trials, emergence was good especially for the plant density trial conducted at Mparambo in 2008. As expected according to previous reports (Midmore, Reference Midmore1988), the distance between rows or plant population density did not influence significantly the emergence rate of the plants. However, the mulch trial conducted in 2008, more comprehensive than the trials conducted in 2006, showed a significant effect of mulch on the emergence rate. Mulching was found to be useful for potato emergence and the emergence rate was best when rice straw mulch was used immediately after planting. The positive effect of straw mulch on potato emergence has been reported to be caused by an improvement of water conservation and decreases of soil temperature (Awan, Reference Awan1964; Kar and Kumar, Reference Kar and Kumar2007; Midmore, Reference Midmore1984; Reference Midmore1988; Midmore et al., Reference Midmore, Roca and Berrios1986a; Reference Midmore, Roca and Berrios1986b; Ramakrishna et al., Reference Ramakrishna, Tam, Wani and Long2006). This is in agreement with our results, especially when contrasts were used in analysing variance of emergence rate variable. Mulching at planting time increased significantly the emergence: the average emergence rate was 65% without mulch but reached 80.4% in mulched plots. This means that mulch could be of great use when tubers may face constraints to emerge such as occasional drought.
The lesser significance of results from trials conducted in 2006 may be due to the use of fewer treatments for mulch trials (mulch and control), meaning fewer degrees of freedom in the ANOVA. The other probable reason is the presence of external factors such as flooding, water shortage and differences in soil. Consequently, it is believed that results obtained in 2008 were more reliable than those of 2006 even if confirmatory work is required. This remark applies for all studied parameters, including tuber yield.
In practice, the time to emergence related to the planting depth, the initial sprout length, the soil temperature and the sprout growth rate (Kooman and Haverkort, Reference Kooman, Haverkort, Haverkort and MacKerron1995). The latter is reported to depend on the mean soil temperature and to decrease when the soil temperature falls below or exceeds an optimum of 22 °C (Sale, Reference Sale1979) or 25°C (Midmore, Reference Midmore1984). Due to incident radiation to the soil surface, soil temperature is higher than air temperature during the day but mulching reduces it (Midmore et al., Reference Midmore, Roca and Berrios1986b). Experiments conducted in Peru and India showed that the application of organic mulch decreases the mean daytime soil temperature by 4–7°C (Midmore et al., Reference Midmore, Roca and Berrios1986b; Kar and Kumar, Reference Kar and Kumar2007).
Effects of straw mulch and plant population density on yield and components
Our two-year study conducted at two hot locations did not show any statistically significant effect of use of 9 t ha−1 of rice straw mulch on tuber yield components (tuber number per plant, proportion of marketable tubers, total dry biomass yield excluding roots and HI) and subsequently tuber yield itself (fresh and dry matter weight). In a similar study conducted in India, the use of 6 t ha−1 of rice straw mulch significantly increased tuber yield (Kar and Kumar, Reference Kar and Kumar2007). The difference between the studies may be due to the genotypes used. Other reports indicate that the use of straw mulch up to 5 t ha−1 does not produce significant results even though it has been reported that with a rate of rice straw mulch of 3.4 t ha−1 evaporation is controlled (Döring et al., Reference Döring, Brandt, Heß, Finckh and Saucke2005). The absence of this effect in our experiments may be partially due to the use of heat tolerant genotypes. The material used in this study (Victoria and clone 388611.22) are among the genotypes already selected for lowlands adaptation (unpublished data). This result is similar to that found in Peru where heat tolerant clones responded less sensitively to mulch application (Midmore, Reference Midmore1983; Reference Midmore1984).
With respect to plant population, its effect on potato yield was only statistically significant when considering dry shoot yield and total dry biomass productivity (excluding roots). At four different plant densities (4.17, 4.76, 5.56 and 6.67 plants m−2) resulting from variation in row spacing, tuber yield did not vary significantly. However, an apparently very strong linear relationship was found between mean tuber yield per density and plant population density (Figure 6A and B), especially for dry yield. This relation is due, at least in part, to the averaging of results per row spacing (across blocks), which eliminates the variability between blocks within each spacing treatment as recommended by biometricians (Gomez and Gomez, Reference Gomez and Gomez1984). Also only four observation points corresponding to four treatments are available to fit the regression. The relationship obtained means that by increasing plant population density from 4.17 to 6.67 plants m−2 through reduction of row spacing, potato tuber yield (t ha−1) is expected to increase linearly (y = 0.77 + 1.0226x). In studies conducted in China and Peru, tuber yield increase due to increased plant density ranged from 5 to 53% depending on the type of variety and age of seed used (He et al., Reference He, Struik, He and Zhang1998; Midmore, Reference Midmore1988). It is known that the relationship of tuber yield with plant population density remains linear only at relatively low densities, but later on the yield increases to a maximum and then either remains at a plateau with further increase in density or eventually begins to decline (Allen and Wurr, Reference Allen, Wurr and Harris1992).
Practically, the result could be translated as follows: for any 10-cm decrease of the interval between rows in lowlands of Burundi (within the 50–80 cm spacing range and keeping the distance between plants within rows constant), fresh tuber yield is expected to increase by an average of 3.4 t ha−1 (Figure 6A) or 0.9 t ha−1 for tuber dry matter (Figure 6B). For fresh tuber yield (t ha−1), the slope parameter of regression over plant population density variation (y = 2.32 + 4.0136x; r 2 = 0.9873, p < 0.01) was similar to the one obtained in an experiment conducted at Lima (y = 11.86 + 4.363x; r 2 = 0.859, p < 0.001) where five distances between rows (40, 50, 60, 70, 80 cm) and three distances between plants within rows (20, 30, 40 cm) were tested (Midmore, Reference Midmore1988). The same author did not find significant interactions between the within- and between-row spacings in his experiment. Therefore, it is not unlikely that our regression for tuber yield could be extrapolated to the plant population density range studied in the experiment conducted at Lima, a hot tropical site (12° 05′S, 240 masl).
Potatoes and other Andean tubers are known to be highly productive species due to their HI (Condori et al., Reference Condori, Mamani, Botello, Patiño, Devaux and Ledent2008; Kooman, Reference Kooman1995), even higher than other species of worldwide high importance of food including grains and oil-seed crops (Kooman, Reference Kooman1995). However, this HI has been reported to decrease by 36.5% in comparisons between highlands and lowlands in Burundi (unpublished data) and/or when water stress occurs during the growth cycle (Deblonde et al., Reference Deblonde, Haverkort and Ledent1999; Kar and Kumar, Reference Kar and Kumar2007; Lahlou et al., Reference Lahlou, Ouattar and Ledent2003). Those two factors could explain why relatively low values of HI were obtained in comparison to those found in potato under optimal conditions.
CONCLUSION
In these experiments, interest was focused on the use of rice straw mulch and variation in distances between rows, the distance between plants within rows being kept constant. There was no evidence of a significant increase of tuber yield and its components with the use of rice straw mulch, perhaps because the genotypes used were adapted to the hot environment. The major finding is that there is no need to mulch heat tolerant genotypes such as Victoria and 388611.22 in lowlands of Burundi except possibly when drought may be a major constraint or when the seed used has a low potential to give shoots emergence. In these particular situations, mulch should be used immediately after planting until full crop cover. After that it can be disposed of for different purposes: used for feeding animals or removal to facilitate cultural practices (weeding and hilling, irrigation). For plant population density, it was found that tuber yield could be increased proportionally by decreasing the planting interval of 80 cm between rows, normally applied in high altitude of Burundi, to 50 cm without changing the within-row interval of 30 cm. However, these findings need further confirmation.
Acknowledgements
This study was funded by the Belgian Technical Cooperation (BTC), the World Bank funded Project (PRASAB) and the National Agricultural Research Institute (ISABU). Genotypes used come from International Potato Center (CIP). The authors thank D. Nyawakira, M. Ndakoze and G. Barankiga, participating technicians, for field and laboratory work.