





Introduction
Glyphosate (categorized as a Group 9 herbicide by the Weed Science Society of America) has played a central role in shaping modern corn and soybean production systems in Illinois. Its effectiveness as a broad-spectrum herbicide has facilitated the widespread adoption of conservation tillage practices, reduced soil erosion, and lowered fuel and labor requirements, which has contributed to both agronomic efficiency and environmental stewardship (Duke Reference Duke2020). These attributes have supported the emergence of Illinois as a global leader in large-scale, high-yield row-crop production. At the same time, the agronomic and economic success of glyphosate-based systems has fostered a high degree of dependence, rendering Illinois agriculture potentially vulnerable to regulatory or market-driven disruptions.
Recent developments have heightened this vulnerability. Increasing regulatory scrutiny, high-profile litigation, evolving consumer preferences, and the continued spread of herbicide-resistant weed populations have raised the prospect of restrictions or bans on glyphosate use in the United States (Duke Reference Duke2018). While glyphosate’s environmental fate and agronomic performance have been widely studied (Duke Reference Duke2020), fewer studies have provided an integrated economic assessment of its removal, particularly in highly specialized production systems. On the cost side, Singh and Jhala (Reference Singh and Jhala2025) recently estimated that glyphosate alone accounted for approximately US$1.1 billion in U.S. corn and soybean herbicide expenditures, by far the largest item in the herbicide bill, making it the single most exposed input to a regulatory shock. Yet this national accounting does not, on its own, indicate what such a shock would mean for farm revenues once yield channels and substitution behavior are considered.
Two strands of work have addressed the economics of restricting glyphosate. Bioeconomic optimization models, such as those developed by Böcker et al. (Reference Böcker, Britz and Finger2018) for European silage maize, simulate cost-minimizing responses to a ban and find modest changes in production costs and yield once farmers adapt. Closer to North American row-crop conditions, Soltani et al. (Reference Soltani, Shropshire and Sikkema2022) combined Ontario field-trial yield losses with expert-elicited herbicide programs and demonstrated that producer adaptation cuts residual yield losses by roughly 95% but raises per-hectare weed management spending, for an annual provincial loss of about Can$43 million (US$33 million). Both lines converge on the same pattern: adaptation absorbs most of the yield shock and transfers it to the cost side. What is missing is a transparent, scalable assessment for major U.S. production regions that uses observed market costs and Extension-based substitution pathways, which is the gap this paper addresses for Illinois.
Illinois provides a particularly salient context for examining these issues. The state devotes approximately 8.6 million ha to corn and soybean production, generating annual crop values exceeding US$17 billion (USDA-NASS 2025). Much of this production relies on the efficiency gains associated with glyphosate-tolerant systems (USDA-ERS 2025). As a result, changes in weed management practices are unlikely to remain confined to agronomic decision-making alone. Yield reductions and higher production costs associated with alternative herbicide programs or nonchemical control strategies would have direct implications for farm revenues and production margins across Illinois agriculture.
The analysis proceeds in four stages, moving from baseline glyphosate use and expenditures, to yield impacts under a complete ban, to producer substitution behavior, and finally to scenarios that might incorporate input price increases and modest yield reductions.
A distinguishing feature of this study is its reliance on Extension-informed evidence and input from Illinois Soybean Association Extension staff and industry agronomists (from the companies Growmark and Bayer) in order to validate our herbicide program assumptions and review our cost estimates as reflected in the acknowledgments. Illinois agriculture is characterized by close interaction among producers, input suppliers, Extension specialists, and commodity organizations. Evaluating agrochemical transitions therefore requires careful attention to practical feasibility, cost structures, and management complexity faced by producers (Bourns et al. Reference Bourns, Slaton, Osmond, Spargo, Gatiboni, Lacey and Sawyer2025). Extension weed science research at the University of Illinois provides a critical empirical foundation for assessing the performance, limitations, and cost implications of glyphosate substitutes (Hager Reference Hager2021; Landau et al. Reference Landau, Bradley, Burns, DeWerff, Dobbels, Essman, Flessner, Gage, Hager, Jhala, Johnson, Johnson, Lancaster, Lingenfelter and Loux2025).
Rather than advocating for or against glyphosate, the objective of this paper is to provide a transparent, evidence-based assessment of the agronomic and farm-revenue consequences of its potential removal. By linking yield effects and production-cost changes, the analysis contributes to ongoing policy discussions and offers a replicable framework for evaluating major agrochemical transitions in highly interconnected agricultural regions.
Materials and Methods
Analytical Framework
This study evaluates the farm-level revenue implications of a hypothetical ban on using glyphosate in Illinois for corn and soybean production using a staged analytical framework. The analysis proceeds in four steps. First, baseline glyphosate use and expenditures are estimated for Illinois corn and soybean production using hectare, application frequency, and price data. Second, yield elasticities with respect to glyphosate use are derived from the agronomic and economic literature to estimate yield impacts under a complete ban, assuming no substitution. Third, substitution toward alternative weed management programs is evaluated to quantify changes in production costs under maintained yields. Fourth, additional scenarios are presented that incorporate input price increases and modest yield reductions associated with substitute weed control programs.
Data Sources
Crop hectare, yield, and price data for corn and soybean in Illinois for crop year 2023 were obtained from the U.S. Department of Agriculture–National Agricultural Statistics Service (USDA-NASS 2026) QuickStats database. Glyphosate application frequency and usage estimates were derived using USDA hectare data combined with expert-informed application frequencies and standard application frequencies. Farm-gate glyphosate price benchmarks were compiled from industry reports, farm chemical pricing platforms, and published literature.
Information on substitute weed management programs, costs, and agronomic performance was obtained from University of Illinois, Purdue University, and Ohio State University Extension publications (Hager Reference Hager2021; Loux et al. Reference Loux, Essman, Doohan, Dobbels, Johnson, Young, Zimmer, Hager and Bradley2025), Iowa State University custom rate surveys (Johanns and Hart Reference Johanns and Hart2026), and Iowa State University Extension weed control guidance (Jha and Yadav Reference Jha and Yadav2022). Yield elasticities were derived from peer-reviewed studies, including meta-analyses and farm-level empirical research (Brookes Reference Brookes2018; Desmarwansyah and Purba Reference Desmarwansyah and Purba2008; Qaim and Traxler Reference Qaim and Traxler2005).
Estimation of Glyphosate Use and Expenditures
Baseline glyphosate use was estimated by combining planted area with application frequency and application rate assumptions. Application frequencies on glyphosate-treated land were assumed to be 1.1, 1.2, and 0.2 applications per hectare per growing season for corn, soybean, and fallow or other agricultural land, respectively, based on application intensity data from internal surveys carried by Bayer CropScience (St. Louis, MO) (Table 1). A standard application rate of 1.26 kg of glyphosate acid equivalent per hectare per application was used to convert application frequency into total kilograms of acid equivalent. Total glyphosate expenditures were then calculated by multiplying estimated quantities by farm-gate price ranges derived from multiple market sources (Table 2).

Table 1. Long description
A table comparing glyphosate use across different sectors in Illinois for 2023. The table has five columns and four rows, including a total row. The columns are labeled Sector, Planted area, Share using glyphosate, Applications, Rate, and Estimated use. The row labels are Corn, Soybean, Fallow/other, and Total. The Planted area is measured in hectares, the Share using glyphosate in percent, the Applications in number per year, the Rate in acid equivalent per hectare per application, and the Estimated use in kilograms of acid equivalent. Row 1: Corn, 4,532,000, 88 percent, 1.1, 1.261, 5,532,000. Row 2: Soybean, 4,189,000, 93 percent, 1.2, 1.261, 5,894,000. Row 3: Fallow/other, 528,000, 93 percent, 0.2, 1.261, 124,000. Row 4: Total, 9,249,000, not applicable, not applicable, not applicable, 11,550,000.
a Abbreviations: ae, acid equivalent; ha, hectare.
b Glyphosate use for fallow and other land is not reported by the U.S. Department of Agriculture–National Agricultural Statistics Service and was estimated using standard application assumptions.
c Area converted from data reported in acres (1 ac = 0.4047 ha).
d Estimated use = planted area × share using glyphosate × application frequency × application rate.
e Source: USDA-NASS (2025, 2026) and authors’ calculations.

Table 2. Long description
A table comparing glyphosate retail prices from different sources. The table has 5 rows and 3 columns. The columns are labeled Source, Price, and Notes. The rows are as follows: Row 1: Source, Farm Business Network (Farm Business Network (2025); Price, US$ 7.5–14.6 per kg ae; Notes, Invoice-based prices for glyphosate formulations (e.g., Roundup PowerMAX 3). Row 2: Source, Commercial price listings; Price, US$ 8.2–9.0 per kg ae; Notes, Derived from posted retail prices for 480 g ae/L formulations. Row 3: Source, Industry estimates; Price, US$ 9.6 per kg ae; Notes, Reflects multiyear observed variability and episodic price spikes. Row 4: Source, Average range; Price, US$ 8.4–16.1 per kg ae; Notes, empty. Row 5: Source, Simple range across reported values; Price, empty; Notes empty.
a Abbreviation: ae, acid equivalent.
b Prices are reported in US$ per kg of ae. Original sources reported prices in US$ per pound ae (1 lb = 0.4536 kg); values converted accordingly. Liquid formulations commonly sold as 4-pound ae per gallon correspond to 480 g ae per liter.
c Roundup PowerMAX 3 is manufactured by Bayer CropScience (St. Louis, MO).
d Commercial price listings include publicly available retail price data (e.g., Agricultural Chemical Solutions 2024), used for indicative benchmarking only.
e Industry estimates reflect practitioner-reported price ranges across multiple years and are used to capture interannual variability not fully reflected in annual reports.
Yield Elasticity and Revenue Loss Estimation
Yield elasticities with respect to glyphosate use were derived from the agronomic and economic literature. A midpoint elasticity of 9% was adopted for corn and soybean based on meta-analysis and empirical studies (Brookes Reference Brookes2018; Desmarwansyah and Purba Reference Desmarwansyah and Purba2008; Qaim and Traxler Reference Qaim and Traxler2005). Yield losses were calculated by applying elasticity estimates to observed yields and hectares. Revenue losses were computed by multiplying yield reductions by crop prices and harvested hectares. This reduced-form elasticity approach is consistent with the broader damage-control framework used in agricultural production economics, where weed management inputs affect yields through their control of biotic stress (Fox and Weersink Reference Fox and Weersink1995; Lichtenberg and Zilberman Reference Lichtenberg and Zilberman1986; Zhengfei et al. Reference Zhengfei, Oude Lansink, Wossink and Huirne2005).
Substitution Analysis
Substitute weed management programs were identified based on Extension guidance and industry practices (Hager Reference Hager2021; Loux et al. Reference Loux, Essman, Doohan, Dobbels, Johnson, Young, Zimmer, Hager and Bradley2025). These included use of glufosinate (WSSA Group 10) ; 2,4-D choline and dicamba (both in Group 4); and inhibitors of acetyl-CoA carboxylase (ACCase), such as clethodim (Group 1), and mechanical control strategies. Per-hectare costs were derived from Extension publications and market reports (Johanns and Hart Reference Johanns and Hart2026; Loux et al. Reference Loux, Essman, Doohan, Dobbels, Johnson, Young, Zimmer, Hager and Bradley2025). Net production cost changes were calculated by subtracting baseline glyphosate program costs from substitute program costs and aggregating across Illinois hectares.
Scenario Analysis
Two additional scenarios were evaluated to capture market and agronomic adjustments. First, substitute herbicide prices were assumed to increase by 15% and 30% to reflect higher demand pressure on alternative herbicides following a ban, consistent with the scale of glyphosate’s current market dominance (Singh and Jhala Reference Singh and Jhala2025). Second, a uniform 2% yield reduction was assumed to reflect modest performance differences between glyphosate-based and substitute weed management systems, consistent with the lower bound of yield penalty ranges reported in Midwestern Extension trials (Hager Reference Hager2021; Jha and Yadav Reference Jha and Yadav2022). These scenarios were combined to estimate statewide farm-level revenue impacts.
Software
All calculations and data processing were conducted using Microsoft Excel.
Use of Generative AI
During the preparation of this work, the authors used ChatGPT to assist in identifying relevant literature, structuring and verifying the associated cost calculations, and formatting tables in accordance with journal guidelines. The tool was also used to improve clarity and readability. All outputs were carefully reviewed, validated against primary sources, and edited by the authors, who take full responsibility for the content of the publication.
Results and Discussion
Glyphosate Use and Expenditures in Illinois Corn and Soybean Production
This subsection establishes baseline glyphosate use and associated farmer expenditures for corn and soybean production in Illinois. Because farm-level sales data by state are not publicly available and cannot be independently verified, glyphosate sales are inferred from application-based estimates derived from federal datasets and benchmark price information. This approach is standard in the literature when direct transaction data are unavailable and allows for transparent replication (Singh and Jhala Reference Singh and Jhala2025; Soltani et al. Reference Soltani, Shropshire and Sikkema2022).
Annual glyphosate use reported in Table 1 is estimated using expert guidance based on Bayers CropScience internal survey information on glyphosate use practices. These surveys indicate average application intensities of approximately 1.1, 1.2, and 0.2 applications per hectare per growing season on glyphosate-treated land for corn, soybean, and fallow or other agricultural land, respectively. To translate these application frequencies into quantities of glyphosate acid equivalent, Extension crop advisors from the University of Illinois Urbana-Champaign recommend combining USDA-reported planted area for each land category with a standard application volume of 2.19 L ha⁻1 per application and a formulation concentration of 575 g ae L⁻1, corresponding to 1.26 kg ae ha⁻1 per application. This approach yields application-rate–based estimates of glyphosate use that complement survey-based USDA figures and reflect observed agronomic practice in Illinois.
To translate physical use into monetary expenditures, glyphosate application quantities are combined with price benchmarks drawn from market reports and the applied literature. Table 2 summarizes farm-gate retail prices for glyphosate acid equivalent reported in multiple sources. Across these references, farm-gate prices generally range from US$8.64 to $16.1 per kg of acid equivalent, reflecting variation across regions, purchasing arrangements, and formulation types. These prices incorporate transportation costs, formulation, distribution, and retailer margins.
For comparison, factory-gate prices for technical-grade glyphosate are substantially lower, typically ranging from US$3.3 to $4.4 per kg of acid equivalent. Illinois does not host glyphosate acid equivalent manufacturing facilities; instead, in-state operations are limited to formulation and packaging plants. Bayer CropScience’s primary U.S. glyphosate synthesis facility is located in Luling, Louisiana, and industry sources indicate that around 50% of the technical glyphosate used in the United States is imported, predominantly from China. In the absence of Illinois-specific manufacturing data, international factory-gate prices therefore provide a reasonable lower-bound benchmark, with additional costs required to approximate farm-gate prices observed by producers.
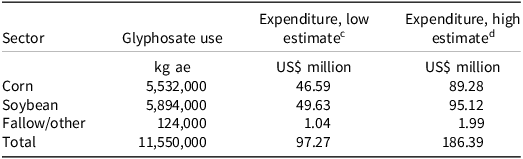
Combining the application quantities reported in Table 1 with the farm-gate price range reported in Table 2 yields estimates of total glyphosate expenditures by Illinois farmers. Table 3 reports these expenditures under the average of the low and high price assumptions reported at the bottom of Table 2. Total annual spending on glyphosate for corn and soybean production in Illinois in 2023 is estimated to range between approximately US$97.2 million and $186.3 million, with soybean accounting for a larger share of total expenditures due to higher total application volumes.

Table 3. Long description
A table comparing glyphosate use and expenditure across different sectors in Illinois for 2023. The table has four rows and three columns. The columns are labeled ‘Sector’, ‘Glyphosate use kg ae’, ‘Expenditure, low estimate US$ million’, and ‘Expenditure, high estimate US$ million’. The rows are labeled ‘Corn’, ‘Soybean’, ‘Fallow/other’, and ‘Total’. Row 1: Corn, 5,532,000, 46.59, 89.28. Row 2: Soybean, 5,894,000, 49.63, 95.12. Row 3: Fallow/other, 124,000, 1.04, 1.99. Row 4: Total, 11,550,000, 97.27, 186.39.
a Abbreviation: ae, acid equivalent
b Expenditures are calculated as glyphosate use multiplied by price per kilogram of ae. Glyphosate use values converted from pounds ae using 1 lb = 0.4536 kg.
c Low estimate assumes a price of 8.4 USD per kg ae (equivalent to 3.82 USD per lb ae).
d High estimate assumes a price of 16.1 USD per kg ae (equivalent to 7.32 USD per lb ae).
These expenditure estimates represent baseline spending by farmers on glyphosate prior to any regulatory change and form the foundation for the subsequent analysis of substitution behavior, yield impacts, and revenue changes. While uncertainty remains due to price volatility and partial data suppression for specific formulations, the bounded estimates presented here are consistent with available federal data and market evidence and provide a transparent starting point for the revenue loss estimate developed in the next paragraphs.
Yield Responses to Glyphosate Ban and Revenue Losses Assuming No Substitution
To quantify the production effects of a potential glyphosate prohibition, we first derive yield elasticities with respect to glyphosate use from three studies in the agronomic and economic literature (Table 4). In this context, the elasticity of yield to glyphosate measures the percentage change in crop yield associated with a 1% change in glyphosate use. Under a complete ban and assuming a lack of substitute—approximated as a 100% reduction in use—the elasticity therefore provides a direct estimate of the proportional yield loss.
Elasticity of corn and soybean yield with respect to glyphosate use.

Table 4. Long description
The table presents data on the yield effects of glyphosate use on soybean and corn crops across different regions and studies. It consists of four columns: Crop, Region/study context, Yield effect, Description, and Source. The table has three rows of data and one row for the mean yield effect. Row 1: Crop, Soybean; Region/study context, Argentina (1996-2001); Yield effect, +10.0 percent; Description, Improved weed control and reduced production cost; Source, Qaim and Traxler (2005). Row 2: Crop, Soybean; Region/study context, South America (2013-2018); Yield effect, +9.2 percent; Description, Intacta adoption with glyphosate-based control; Source, Brookes (2018). Row 3: Crop, Corn; Region/study context, Indonesia (field response relative to weedy baseline); Yield effect, +7.8 percent; Description, experiment; Source, Desmarwansyah and Purba (2008). Row 4: Crop, Mean; Region/study context, ; Yield effect, +9.0 percent; Description, ; Source, . The table shows the yield effects of glyphosate use on soybean and corn crops in different regions and studies, highlighting the percentage change in crop yield associated with a 1% change in glyphosate use.
a The corn estimate is derived from experimental yield comparisons across glyphosate application timings relative to a no-control (weedy) baseline.
Table 4 synthesizes evidence from farm-level studies examining the productivity effects of glyphosate-based weed management systems. In two studies examining the use of modern soybean crops in South America Qaim and Traxler (Reference Qaim and Traxler2005) and Brooks (2018) reported that yield gains from glyphosate-based weed control ranged from approximately 9% to 10%, reflecting improved weed management and reduced production costs relative to non-glyphosate crops. Under a complete ban, these gains are interpreted as equivalent yield losses, because producers would forgo the weed control benefits that glyphosate currently provides.
For corn, the available evidence is more limited and based on experimental results. Desmarwansyah and Purba (Reference Desmarwansyah and Purba2008) conducted a field experiment in Indonesia and reported a yield effect of about 7.8% when glyphosate use was compared with a weedy baseline. Taking the estimates from the three above studies together, we adopt a central elasticity of 9% for corn and soybean, implying that a complete loss of glyphosate would reduce their yields by approximately 9% in the absence of immediate adaptation. This ensures consistency across crops while remaining grounded in the range of observed effects.
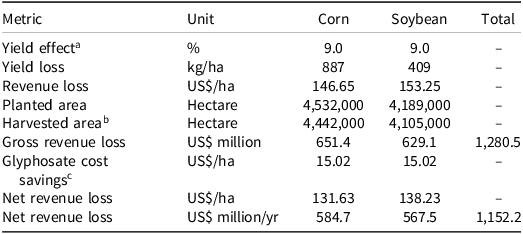
Using the elasticity derived above, we translate yield impacts into farm-level revenue losses under a stylized scenario in which glyphosate use is fully prohibited and no immediate substitution to alternative weed management practices occurs. This scenario represents an upper-bound, short-run estimate only. Under this assumption, Table 5 reports the implied per-acre yield losses, per-acre revenue losses, and statewide revenue impacts using 2024 USDA-NASS data on yields, prices, and harvested acreage in Illinois.
Annual estimated yield and revenue losses from a glyphosate ban without substitution in Illinois corn and soybean systems 2024.d

Table 5. Long description
A table comparing yield and revenue losses for corn and soybean systems in Illinois. The table has 8 rows and 5 columns. The columns are labeled Metric, Unit, Corn, Soybean, and Total. The rows are labeled Yield effect, Yield loss, Revenue loss, Planted area, Harvested area, Gross revenue loss, Glyphosate cost savings, Net revenue loss, and Net revenue loss. Row 1: Metric, Did, 9 percent; N 1, 9 percent; Bucket, bucket underscore 2. Row 2: Metric, Yield loss, 887 kilograms per hectare; N 1, 409 kilograms per hectare; Bucket, bucket underscore 2. Row 3: Metric, Revenue loss, 146.65 US dollars per hectare; N 1, 153.25 US dollars per hectare; Bucket, bucket underscore 2. Row 4: Metric, Planted area, 4,532,000 hectares; N 1, 4,189,000 hectares; Bucket, bucket underscore 2. Row 5: Metric, Harvested area, 4,442,000 hectares; N 1, 4,105,000 hectares; Bucket, bucket underscore 2. Row 6: Metric, Gross revenue loss, 651.4 US dollars million; N 1, 629.1 US dollars million; Bucket, 1,280.5 US dollars million. Row 7: Metric, Glyphosate cost savings, 15.02 US dollars per hectare; N 1, 15.02 US dollars per hectare; Bucket, bucket underscore 2. Row 8: Metric, Net revenue loss, 131.63 US dollars per hectare; N 1, 138.23 US dollars per hectare; Bucket, bucket underscore 2. Row 9: Metric, Net revenue loss, 584.7 US dollars million per year; N 1, 567.5 US dollars million per year; Bucket, 1,152.2 US dollars million per year.
a Yield effect is interpreted as a percentage reduction in yield in the absence of glyphosate-based weed control.
b Harvested area is assumed to be 98% of planted area, consistent with U.S. Department of Agriculture–National Agricultural Statistics Service reporting.
c Glyphosate cost savings are based on average application rates and prices reported in Tables 1 and 2 and reflect the cost of the active ingredient only. Original per-acre values converted at 1 ac = 0.4047 ha.
d Source: USDA-NASS (2025, 2026) and authors’ calculations.
For corn, applying a 9% elasticity implies a yield reduction of about 887 kg ha⁻1. Using harvested area equal to 98% of planted area (4.44 million ha) and an average price of $0.165 kg⁻1 (USDA-NASS 2026), this corresponds to a statewide gross revenue loss of approximately $651 million. For soybean, a 9% yield reduction translates into a loss of about 409 kg ha⁻1. Based on harvested area of 4.10 million ha (also 98% of planted area) and a price of $0.375 kg⁻1 (USDA-NASS 2026), the resulting gross revenue loss is approximately $629 million.
Combined, these estimates imply a total gross farm-revenue loss of about $1.28 billion annually in Illinois. After accounting for glyphosate cost savings of roughly $15 ha⁻1, the net farm-revenue loss declines to approximately $1.15 billion per year. These estimates are based on harvested area constructed as 98% of planted area to remain consistent with yield definitions and represent short-run impacts under a no-substitution scenario, without incorporating behavioral adaptation, substitution toward alternative herbicides, or changes in production practices.
Revenue Changes with Substitution (No Input Price Change or Yield Change)
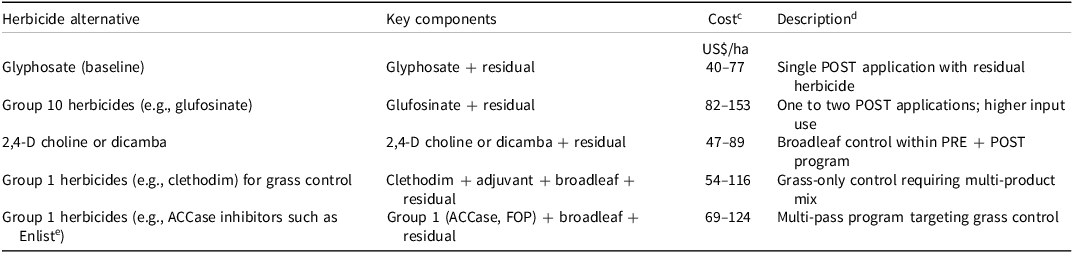
Table 5 shows the estimated revenue losses under the hypothetical absence of glyphosate; however, in practice producers would adopt alternative weed management strategies, implying that realized impacts would reflect substitution, higher input costs, and partial yield recovery rather than a complete loss of weed control. These alternatives span chemical substitution within existing herbicide-tolerant trait systems, increased reliance on soil-residual and premix herbicides, selective postemergence grass control, mechanical control combined with a residual herbicide, and a small but emerging set of bio-based products. Table 6 summarizes the main substitute weed-management programs documented in university Extension guidance and market sources, together with indicative per-hectare cost ranges and performance considerations. These alternative options are consistent with those recommended by university Extension publications for row-crop systems in the Midwest (Loux et al. Reference Loux, Essman, Doohan, Dobbels, Johnson, Young, Zimmer, Hager and Bradley2025).

Table 6. Long description
A table comparing herbicide alternatives, key components, costs, and descriptions. The table has four columns: Herbicide alternative, Key components, Cost in US dollars per hectare, and Description. It contains eight rows, including the header row. Row 1: Herbicide alternative, Glyphosate (baseline); Key components, Glyphosate + residual; Cost, 40-77; Description, Single POST application with residual herbicide. Row 2: Herbicide alternative, Group 10 herbicides (e.g., glufosinate); Key components, Glufosinate + residual; Cost, 82-153; Description, One to two POST applications; higher input use. Row 3: Herbicide alternative, 2,4-D choline or dicamba; Key components, 2,4-D choline or dicamba + residual; Cost, 47-89; Description, Broadleaf control within PRE + POST program. Row 4: Herbicide alternative, Group 1 herbicides (e.g., clethodim) for grass control; Key components, Clethodim + adjuvant + broadleaf + residual; Cost, 54-116; Description, Grass-only control requiring multi-product mix. Row 5: Herbicide alternative, Group 1 herbicides (e.g., ACCase inhibitors such as Enlist); Key components, Group 1 (ACCase, FOP) + broadleaf + residual; Cost, 69-124; Description, Multi-pass program targeting grass control.
a Abbreviations: ACCase, acetyl-CoA carboxylase; FOP, aryloxyphenoxypropionate; POST, postemergence; PRE, preemergence.
b Herbicides are categorized into groups (e.g., group 1, Group 10) based on their mode of action.
c Costs represent full weed-management programs and include herbicide products, application, and a residual (PRE) herbicide component. Original per-acre values were converted at 1 ac = 0.4047 ha. Cost estimates are based on university Extension guidance and market information (Johanns and Hart Reference Johanns and Hart2026; Loux et al. Reference Loux, Essman, Doohan, Dobbels, Johnson, Young, Zimmer, Hager and Bradley2025) and supplemented with industry and commercial pricing data where necessary.
d Descriptions summarize typical program structure; actual applications may vary depending on weed pressure and field conditions.
e Enlist herbicides are manufactured by Corteva Agrisciences, Indianapolis, IN.
The glyphosate-based baseline typically consists of a single postemergence application combined with a preemergence residual herbicide at a total cost of approximately $40 to $77 per hectare. These estimates represent full program costs, including herbicide product, custom application (tractor, fuel, and labor), and the residual preemergence herbicide component. Application cost estimates are based on Iowa custom rate surveys (Johanns and Hart Reference Johanns and Hart2026), which are standard proxies for Illinois given the absence of a comparable state-level survey and the broad similarity in custom rates across the Corn Belt. Most alternative programs entail higher expenditures and greater management complexity. Group 10 herbicides (i.e., glufosinate), commonly used on crops that are resist to glufosinate or 2,4-D (WSSA Group 4), generally require one to two postemergence applications (two assumed for the lower and upper bounds) in addition to a soil-residual herbicide, resulting in total costs of approximately $82 to $153 per hectare. Similarly, trait-based systems that rely on Group 4 herbicides (2,4-D choline or dicamba) are typically implemented both preemergence and postemergence, with one postemergence application in standard conditions but an additional pass sometimes required under higher weed pressure (here included for the calculations), leading to costs in the range of approximately $47 to $89 per hectare. These systems also impose additional operational constraints related to application timing and drift management.
Selective grass control with Group 1 herbicides (ACCase inhibitors) such as clethodim is a lower-cost option at the product level but not at the program level. Clethodim-based systems typically cost $22 to $44 ha⁻1 for grass control (product, adjuvant, and application) but must be paired with a companion broadleaf herbicide ($20–$47 ha⁻1) and a residual preemergence herbicide ($12–$25 ha⁻1), bringing total program costs to about US$54–$116 ha⁻1. The residual leg cannot be assumed to perform uniformly in Illinois: Strom et al. (Reference Strom, Jacobs, Seiter, Davis, Riechers and Hager2022) documented waterhemp populations in Champaign and McLean counties that were resistant to VLCFA inhibitors (Group 15 herbicides) and reported variable control from single preemergence applications of them, which means that one of the residual chemical formulations most commonly used is losing efficacy in the state where its use would expand. More broadly, a large-scale shift toward any single class of substitute chemicals would place substantial selection pressure on weed populations, likely accelerating the evolution of resistance to them over time. The current analysis treats substitute program efficacy as fixed because a full treatment of resistance dynamics is beyond the scope of this manuscript. The cost estimates in Table 6 should therefore be interpreted as short-run projections rather than long-run, steady-state outcomes.
For corn crops that are resistant to 2,4-D herbicides (WSSA Group 4), Group 1 herbicides such as quizalofop face the same structural constraints, requiring broadleaf companions, residuals, and one to two passes, for total costs of about $69–$124 ha⁻1 (two passes used here). These pathways are conditional, multiproduct strategies rather than one-for-one replacements for glyphosate.
Overall, Table 6 illustrates that most feasible substitutes for glyphosate imply higher per-hectare weed control costs and, in many cases, increased management complexity or reliance on multiple applications. While some alternatives overlap with the lower end of the glyphosate cost range under favorable conditions, their average and upper-bound costs are consistently higher. These cost differentials constitute an important second channel—alongside yield effects—through which a glyphosate prohibition would affect farm profitability. This finding is consistent with bioeconomic simulation results showing that in the absence of glyphosate, producers tend to substitute toward more input-intensive weed control strategies, increasing production costs even when yield impacts remain limited (Böcker et al. Reference Böcker, Britz and Finger2018).
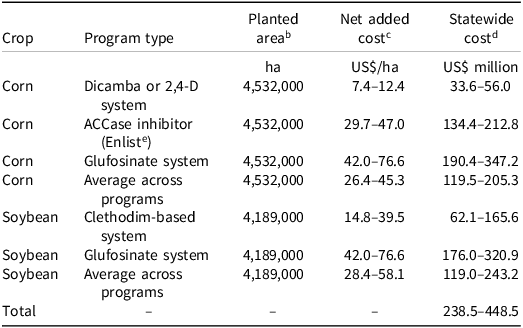
Table 7 translates the per-hectare substitution costs reported in Table 6 into statewide increases in production costs using USDA-reported planted hectares (corn: 4.5 million; soybean: 4.1 million). Net added costs are computed by comparing each alternative program directly to the glyphosate-based baseline, using consistent lower-bound and upper-bound comparisons (i.e., lower-bound substitute cost minus lower-bound glyphosate cost, and upper-bound substitute cost minus upper-bound glyphosate cost). This approach avoids mixing cost scenarios and provides a transparent benchmark for evaluating the incremental cost of substitution across weed-management systems.
Added production costs from substitute weed management programs and implied statewide cost increases in Illinois, 2023. a

Table 7. Long description
A table comparing added production costs for different weed management programs in Illinois. The table has 8 rows and 5 columns. The columns are labeled Crop, Program type, Planted area, Net added cost, and Statewide cost. The rows are labeled with different crops and their respective program types. The Planted area is measured in hectares (ha), Net added cost in US dollars per hectare (US$/ha), and Statewide cost in US dollars million (US$ million). The crops listed are Corn and Soybean, with various program types for each. For Corn, the program types include Dicamba or 2,4-D system, ACCase inhibitor (Enlist), Glufosinate system, and Average across programs. For Soybean, the program types include Clethodim-based system, Glufosinate system, and Average across programs. The table provides specific values for each program type under the columns Net added cost and Statewide cost, indicating the range of costs associated with each program.
a Abbreviations: ACCase, acetyl-CoA carboxylase; ha, hectare.
c Net added cost is calculated as the difference between substitute program costs and the glyphosate-based baseline using aligned lower- and upper-bound comparisons. Original per-acre values converted at 1 ac = 0.4047 ha.
d Statewide cost is calculated as planted area multiplied by net added cost. Total represents the sum of the corn and soybean average-across-programs rows.
e Enlist herbicides are manufactured by Corteva Agrisciences, Indianapolis, IN.
The resulting estimates indicate that shifting away from glyphosate increases production costs across all major alternative pathways. For corn, added costs range from $7.4 to $12.4 ha⁻1 when Group 4 herbicides (dicamba or 2,4-D) are used to $30 to $47 ha⁻1 for ACCase inhibitors, and $42 to $77 ha⁻1 for glufosinate-based herbicides, with an average increase across alternatives of approximately $26 to $45 ha⁻1. For soybean, use of clethodim meant a cost increase of $15 to $39 ha⁻1, and use of glufosinate resulted in a cost increase of $42 to $77 ha⁻1, yielding an average increase of $29 to $58 ha⁻1 across the two main substitution pathways. Aggregated statewide, these cost increases translate into an estimated $119 to $205 million for corn and $119 to $243 million for soybean, for a combined total of approximately $238 to $448 million per year.
These calculations assume that the prices of substitute herbicides and associated management costs remain at current observed market levels. In practice, a glyphosate prohibition would likely increase demand for alternative chemical formulations and place upward pressure on their prices, implying that the estimates reported here are conservative. The analysis also assumes that substitute weed control programs maintain current yield levels; this assumption is relaxed in Table 8. As such, Table 7 isolates the production cost channel of adjustment independently from the yield loss channel quantified earlier, allowing the two mechanisms to be evaluated separately before being combined in the subsequent analysis.
Annual estimated revenue impacts from substitution, input price increases, and yield reductions in Illinois corn and soybean systems.

Table 8. Long description
A table comparing revenue impacts from substitution, input price increases, and yield reductions in Illinois corn and soybean systems. The table has 3 columns and 10 rows. The columns are labeled Scenario, Component, Corn, Soybean, and Total. The rows are labeled Baseline (2 percent yield loss), +15 percent price increase, and +30 percent price increase. The table includes data on yield loss, substitution cost, total revenue loss, and additional cost for both corn and soybean, with values in US$ million. The table shows the impact of different scenarios on the revenue of corn and soybean systems, with total revenue loss and additional costs increasing with higher price increases.
a Yield losses assume a 2% reduction in output and are based on harvested area (see Table 5). Substitution cost is based on data presented in Table 7 and reflects the difference between alternative weed management programs and the glyphosate-based baseline using aligned cost bounds. Total revenue loss is calculated as the sum of yield loss and substitution-related costs under each scenario. Additional cost reflects proportional increases (15% or 30%) applied to substitution costs only.
Revenue Changes with Substitution, Input Price Change, and Yield Change
The previous paragraphs quantified revenue changes assuming that producers substitute away from glyphosate without any changes in substitute input prices or crop yields. In practice, however, a glyphosate prohibition would likely increase demand for alternative herbicides and management programs, placing upward pressure on their prices. In addition, it would introduce a modest risk of yield losses due to narrower weed control spectra and greater management complexity. Extension field trials and agronomic syntheses consistently indicate that even though alternative weed management options can maintain yields under optimal management, average field performance is often slightly lower during transition periods. According to Midwest university Extension publications, typical yield penalties under substitute programs are on the order of 0% to 5% for corn and 2% to 8% for soybean, with smaller losses most likely in well-managed systems (Hager Reference Hager2021; Jha and Yadav Reference Jha and Yadav2022). To remain conservative and consistent with this literature, we assume a uniform 2% yield reduction for both crops under substitution.
Using the updated Table 5 figures, a 2% yield decline corresponds to a revenue loss of approximately $2.94 ha⁻1 for corn and $3.06 ha⁻1 for soybean. Aggregated over harvested hectares, this implies a statewide yield-related revenue loss of about $13.0 million for corn and $12.6 million for soybean, or approximately $25.6 million in total.
In addition to yield effects, we allow substitute herbicide prices to rise in response to increased demand. Consistent with the substitution cost estimates in Table 7, we focus on the average corn production cost across the three alternatives and the use of clethodim for weed control in soybean, net of baseline glyphosate cost savings. Two price scenarios are considered: in Scenario A, prices of substitute weed management programs increase by 15%, reflecting moderate demand pressure and short-run supply constraints. In Scenario B, substitute prices increase by 30%, representing a higher-stress adjustment scenario. In both cases, these increases include the expected increase in equipment cost and in labor because herbicides may need to be applied more than once. The resulting revenue impacts, reported in Table 8, generate additional statewide cost increases of approximately $36 to $67 million under a 15% price increase and $72 to $135 million under a 30% price increase. These adjustments lead to total annual farm revenue losses ranging from $300 to $541 million under the 15% scenario and $336 to $609 million under the 30% scenario. Relative to current production values, these losses correspond to approximately 1.8% to 3.6% of annual corn and soybean farm revenue in Illinois, based on total receipts of roughly $17 billion in 2024 (USDA-NASS 2026).
The findings suggest that the primary economic consequence of a glyphosate ban is not a collapse in production, but rather a transition toward more expensive and operationally complex weed management systems. While producer adaptation is expected to avoid most of the severe yield losses associated with the complete removal of glyphosate, it does so at the cost of higher input expenditures and modest reductions in productivity. Consequently, annual farm revenue losses are estimated at $300 to $609 million statewide, corresponding to approximately 1.8% to 3.6% of current corn and soybean revenues. These values constitute our preferred estimates because they incorporate producer adaptation, increased demand for substitute herbicides, and realistic yield penalties associated with alternative weed management programs.
Compared with optimization-based bioeconomic models (e.g., Böcker et al. Reference Böcker, Britz and Finger2018), which simulate farmer adaptation, the present framework emphasizes observable cost structures and market-level substitution pathways. As a result, it provides a complementary perspective that may better capture adjustment frictions, input price pressures, and management constraints faced by producers during a transition away from glyphosate.
Importantly, the scope of this analysis is deliberately limited to producer-level outcomes. While a glyphosate prohibition, like any other shock, could also affect the rest of the agrifood supply chain (Fiankor et al. Reference Fiankor, Bernhard and Gabriele2025), prices and environmental outcomes (Ye et al. Reference Ye, Wu and Hennessy2021), these channels are beyond the scope of this analysis. In addition, the study is limited to Illinois and could have different impacts in a different state. Likewise, the study does not assess toxicological risks or human health effects that may arise from switching glyphosate for a substitute (Duke Reference Duke2018; Garabrant and Philbert Reference Garabrant and Philbert2002). Addressing those dimensions is very important, but it would require different data, models, and disciplinary approaches, hence it is beyond the scope of our work.
By isolating farm-level revenue effects, this paper provides a clear and tractable benchmark for understanding the immediate economic tradeoffs faced by producers under regulatory uncertainty. The framework can be readily adapted to other states, crops, or agrochemical transitions, ideally in consultation with local Extension specialists and commodity organizations, and it offers a foundation for future work that may integrate environmental, health, or consumer price considerations alongside producer outcomes.
Several dimensions remain beyond the scope of the present analysis and merit attention in future studies. First, the presence of glyphosate-resistant waterhemp in Illinois means that a nontrivial share of producers has likely already adopted some of the alternative weed control options outlined in Table 6 or the producers are already incurring yield losses consistent with those described in Tables 4 and 5 (Evans et al. Reference Evans, Strom, Riechers, Davis, Tranel and Hager2019; Heap Reference Heap2024; Strom et al. Reference Strom, Jacobs, Seiter, Davis, Riechers and Hager2022). To the extent that this partial transition has already occurred, our estimates represent an upper bound on the incremental revenue effect of a formal ban rather than the total effect on all producers. Adjusting the baseline to account for resistance-driven program substitution would require farm-level behavioral survey data linking resistance prevalence to actual producer program choices at the field or county level. No such dataset currently exists for Illinois, making this a priority data collection effort for future work rather than a tractable adjustment within the present framework, unlike in Ontario, where Soltani et al. (Reference Soltani, Shropshire and Sikkema2022) had access to the necessary producer practice data. Second, the substitution options evaluated here focus on chemical alternatives; a complete assessment would also need to account for the costs of integrated weed management strategies such as tillage and cover crops, which carry their own labor, equipment, and yield implications and may become increasingly relevant as resistance to replacement chemical formulations evolves. Third, the farm-level revenue framework developed here treats producers as homogeneous, but a follow-up study could usefully disaggregate outcomes by farm size, labor availability, and management capacity, because these factors are likely to shape both the feasibility and the cost of transitioning away from glyphosate, particularly in regions where custom application and hired labor are common.
Practical Implications
The results of this study provide clear guidance for producers, crop advisors, and policymakers regarding the economic and some management consequences of a potential glyphosate ban in Illinois row-crop systems.
First, the analysis shows that a complete loss of glyphosate without adaptation would result in substantial yield losses, particularly for corn. However, such a scenario is unlikely in practice, because producers will rapidly adjust their weed management strategies. Second, the study demonstrates that substitution toward alternative herbicides is feasible but comes at a cost. Most viable alternatives such as Group 10 herbicides (e.g., glufosinate), Group 4 herbicides (dicamba or 2,4-D), and multi-pass soil-residual herbicides require higher per-hectare expenditures and more precise management. In particular, many of these herbicides require multiple applications, tighter timing windows, and increased attention to environmental conditions, which can increase both financial costs and operational complexity.
For practitioners, this implies that weed management under reduced glyphosate availability will need to shift from a relatively simple, single-product strategy to a more diversified, more costly and management-intensive approach. Third, even under successful substitution, the results suggest that modest yield penalties are likely during the transition period. This highlights the importance of integrated weed management, including combining chemical and nonchemical means of weed control, to mitigate potential yield losses.
From a planning perspective, the estimated statewide revenue losses of approximately 1.8% to 3.6% per year under realistic scenarios provide a useful benchmark for evaluating the economic tradeoffs associated with regulatory changes. While these losses are not catastrophic at the aggregate level, they are meaningful at the farm level, particularly in years when profit margins are tight.
Finally, this study underscores the importance of early adaptation. Producers who proactively diversify their approach to weed management, test alternative chemical formulations, and adjust their operational practices are more likely to limit both cost increases and yield impacts in the event of reduced glyphosate availability.
Overall, the findings suggest that while Illinois corn and soybean producers can adapt to a glyphosate ban, such adaptation will require slightly higher input costs, more complex management, and careful planning to maintain profitability.
Acknowledgments
We thank Jacquie Holland from the Illinois Soybean Association and David Powell from GROWMARK, Inc. for their feedback and comments. We also thank Dr. Ty Witten for sharing Bayer CropScience’s internal survey information on glyphosate use practices.
Funding
This research was supported by the Illinois Soybean Association.
Competing interests
C. Lacey is employed by the Illinois Soybean Association, which provided funding for this research. The remaining authors declare no competing interests.





 Open access

