
Introduction
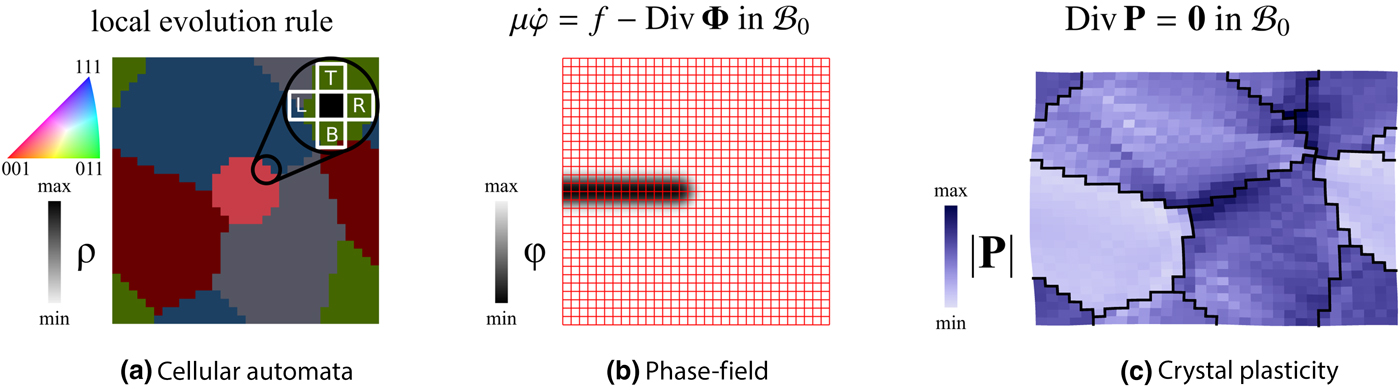
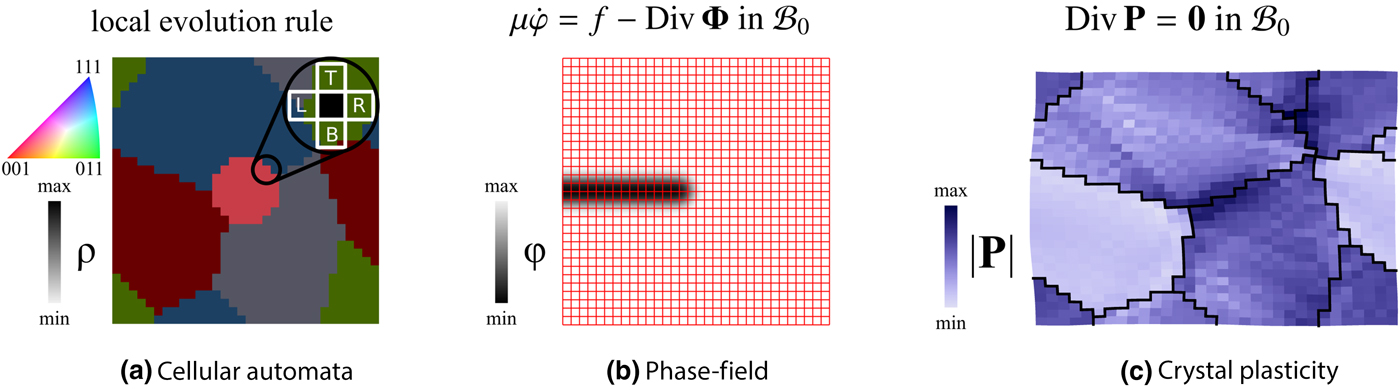
Continuum modeling approaches are well established and routinely used in materials science and engineering. They enable the quantitative investigation of a broad variety of questions related to the improved understanding of diverse material classes at time at length scales relevant for many engineering applications. More specifically, in the field of metallic structural materials, crystal plasticity[ Reference Roters, Eisenlohr, Hantcherli, Tjahjanto, Bieler and Raabe 1 – Reference Dawson and Raabe 3 ] and continuum damage modeling[ Reference Chaboche 4 – Reference Miehe, Welschinger and Hofacker 6 ] allow the examination of micro-mechanical-related phenomena, phase-field models[ Reference Steinbach 7 – Reference Chen and Raabe 10 ] and cellular automata[ Reference Wolfram 11 ] are used to predict microstructure-evolution due to recrystallization and grain growth,[ Reference Hallberg 12 – Reference Moelans, Wendler and Nestler 15 ] and thermodynamic data-aware phase-field and cellular automata models describe solid-state phase transitions[ Reference Hildebrand and Miehe 16 – Reference Vannozzi, Fiorentino, D'Amore, Rumshitzki, Dress and Mauri 18 ] and solidification.[ Reference Warren, Carter and Kobayashi 19 – Reference Asle Zaeem, Yin and Felicelli 22 ] While there are numerous continuum simulation techniques with specific advantages and disadvantages, this paper focuses on the three most common approaches—cellular automata, phase field, and crystal plasticity modeling —and does not attempt to provide an exhaustive review. Figure 1 briefly sketches the underlying concepts of these three methods.
Characteristics of the three most popular simulation methods for mechanical, thermodynamic, and kinetic continuum modeling of metallic materials at the grain scale. (a) Cellular automata, used for modeling static recrystallization: Based on local rules, the state of the material, i.e., crystallographic orientation (color code) and stored energy correlated to dislocation density ρ (gray scale overlay), is changed. (b) Phase-field for fracture: The evolution of the order parameter ϕ is described by a parabolic partial differential equation with driving force f, flux Φ, and viscosity μ in domain B 0. Note the diffuse interface on the regular grid (red lines). (c) Crystal plasticity: Static equilibrium of the stress P is described by an elliptic partial differential equation in domain B 0. Grain boundaries are marked by black lines.
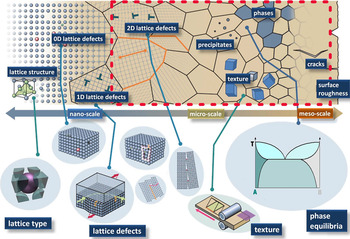
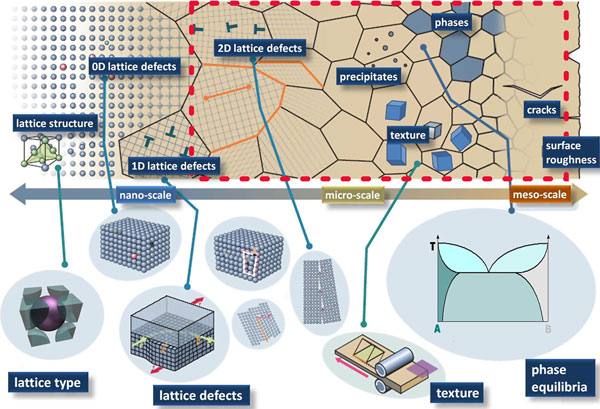
Located at length scales ranging from a few nanometers, e.g., when investigating the deformation mechanisms of nanocrystalline materials,[ Reference Bishop, Lim, Weinberger and Tucker 23 ] up to several micrometers, e.g., when simulating grain growth in engineering materials, the broad class of modeling techniques categorized as a “continuum” approach is used to investigate coarse grained volume units from approximately 1 µm3 to 1 mm3, i.e., containing 1010–1023 atoms. Ensembles of this size are currently not accessible to discrete simulation approaches such as ab initio methods or atomistic simulations based on advanced empirical potentials; handling the larger volumes, which contain up to 1011 m of dislocation length, is even infeasible for typical discrete dislocation dynamics simulations. As sketched in Fig. 2, different material inhomogeneities are present at different length scales. In consequence, the model parametrization suitable to describe the homogenized behavior of individual defects depend on the investigated phenomenon: While the dislocation density is a suitable quantity for crystal plasticity simulations, the chemical composition is often a required quantity to predict phase transformation. It is obvious that coarse graining millions of atoms and thousands of individual defects such as dislocations to arrive at a continuum approximation requires a set of rather strong assumptions. In the absence of an exact theory of coarse graining in microstructure modeling —so far, only some relatively plain renormalization group approaches in the field of multi-pseudo spin homogenization exist[ Reference Kadanoff 24 ]—the art of modeling in this field lies in the pertinent derivation of averaged continuum laws that allow parameterization of the most important effects. It will be shown how such sound incorporation of the dominating physical effects and use of parameter values that are known from either experiments or simulations at smaller length and shorter time scales enables the development of models with predictive capabilities in a certain region of the parameter space.
Relevant features/defects in engineering materials ordered by length scale. Features discussed in this article are enclosed by a red line. Adapted with permission from Raabe from Ref. Reference Koyama, Rohwerder, Tasan, Bashir, Akiyama, Takai, Raabe and Tsuzaki25, Taylor & Francis, 2017 licensed under CC BY-NC-ND 4.0.

This prospective article recapitulates important aspects of continuum modeling in metallic materials, namely simulation approaches, model parametrization, integration of experiments, data processing, and software solutions. For each of these five aspects, an important current trend is identified that helps to further unleash the potential of continuum modeling approaches. In detail, the following emerging aspects are discussed exemplarily on recent work: Integrated multi-physics modeling expand the range of application for newly developed multi-scale informed models with unpreceded predictive qualities. The usage of established free and open source software packages simplifies not only the implementation of new models, but it also fosters their use by a broader scientific community, including e.g., experimentalists who can directly build three-dimensional (3D) microstructure models from their experimental data. Last but not least, advanced statistical analysis built on data science and machine-learning approaches enable the efficient evaluation of the obtained results.
Simulation approaches
As outlined in the introduction, a number of domain-specific continuum modeling approaches exist which have been developed focusing on individual materials science and engineering aspects. For many applications, e.g., static recrystallization[ Reference Kugler and Turk 26 ] or “virtual laboratory”-based materials testing,[ Reference Pagenkopf, Butz, Wenk and Helm 27 – Reference Kraska, Doig, Tikhomirov, Raabe and Roters 29 ] the underlying “single mechanism” assumption is well justified as dominating mechanisms can be clearly identified. In fact, such approaches have significantly contributed to progress in materials science: an effect termed “cold-dwell fatigue”, causing significant damage in titanium turbine blades was understood with the help of crystal plasticity modeling[ Reference Dunne, Rugg and Walker 30 , Reference Cuddihy, Stapleton, Williams and Dunne 31 ]; phase-field methods have been employed to investigate the reasons for the “topological phase inversion” in nickel-based superalloys[ Reference Goerler, Lopez-Galilea, Mujica Roncery, Shchyglo, Theisen and Steinbach 32 ]; and cellular automata modeling helped to understand the influence of nucleation on the recrystallized microstructure.[ Reference Goetz and Seetharaman 33 ]
Nevertheless, the use of task- and mechanism-specific tools prevents examination of engineering processes such as hot rolling, press hardening, and Charpy testing. Therefore, different simulation techniques have been combined to investigate such processes. A combination of several simulation approaches for investigating multi-physics phenomena can be achieved by a seemingly simple data transfer between stand-alone software tools. This has the advantage that modifications on the individual model implementations are not required. Unfortunately, such data transfer is associated with significant challenges as obvious from the following example dealing with the coupled simulation of recrystallization and plastic deformation. The example[ Reference Raabe and Becker 34 ] is concerned with static recrystallization; hence, only a one-way data transfer is required to use the dislocation density computed with the crystal plasticity model as the driving force for recrystallization in the cellular automata model. More detailed: “The coupling between both methods consists of: extracting and translating the state variables of the finite-element plasticity model (texture and accumulated shear) into state variables of the cellular automaton model (texture and dislocation density); mapping these data on the cellular automaton grid; scaling the cellular automaton mesh in terms of the derived cell size, maximum occurring driving force and grain boundary mobility; and in establishing an adequate nucleation criterion, which makes use of these data.”[ Reference Raabe and Becker 34 ] Several other scientists employed similar models to study related problems.[ Reference Güvenc, Henke, Laschet, Böttger, Apel, Bambach and Hirt 35 , Reference Han, Tang, Kou, Cheng, Li and Feng 36 ] It is obvious that the interplay between plastic deformation and grain growth occuring during dynamic recrystallalization can hardly be tackled with such an approach as it requires the repeated two-way communication between the two separated simulation tools.
Above presented example illustrates how already a loose coupling entails technical challenges associated with the interpolation of exchanged data from the grid points of the originating domain to the receiving domain due to different simulation techniques[ Reference Lim, Abdeljawad, Owen, Hanks, Foulk and Battaile 37 ]: While in micro-mechanical simulations FEM- based approaches—often operating on unstructured meshes—have been challenged only recently by spectral methods[ Reference Moulinec and Suquet 38 , Reference Lebensohn 39 ] (working on regular grids), microstructure evolution tools are built on top of various numerical techniques. In phase-field modeling, finite-difference and finite volume schemes working on a fixed square grid are common; the use of spectral methods and FEM is relatively rarely reported.[ Reference Vidyasagar, Tan and Kochmann 40 ] Cellular automata also work on regular, usually square grids even though hexagonal grids are also possible.[ Reference Hernández Encinas, Hoya White, Martín Del Rey and Rodríguez Sánchez 41 ] The required interpolation is not only a technical difficulty, but, as the example of interpolating crystallographic orientations across grain boundaries illustrates, might introduce significant numerical artifacts. A further detail causing interpolation errors is the kinematic framework: small-strain formulations are widespread for microstructure evolution models, as the displacements usually do not introduce severe shape changes. In contrast, large-strain formulations are state of the art for crystal plasticity models.[ Reference Abrivard, Busso, Forest and Appolaire 43 ]
Trend: integrated multi-physics modeling
Limited computational resources, largely separated scientific communities with their distinct approaches and terms, and the high model complexity have impeded the development of strongly coupled modeling approaches. This holds not only for the case of combining microstructure evolution modeling and micro-mechanics as presented above, but also for coupling of damage mechanics and crystal plasticity and other multi-physics applications. A current trend, fueled by matured simulation techniques, improved numerical methods, and powerful computers, is the development of fully coupled approaches that broaden the range of applicable problems and enable a joint tackling of interconnected questions. In the following, examples for such models are presented.
A fully coupled simulation approach for investigating recovery, plastic deformation, and recrystallization has been presented by Abrivard et al.[ Reference Abrivard, Busso, Forest and Appolaire 43 , Reference Abrivard, Busso, Forest and Appolaire 44 ] Limited to two-dimensional (2D) simulations, the presented model—which is formulated in a thermodynamically consistent framework—allows one to investigate with spatial resolution a large part of the process chain, i.e., from hot rolling over cold rolling to materials testing. Approaches aiming at the same phenomena but realized using a spectral method to solve for numerical equilibrium have also been presented.[ Reference Chen, Chen, Lebensohn, Ji, Heo, Bhattacharyya, Chang, Mathaudhu, Liu and Chen 45 – Reference Zhao, Song En Low, Wang and Niezgoda 47 ] In the latter approaches, internal data transfer was possible in a straightforward manner as the same grid, respectively a sub-grid was used to couple phase-field and mechanical quantities. Other multi-physics couplings on the continuum scale consider phase transformation and recrystallization,[ Reference Bos, Mecozzi and Sietsma 48 ] crystal plasticity and fracture,[ Reference Shanthraj, Sharma, Svendsen, Roters and Raabe 49 – Reference Bache, Dunne and Madrigal 52 ] effects of chemical composition and stress on precipitate formation via concentration-dependent elastic properties,[ Reference Schwarze, Gupta, Hickel and Darvishi Kamachali 53 ] recrystallization including the modeling of Zener pinning,[ Reference Raabe and Hantcherli 54 ] and the evolution of a γ′/γ nickel-based superalloy microstructure in dependence of plastic deformation.[ Reference Gaubert, Le Bouar and Finel 55 ]
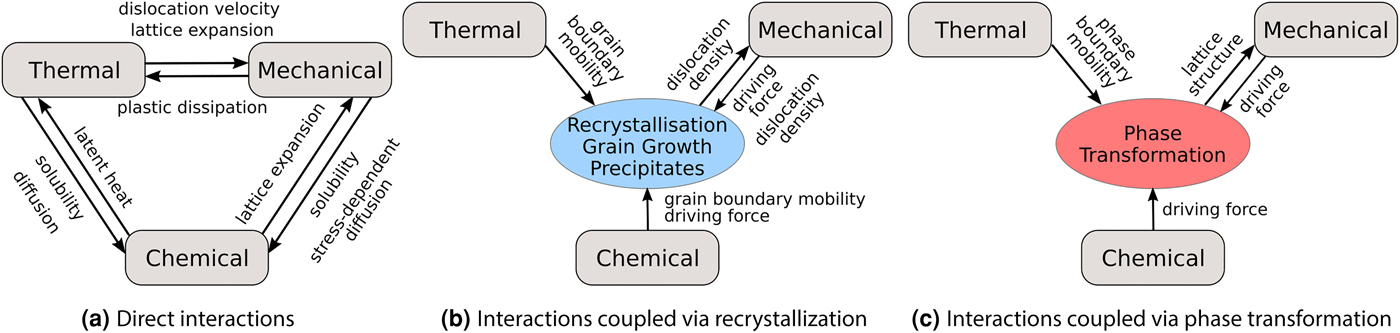
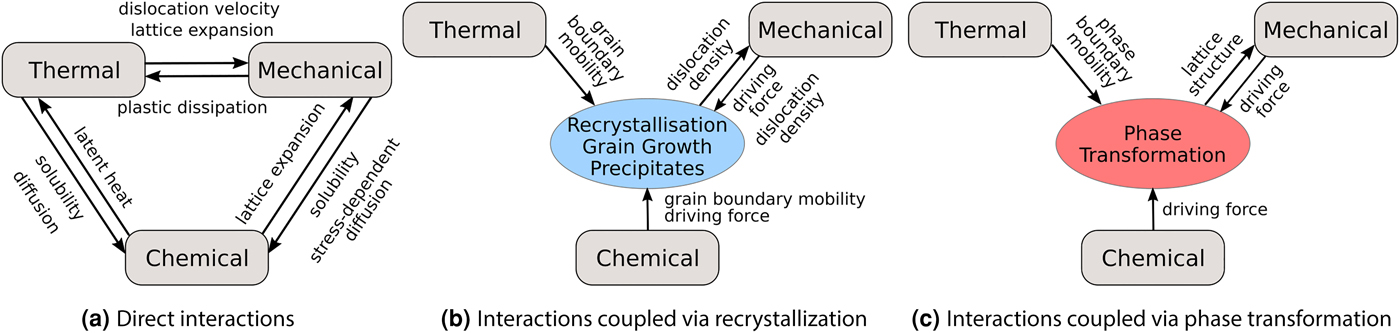
The strength of fully coupled approaches is their ability to investigate the competition or amplification among different mechanisms. As a beneficial side-effect, manual data conversion—a time-consuming process, which is a potential source of errors due to necessary interpolations or misinterpretation—is not required if, e.g., a subsequent recrystallization step after cold rolling can be performed using the same software. Above Integrated Computational Materials Engineering (ICME) examples demonstrate how multi-physics approaches allow one to investigate for example whether microstructure evolution is dominated by recovery or recrystallization, whether the macroscopic stress–strain curve shows softening due to recrystallization or hardening due to cold working, or whether dislocation glide or fracture determines the strain partitioning. For predictive simulations, accurate model parametrization is therefore imperative as the complex and non-linear interactions might amplify inaccuracies to such an extent that trends are not even qualitatively captured. Fig. 3 shows the diverse interactions in a thermo-chemo-mechanical simulation framework, illustrating the manifold and complex interactions between partly competing and partly amplifying mechanisms in such a setup.
Coupling phenomena and interactions in a thermo-chemo-mechanical simulation framework suitable for modeling the process chain in steel production. (a) Direct interactions between the thermal, chemical, and mechanical field quantities. (b) Coupling between the three fields via recrystallization and grain growth (including precipitates). (c) Coupling effects due to the austenite–ferrite phase transformation.
Model parametrization
Continuum modeling requires making strong assumptions on how the collective behavior of atoms or even larger building blocks [dislocations, twins, (internal) surfaces, etc.] can be described. The a priori knowledge of the mechanism(s) relevant to model the behavior under consideration is therefore the key ingredient when designing predictive simulation tools. Based on the nature of the model parameters, models are classified as either phenomenological or physics-based. While phenomenological models are based on the reproduction of the observed behavior, physics-based models are formulated in terms of the underlying physical effects that cause a specific behavior of interest.[ Reference Roters, Eisenlohr, Bieler and Raabe 2 ] In general, physics-based models are valid for a larger parameter range in comparison with phenomenological models which often assume a relative simple formulation. However, the example of Fourier's law—a very phenomenological model for heat transfer not taking into account any physical details such as impurity atoms or crystal defects—shows that their accuracy is in many cases sufficient to model important phenomena.
When developing physics-based models, it is required to decide on the degree of sophistication needed to answer the specific question. In crystal plasticity modeling, for example, the assumption of dislocation glide on dense packed planes and the parametrization in terms of one “dislocation density” population is often very successful despite the knowledge of complex dislocation substructures, movements of dislocations on non-dense planes and local differences in chemical composition with influences on the Peierl's potential. This success can be attributed to the fact that for typical engineering materials, non-planar glide, local composition gradients, dislocation pile-up in front of obstacles, e.g., grain boundaries do not dominate the aggregate behavior. However, in consequence, these simplified models lose their predictive capabilities as soon as at least one other mechanism contributes significantly to the investigated behavior.[ Reference Reuber, Eisenlohr, Roters and Raabe 56 ] A second example is the study of precipitate formation in phase-field modeling. Even though thermodynamic databases are available for large composition ranges, the region of interest in the phase diagram can for many cases be linearly approximated, giving a fast and reliable modeling approach suitable to describe the phase changes for a specific range of concentrations.[ Reference Schwarze, Gupta, Hickel and Darvishi Kamachali 53 ] As a last example, recrystallization modeling using cellular automata and phase-field approaches is discussed. In their simplest form, both approaches neglect the reduction of the driving force for recrystallization due to recovery—an assumption that can be justified for a wide range of chemical compositions and temperatures. Moreover, curvature-driven motion is inherent to the phase-field method but absent in standard cellular automata approaches. In all three cases, it remains in the scientist's responsibility to ensure that the considered problem is within the limits of the employed simulation approach.
The parameter values of both phenomenological and physics-based models need to be determined to obtain the behavior of a certain material. This is typically associated with conducting (and designing) experiments. The distinct advantage of physics-based models is the ability to identify their parameters with measureable quantities such as stacking fault energy, dislocation density, or stored elastic energy. However, physics-based models are often parameterized by a larger number of parameters that are often harder to obtain than the simple quantities used for phenomenological models.
Trend: multi-scale informed models
Developing and employing a physics-based continuum-scale model can be separated into two tasks: understanding the relevant physical mechanisms to cast them into model equations and determine the specific parameters of the material under investigation. A current trend in continuum modeling is the use of simulation techniques at lower length-scales for both tasks to minimize experimental efforts. Such multi-scale or scale-bridging approaches require to combine expertise from different fields, i.e., physicists doing ab initio simulations, material scientists for the discrete dislocation dynamics simulations and finally mechanical engineers and computational mechanics for implementing the continuum-scale models. The following short overview briefly recapitulates how discrete simulation techniques can be used to develop and adjust continuum models.
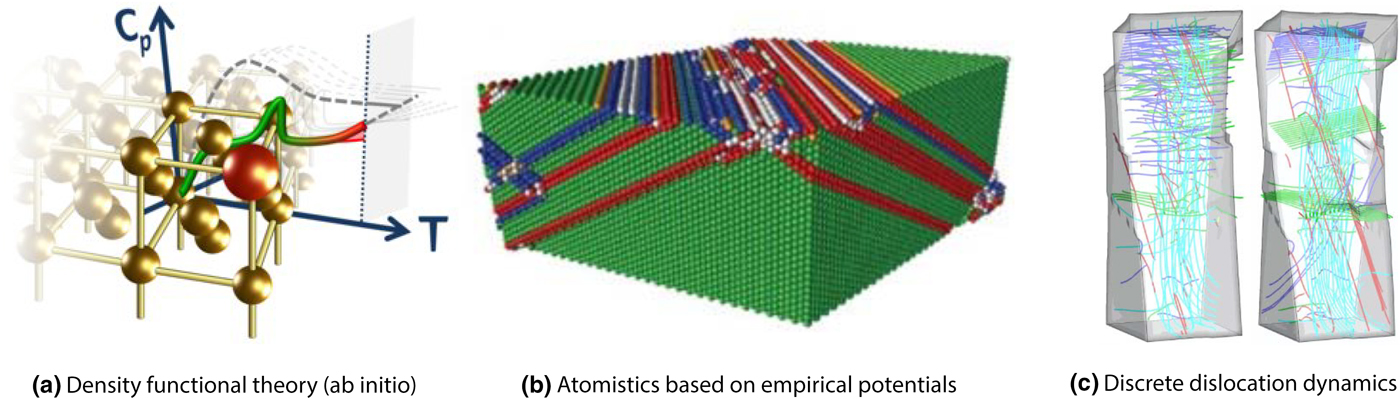
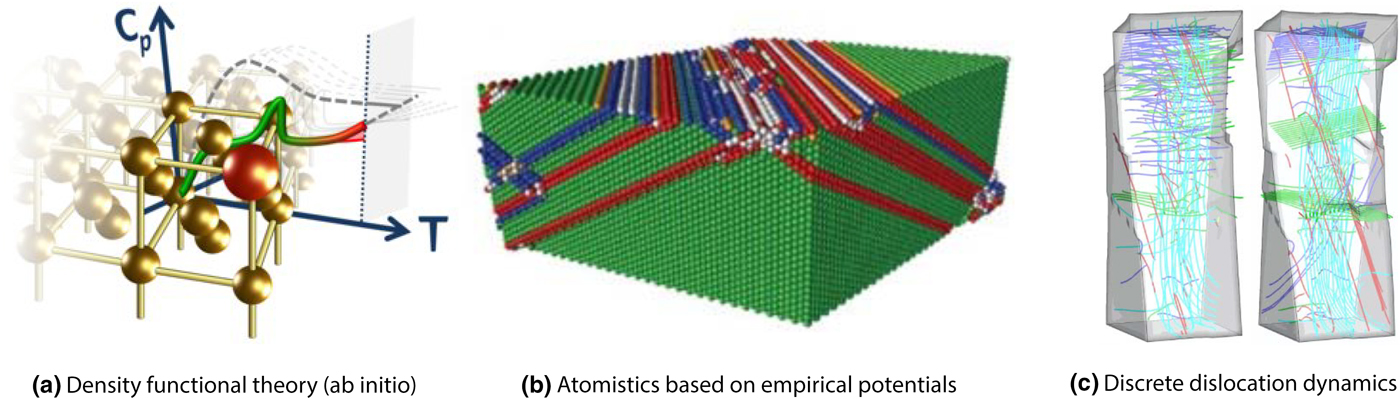
An example where a crystal plasticity model was developed and parameterized based on kinetic Monte Carlo simulations is given by Cereceda et al.[ Reference Cereceda, Diehl, Roters, Raabe, Perlado and Marian 57 ] Similarly, key parameters for the modeling of iron have been obtained from atomistic simulations.[ Reference Köster, Ma and Hartmaier 58 ] The parameters describing different interaction types among dislocations have been successfully determined using discrete dislocation dynamics simulations for the three most relevant crystal structures.[ Reference Queyreau, Monnet and Devincre 59 – Reference Bertin, Tomé, Beyerlein, Barnett and Capolungo 62 ] Discrete dislocation dynamics simulations have also been used to identify and quantify dislocation interactions relevant for continuum modeling.[ Reference Stricker 63 – Reference Groh, Marin, Horstemeyer and Zbib 66 ] Based on ab initio results, crystal plasticity models[ Reference Wong, Madivala, Prahl, Roters and Raabe 67 ] and phase-field models for phase transformation have been also developed and parametrized.[ Reference Zhao, Shen, Li and Wang 68 , Reference Shchyglo, Hammerschmidt, Čak, Drautz and Steinbach 69 ] The different small-scale simulation techniques employed to develop and parametrize continuum-scale models are graphically represented in Fig. 4.
Small-scale simulations used to develop and parametrize continuum-scale models. (a) Ab initio (Density Functional Theory, DFT) simulations. Figure displays and artistic sketch. Adapted with permission from T. Hickel from Ref. Reference Hickel, Kattner and Fries70, John Wiley & Sons, 2014. (b) Atomistic modeling based on empirical potentials. Figure display defect structures in Ni3Al according to the following color code: Red and orange, Perfect L12 structure; green, pseudo-twin structure; blue, anti-phase boundary; white, complex stacking faults; white, other defects. Adapted from Ref. Reference Amodeo, Begau and Bitzek71, Taylor & Francis, 2014 licensed under CC BY 3.0. (c) Discrete Dislocation Dynamics (DDD). Figure display dislocation structures in aluminum single crystals under torsion load. The sample shown in the left has cross-slip enabled, the sample shown in the right has cross-slip disabled. Color code indicates glide systems according to: Turquoise, Burgers vector parallel to the torsion axis; blue, dislocation pile-ups on parallel glide planes; red and green, dislocation pile-ups on parallel glide planes. Adapted from Ref. Reference Senger, Weygand, Kraft and Gumbsch72, IOP Publishing, 2011.
The same advantages that are valid when employing continuum-scale models hold for the complementation and replacement of small-scale experiments when developing continuum-scale models: simulations are fully observable, they are often cheaper to perform and they allow systematic investigations of the parameter range. Hence, multi-scale approaches for model development are especially suited for complex coupled models with multiple parameters.
Integration of experiments
Computational materials science has been established as an important sub-discipline of materials science and engineering with a distinct community. However, a close cooperation between computational and experimental materials science is advantageous for two main reasons: firstly, to benchmark the computational models on the experimental reality and secondly for an improved understanding based on the broader view enabled by the combination of results from experiments and simulation. Ideally, starting from matching results between experiment and simulation, additional data can be extracted from the simulation that is not accessible from within the experiment. In this context, an evident advantage of simulations over experiments is the possibility to perform systematic parameter studies, which might even reach areas in the parameter space not feasible for experimental studies.
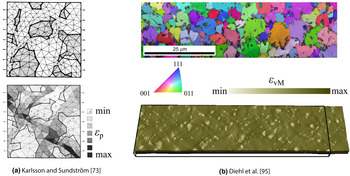
Essentially, the comparison between experimental and numerical results can be done in two ways: either by comparing average results or by comparing field quantities. While quantitative comparisons are desirable, qualitative comparison is a viable option to identify trends and associated mechanisms. The use of average results from microstructure evolution simulations allows one to discuss the time evolution of, e.g., recrystallized volume fractions. Typical examples in micro-mechanics are the comparison of yield behavior[ Reference Cereceda, Diehl, Roters, Raabe, Perlado and Marian 57 ] and stress–strain curves.[ Reference Wong, Madivala, Prahl, Roters and Raabe 67 ] An example for a qualitative comparison of field data, namely the shape and spatial arrangement of two evolving phases is given by Goerler et al.[ Reference Goerler, Lopez-Galilea, Mujica Roncery, Shchyglo, Theisen and Steinbach 32 ] For a quantitative one-to-one comparison, microstructure models are built from the measured microstructures. This approach is especially common in micro-mechanics. An early work in which the microstructure of a dual-phase steels has been used as input to an FEM micro-mechanical simulation has been presented by Karlsson and Sundström already in 1974.[ Reference Karlsson and Sundström 73 ] A direct comparison, however, was not possible due to experimental restrictions. Today, crystal plasticity modeling based on electron backscatter diffraction (EBSD) data is well established.[ Reference Choi, Kim, Woo, Han and Kwak 74 , Reference Wang, Barabash, Yang, Bieler, Crimp, Eisenlohr, Liu and Ice 75 ] In conjunction with digital image correlation, a direct comparison between experimentally obtained and simulated strain fields is possible.[ Reference Tasan, Diehl, Yan, Zambaldi, Shanthraj, Roters and Raabe 76 , Reference Pinna, Lan, Kiu, Efthymiadis, Lopez-Pedrosa and Farrugia 77 ]
Since the acquisition of real microstructures is associated with experimental efforts, computational studies in microstructure evolution[ Reference Zhu and Militzer 78 – Reference Contieri, Zanotello and Caram 80 ] and micro-mechanical[ Reference Pagenkopf, Butz, Wenk and Helm 27 , Reference Abdolvand and Daymond 81 , Reference Wan, Cuddihy, Jiang, MacLachlan and Dunne 82 ] modeling are often performed on synthetic microstructures. In many cases, microstructures are generated using Voronoi tessellation approaches, which are also called “power diagrams” in the mathematics community and are known from the Wigner-Seitz cell in materials science. Current tools for generation of synthetic microstructures can take a number of statistical quantities into account,[ Reference Pagenkopf, Butz, Wenk and Helm 27 , Reference Groeber and Jackson 83 ] making artificial microstructures statistically equivalent to real ones with respect to selected features. Another suitable way is the physics-based modeling of microstructure evolution, e.g., solidification or recrystallization, for subsequent simulations. Such approaches, especially the more complex flavors, are certainly helpful for simulation series using virtual laboratories or parameter studies. However, real microstructures exhibit a tremendous complexity. This holds especially for materials containing more than one phase, e.g., dual-phase steels and α–β titanium alloys. In cases where even subtle differences between real and synthetic microstructure are of importance, i.e., when tail and head of a distributed quantity significantly alter the behavior—consider damage modeling and its dependence on stress and strain peaks—the use of real microstructures is without alternative. In this context, it should be mentioned that not even accepted measures exist to reliably discriminate all differences between microstructures.
Trend: three-dimensional microstructure models based on experimental data
The volumes accessible to simulation studies in reasonable time frames grow with increasing computation power. At the same time, the availability of advanced characterization techniques allows one to acquire 3D microstructures with high precision. Consequently, a current trend in continuum modeling is the use of such datasets as input data. By that the limitations of 2D real microstructures, i.e., the missing subsurface microstructure[ Reference Zeghadi, Nguyen, Forest, Gourgues and Bouaziz 84 – Reference Diehl, Shanthraj, Eisenlohr and Roters 86 ] as well as the shortcomings of artificial microstructures, i.e., missing in-grain-scatter, simplified grain morphology, and idealized phase distribution, can be overcome. The works presented in the following make use of recently developed characterization techniques to acquire realistic microstructure models.
Synchrotron measurements allow the non-destructive acquisition of in situ data at the cost of expensive and costly experimental procedures. Different synchrotron-based acquisition techniques[ Reference Wang, Li, Almer, Bieler and Barabash 87 ] have been used to generate microstructure models for subsequent simulations: differential-aperture x-ray microscopy (DAXM),[ Reference Zhang, Li, Eisenlohr, Liu, Boehlert, Crimp and Bieler 88 ] 3D x-ray diffraction (XRD),[ Reference Abdolvand, Majkut, Oddershede, Wright and Daymond 89 ] and high-energy diffraction microscopy (HEDM).[ Reference Pokharel, Lind, Li, Kenesei, Lebensohn, Suter and Rollett 90 , Reference Turner, Shade, Bernier, Li, Schuren, Lind, Lienert, Kenesei, Suter, Blank and Almer 91 ] On the laboratory scale, x-ray tomography[ Reference Maire and Withers 92 ] is an alternative, where however most setups are not readily suitable for orientation-aware polycrystal characterization.[ Reference Diehl, Wicke, Shanthraj, Roters, Brueckner-Foit and Raabe 51 ] However, current developments in the field of XRD contrast tomography take crystallographic orientation-aware in situ measurements in three dimensions out of the realm of large-scale synchrotron facilities.[ Reference McDonald, Reischig, Holzner, Lauridsen, Withers, Merkle and Feser 93 ] As a destructive alternative that prohibits direct comparison of e.g., strain partitioning, serial sectioning (3D) EBSD[ Reference Zaefferer, Wright and Raabe 94 ] has been established. To illustrate the increased complexity of the models, Fig. 5 displays a microstructure model of a dual-phase steel in 2D from 1974[ Reference Karlsson and Sundström 73 ] and a recent 3D model of a similar material from 2017.[ Reference Diehl, An, Shanthraj, Zaefferer, Roters and Raabe 95 ]
Increasing complexity of microstructure models for micro-mechanical simulations. (a) Dual-phase steel model from 1974.[ Reference Karlsson and Sundström 73 ] The phase distribution is shown in the top image where black color indicates martensite and white color indicates ferrite. The resulting distribution of plastic strain (ε p) under uniaxial loading in horizontal direction is shown in the bottom image. Adapted from Ref. Reference Karlsson and Sundström73, Elsevier, 1974. (b) Dual-phase steel model from 2017.[ Reference Diehl, An, Shanthraj, Zaefferer, Roters and Raabe 95 ] Crystallographic orientation in terms of an inverse pole figure coloring and phase distribution (dark areas indicate martensite) are shown in the top image. The resulting distribution of equivalent total strain (ε vM) under uniaxial loading in the horizontal direction is shown in the bottom image.

The use of highly resolved 3D datasets as input for continuum-scale models has two distinct advantages: limitations of 2D models and artificially created microstructures are surmounted and—depending on the selected characterization method—a qualitative comparison of field data is possible. This allows one to benchmark models with unpreceded accuracy and accompany experiment by valuable data for an improved understanding. Exemplarily, the local stress distribution can be contributed from micro-mechanical simulations or the influence of selected aspects of the materials behavior can be systematically investigated.
Data processing
Evaluating the data obtained from simulations is a crucial point for extracting information and gaining knowledge. A suitable evaluation and visualization is therefore imperative when simulation techniques are used to produce more valuable information than just “beautiful pictures”. In comparison with most laboratory-scale experiments, simulations are able to generate a vast amount of data as the full state of the model can be written out at any time increment. This distinct advantage of simulations, however, requires systematic analysis to separate important from unimportant information. Systematic data processing, visualization, and analysis are therefore important steps to make use of the information obtained from continuum-scale simulations.
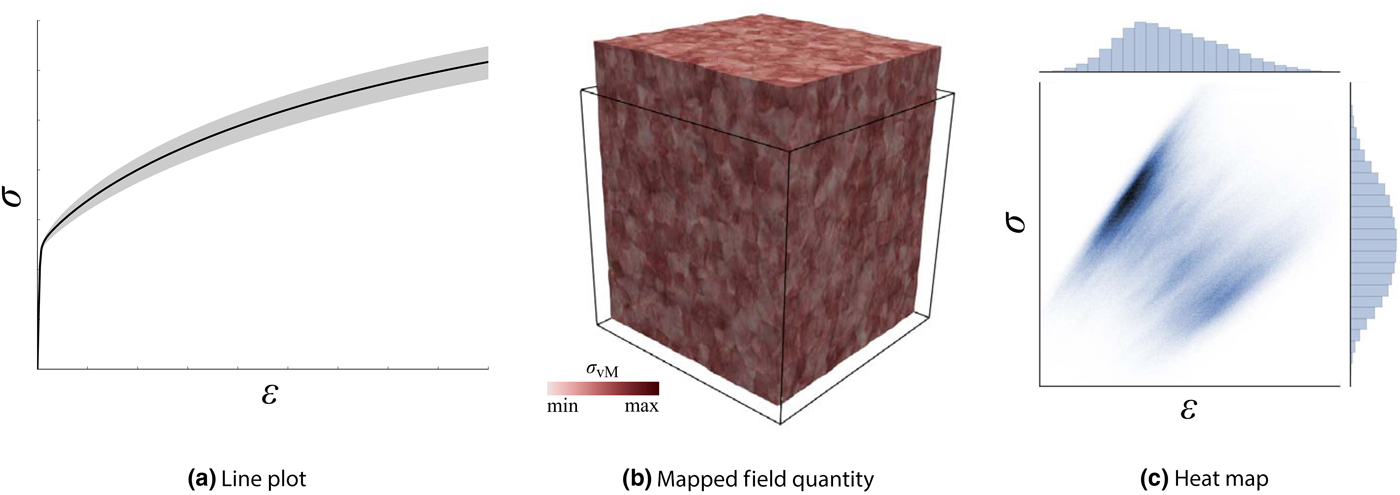
While employed models and preprocessing techniques (e.g., for using experimental data as discussed in Integration of experiments) are discussed extensively in a large number of publications, little attention is typically paid to the post processing of simulation results. This can be understood from the fact that the small simulation sizes and the focusing on single effects simplified evaluation of grain scale simulations in the past. Typical visualization techniques include line plots to display average quantities[ Reference Zhang, Diehl, Roters and Raabe 28 , Reference Wong, Madivala, Prahl, Roters and Raabe 67 ] and spatially resolved quantities mapped on the sample geometry to present field data[ Reference Abrivard, Busso, Forest and Appolaire 44 , Reference Tasan, Diehl, Yan, Zambaldi, Shanthraj, Roters and Raabe 76 , Reference Wan, Cuddihy, Jiang, MacLachlan and Dunne 82 ]—in the latter case the often used rainbow color bars renders efforts to interpret the data extremely hard.[ Reference Moreland, Bebis, Boyle, Parvin, Koracin, Kuno, Wang, Pajarola, Lindstrom, Hinkenjann, Encarnação, Silva and Coming 96 , Reference Borland and Taylor 97 ] It can be assumed that the types of plots shown in publications also represent the visualization types used by the researchers to analyze their data. Hence, correlations not visible in typically used line plots and field maps (including maps in orientation space) might remain undiscovered in the acquired data.
While many individual phenomena are obvious in line plots,[ Reference Liedl, Traint and Werner 98 ] cross-coupling effects that are of special importance in complex multi-physics simulation approaches might be hidden if the data are presented in such simple diagrams. The same applies for spatially resolved pictures of field data: while they are important to communicate results, the possibility of easily producing them in large quantities from simulation results should not prevent a thorough search for features in the obtained data. It remains therefore a challenge to visualize, analyse, and interprete data obtained from simulations.
Trend: advanced statistical analysis
The increasing model size due to finer discretization and larger volumes (discussed in Trend: three-dimensional microstructure models based on experimental data) as well as the employment of more complex models (as outlined in Trend: integrated multi-physics modeling) render visualization-based manual data analysis an insufficient option: hand-operated inspection of field data for identification of “interesting” regions becomes cumbersome due to the sheer size of the virtual samples, especially if an unbiased view not aligned with the direction of the initial coordinate system is taken and no iso-surface filtering according to certain ad hoc rules is employed. Similarly, high-dimensional data (e.g., shear rates on different types of slip systems, crystallographic orientations) and especially the interplay between different vector- or tensor-valued fields is impossible to grasp for the human eye. Some recent studies—not only concerned with continuum simulations—that follow the trend of using advanced data analysis in materials science are presented in the following.
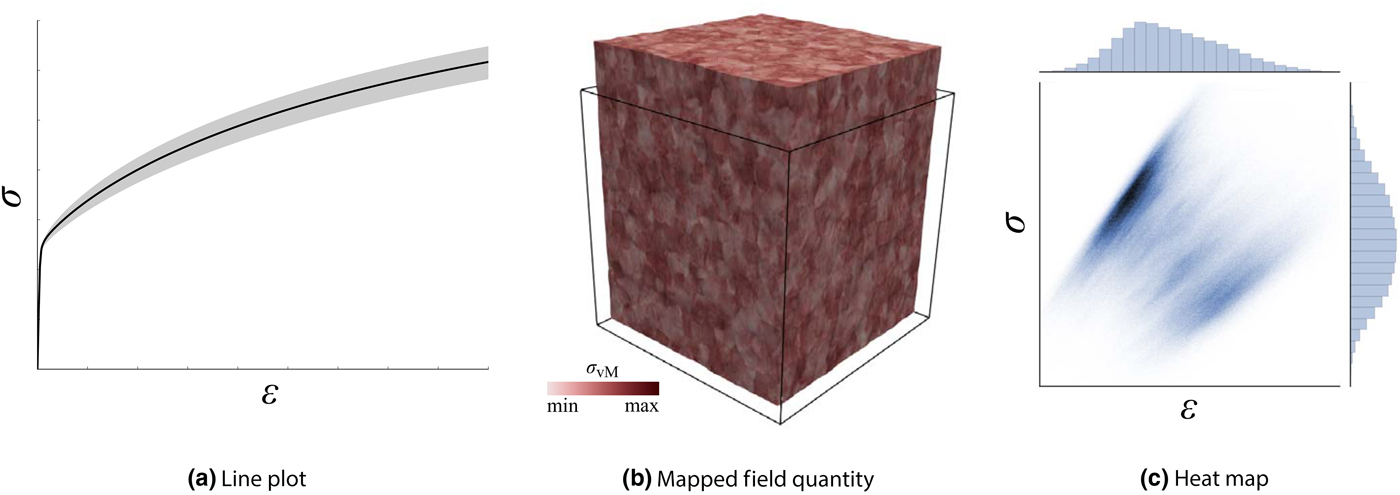
Advanced analysis techniques allow one to identify complex interactions to arrive at elaborated (micro)structure–property relationships. Statistical analysis, using non-spatially ordered data is a significant advancement, which gained momentum recently.[ Reference Diehl, An, Shanthraj, Zaefferer, Roters and Raabe 95 , Reference De Geus, Peerlings and Geers 99 ] Figure 6 shows how spatially arranged field data and especially heat maps provide much more information than simple one-dimensional line plots. An even larger progress can be expected from the use of machine-learning approaches that detect patterns themselves. Data science/machine-learning approaches, currently gaining traction in materials science[ Reference Kalidindi and De Graef 100 ] in the field of microstructure recognition,[ Reference Chowdhury, Kautz, Yener and Lewis 101 – Reference Azimi, Britz, Engstler, Fritz and Mücklich 103 ] and feature extraction,[ Reference Gomberg, Medford and Kalidindi 104 ] can be expected to aid evaluation of continuum-scale simulations in the future. Running such analysis requires efficient data structures capable to store a large amount of data that can be accessed in a non-consecutive way. HDF5-based[ Reference Folk, Heber, Koziol, Pourmal and Robinson 105 ] file formats seem to establish themselves as the standard in experimental[ Reference Jackson, Simmons and De Graef 106 , Reference Jackson, Groeber, Uchic, Rowenhorst and Graef 107 ] and computational[ Reference Schmitz 108 , Reference Diehl, Eisenlohr, Zhang, Nastola, Shanthraj and Roters 109 ] materials science. The current process of establishing standard data descriptors suitable for fast and random access can contribute to the efficient use of tools for automated data mining.
Results from data different analysis and visualization approaches applied to a dataset obtained from a micromechanical simulation. (a) Average results in terms of a stress–strain curve. (b) Equivalent stress mapped onto the deformed configuration of the probed material. (c) Heat map showing the distribution of stress–strain relations for each point in the simulation. Strain and stress in loading direction are denoted as ε and σ, respectively and σ vM is the equivalent stress.
Employing advanced data analysis techniques to results obtained from continuum simulations enables deeper insights into phenomena predicted by the underlying models. While non-classical visualization and plotting methods can be a significant step forward in finding and quantifying expected features, machine learning approaches are especially suited to automatically extract unpredicted couplings.
Software solutions
A huge variety of models for continuum simulations has been developed in the last 20 years. However, as the development of new models or the improvement of existing models are much more prestigious in materials science than the actual implementation, only a few implementations have found their way into routine application. In fact, many developed models are only implemented in prototype software to obtain results for presenting the model. For such project-specific in-house software there is no clear differentiation between developers and users: Members of the research group develop a model, implement it, and use it. In consequence, usability aspects are of little importance as only experts with reliable personal support are expected to use the software. Moreover, there are no software solutions with commercial support that can fulfill the various demands required for continuum simulations in materials science and engineering.
Among the rare examples for implementations that have gained significant attention in micromechanics are the spectral method solver, including material models, by Lebensohn[ Reference Moulinec and Suquet 38 ] and the crystal plasticity Abaqus UMAT developed by Huang.[ Reference Huang 110 ] The latter one stands exemplarily for the common approach of using commercial FEM solutions such as Abaqus, MSC.Marc, or LS Dyna as the basis for the model development. However, these commercial tools are used for solving the governing equations and for visualization, they contain no materials science and engineering-related features. In microstructure evolution simulation, the commercial MICRESS software has gained significant attention.
The task-specific development of single-purpose tools has significant drawbacks for developers and (potential) users. Developers, one the one hand, need to re-implement certain aspects for every new model. While libraries for general-purpose functionalities such as handling of file IO (input and output) and numerical tasks exist, in the case of multi-physics modeling a true re-implementation associated with significant efforts is required even when only a single aspect of a sub-model is of scientific interest. Users, on the other hand, are handicapped by the missing portability and usability. Especially experimentally oriented scientists with little knowledge in computer programming are hence deprived of using state of the art simulation tools to further analyzing their experimentally obtained data.
Trend: established free and open source software packages
The absence of widely used software packages for continuum-scale simulations can be explained by the high and long-lasting efforts associated with developing such tools. Developing advanced multi-physics continuum simulation tools for a large community requires not only the combined interdisciplinary knowledge from physics, materials science, and mathematics, but also the knowledge how to use elaborated tools for testing and debugging. As an important consequence, during e.g., a Ph.D. project, a state of the art framework cannot be developed. Rather, many developers with their specific expertise need to improve or enhance existing tools or frameworks in a joint manner. The general trend of collaborative software development has therefore also been followed in materials science and engineering as the following examples show.
Extendable open-ended frameworks for continuum-scale simulations, which have emerged in recent years, allow to re-use aspects like storage of data, coupling to analysis tools (see Trend: advanced statistical analysis) and to experimental input data (see Trend: three-dimensional microstructure models based on experimental data), numerical solution techniques and standard models. An overview of free and open sources tools, categorized into micro-mechanics (AMITEX_FFTP, DAMASK), phase-field (OpenPhase, FiPy), and general numerical libraries (deal.II, MOOSE framework, FEniCS project) is given in Fig. 7. While the tools presented in the first two categories allow one to readily perform simulations, the software in the “general numerical solver frameworks” category can substitute above-mentioned commercial FEM solvers—with the additional benefit of having the chance to modify the source code. How beneficial such frameworks are for the community can be illustrated by a few basic statistics: DAMASK[ Reference Roters, Eisenlohr, Kords, Tjahjanto, Diehl, Raabe and Cazacu 111 ] contains more than 50,000 lines of Fortran code in 65 files and additionally 165 files of Python code for pre and post-processing. OpenPhase contains more than 50,000 lines of C++ code in almost 100 files. In contrast, the mentioned crystal plasticity routine of Huang[ Reference Huang 110 ] consists of less than 3000 lines of code (including comments).
Selection of free and open source software solutions for continuum modeling classified after their main focus. (a) Crystal plasticity tools: DAMASK[ Reference Roters, Eisenlohr, Kords, Tjahjanto, Diehl, Raabe and Cazacu 111 ] and AMITEX_FFTP. (b) Phase-field solvers: OpenPhase and FiPy.[ Reference Guyer, Wheeler and Warren 112 ] (c) General solver frameworks for scientific and engineering modeling: MOOSE framework,[ Reference Gaston, Newman, Hansen and Lebrun-Grandié 113 ] FEniCS project,[ Reference Alnæs, Blechta, Hake, Johansson, Kehlet, Logg, Richardson, Ring, Rognes and Wells 114 ] and deal.II.[ Reference Arndt, Bangerth, Davydov, Heister, Heltai, Kronbichler, Maier, Pelteret, Turcksin and Wells 115 ] The DAMASK logo by Philip Eisenlohr is licensed under CC BY-ND 4.0. The AMITEX_FFTP logo is reproduced with permission by the copyright holder (Lionel Gélébart). The OpenPhase logo is reproduced with permission by the copyright holder (ICAMS). The FiPy logo is reproduced with permission by the copyright holder (NIST). The MOOSE framework logo is reproduced with permission by the copyright holder (Derek Gaston). The FEniCS project logo by Mattias Schläger is licensed under CC BY-SA 4.0. The deal.II logo is reproduced with permission by the copyright holder (Wolfgang Bangerth).
Free and open source software packages have two main advantages: existing models can be used and extended, reducing entry barriers for employing and developing continuum models. Synergy effects during implementation especially occur for complementing fields of expertise, e.g., when a new homogenization scheme or damage model can be built on existing crystal plasticity. DAMASK, for example, was used and extended in multiple Ph.D. projects in research groups not belonging to the core development team[ Reference Stricker 63 , Reference Meier, Schwarz and Werner 116 – Reference Ebrahimi and Hochrainer 118 ] and one of the models developed in a cooperation made it into the standard release distribution.[ Reference Cereceda, Diehl, Roters, Raabe, Perlado and Marian 57 ] Moreover, efforts for documentation, compilation of best-practice examples, and systematic testing can be shared among the developers to provide an added value for the materials science community—including experimentally oriented scientists not interested in model development.
Conclusions and outlook
Continuum modeling approaches, located at the upper end of time and length scales, are an important tool for computational materials science. Although these approaches require strong assumptions and simplifications, their applicability to time and length scales relevant for engineering processes renders them important tools in industry and academia. Current trends related to continuum modeling are expected to increase the benefit of such approaches even more: integrated multi-physics modeling enables one to tackle ICME-related problems that have been out of scope in the past and multi-scale-informed models accelerate development of models that accurately represent the reality. The strong coupling to highly resolved experimental 3D data tightens the connection between reality and simulation and advanced statistical analysis ensures that even unpredicted phenomena are discovered. Finally, the use of established free and open source software packages enables faster development and makes state of the art simulation tools available to the broader materials science and engineering community.
Acknowledgments
The funding of the TCMPrecipSteel project in the framework of the SPP 1713 “Strong coupling of thermo-chemical and thermo-mechanical states in applied materials” by the Deutsche Forschungsgemeinschaft (DFG) and the support of D. Raabe and F. Roters in writing this article are gratefully acknowledged.